Rectangle Pattern Trading Strategy Guide (Updated 2025)
Join our Telegram channel for more market analysis & trading tips: t.me/synapsetrading
The rectangle pattern represents a consolidation of prices, where buyers and sellers are equally matched, so there is movement both up and down, but confined within a range.
This makes the rectangle pattern a very versatile price pattern for trading breakouts.
There are 2 main varieties of rectangles – namely the wide range and narrow range rectangles, each with different trading strategies.
In this post, I will show you how to take advantage of the rectangle pattern to trade breakouts, how to avoid false breakouts, and the best trading strategies for this price pattern.

Rectangle Chart Pattern Trading Strategy Guide
Table of Contents
The 2 Types of Rectangle Patterns
A rectangle pattern, as its name suggests, is a rectangular consolidation range in which prices move about.
Buying and selling forces are balanced, so prices could technically break out of either direction, but there is a higher probability of prices breaking out in the same direction as the prior trend, hence it is classified as a continuation price pattern, because it continues the movement in the same direction.
There are 2 main varieties:
- The narrow range rectangle pattern
- The wide range rectangle pattern
The main difference is the height of the pattern, and this has major implications.
The wider the range (taller rectangle), the more volatility there is, and the more likely to lead to a trend reversal.
The more narrow the range (shorter rectangle), the more likely that prices will continue in the same direction as the trend upon breakout.
Rectangle Pattern Psychology
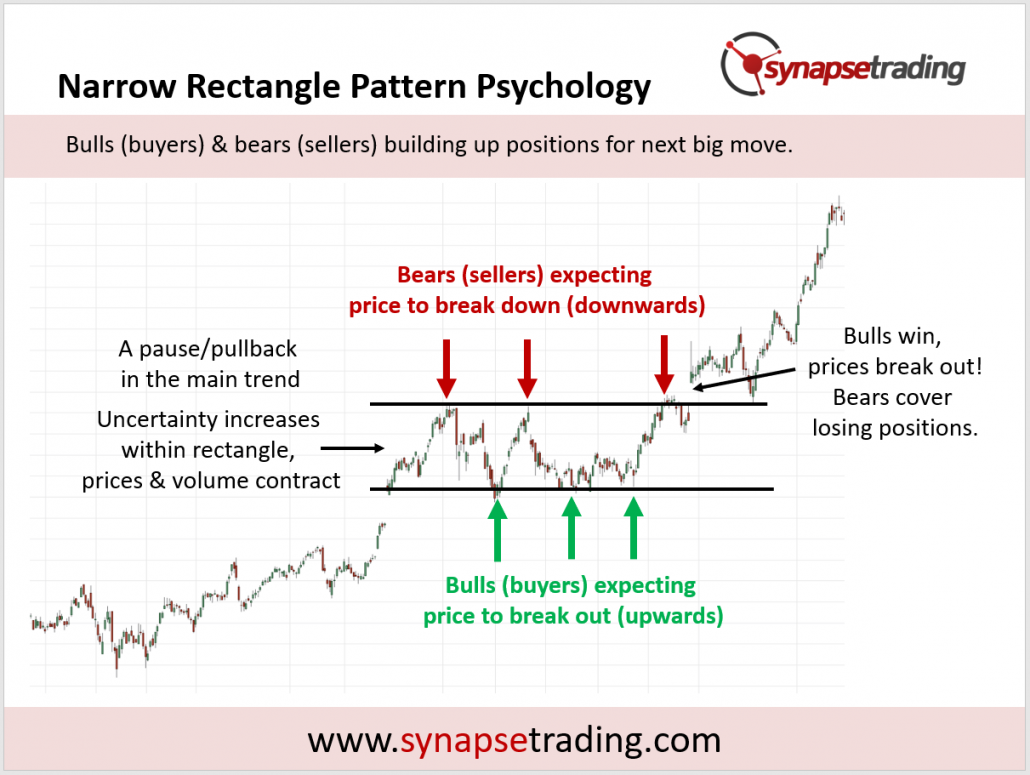
In a narrow range rectangle, the trend is taking a pause, and buyers and sellers are building up their positions for the next big move, which means that there is likely to be a strong move and another leg of the trend after breakout.
In a wide range rectangle, buyers and sellers are not sure of direction, and are just trading within the range. During this range, there are likely to be more false breakouts than real breakouts.
The main idea is to position ourselves strategically and enter the market just as a big move is likely to happen.
Rectangle Pattern Trading Strategies
There are 4 main trading strategies, 2 for the narrow range rectangle, and 2 for the wide range rectangle.
- Narrow Range: Accumulation + Breakout
- Narrow Range: Trend Pullback + Breakout
- Wide Range: Buy Low, Sell High
- Wide Range: Breakout + Pullback
Now, let’s go through each strategy in greater detail.
Trading Strategy #1: Accumulation + Breakout
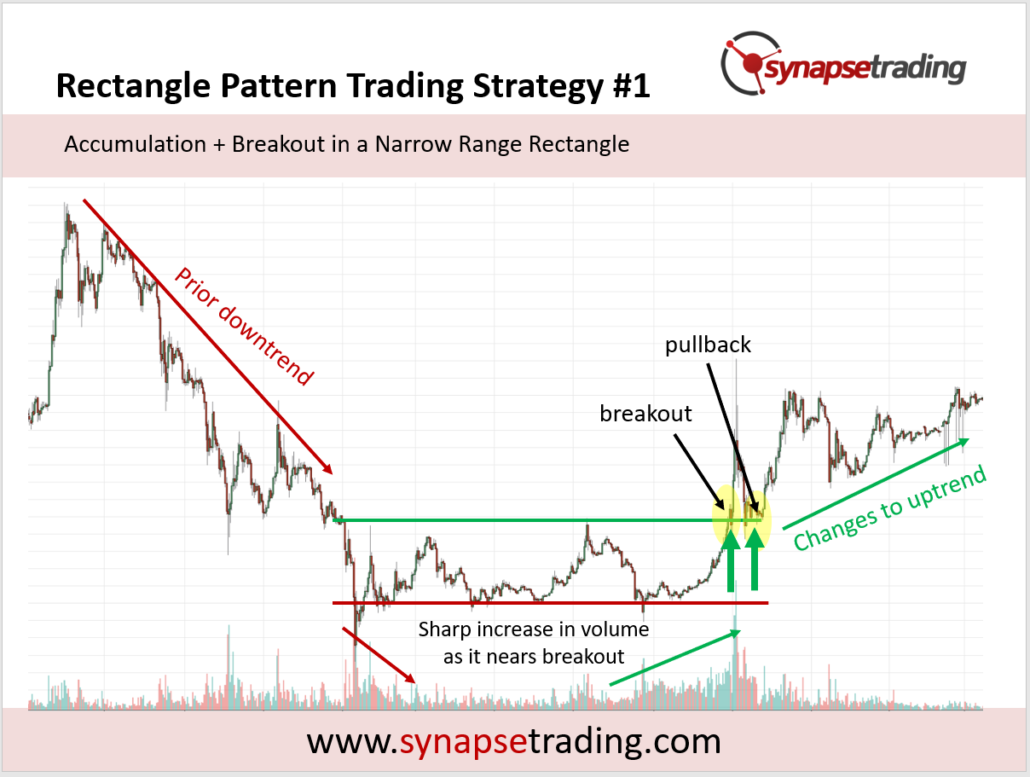
Our first strategy is used for narrow range rectangles, where we wait for an accumulation followed by a breakout of prices.
Although a narrow range typical leads to a trend continuation, it is also possible that a trend reversal takes places, especially if the range is very long (in terms of time duration).
A long range can “neutralise” the strength of the prior trend, as the longer the consolidation takes place, the more the people from the existing trend will start to doubt the strength of the trend.
In this example, we see that volume decreases as the rectangle pattern (accumulation phase) starts forming, and then sharply increases once a breakout is about to happen.
As a trader, we can look to enter when the breakout happens, or wait for the first pullback after the breakout to enter the market. This will get us onto the new trend right from the start.
Trading Strategy #2: Trend Pullback + Breakout
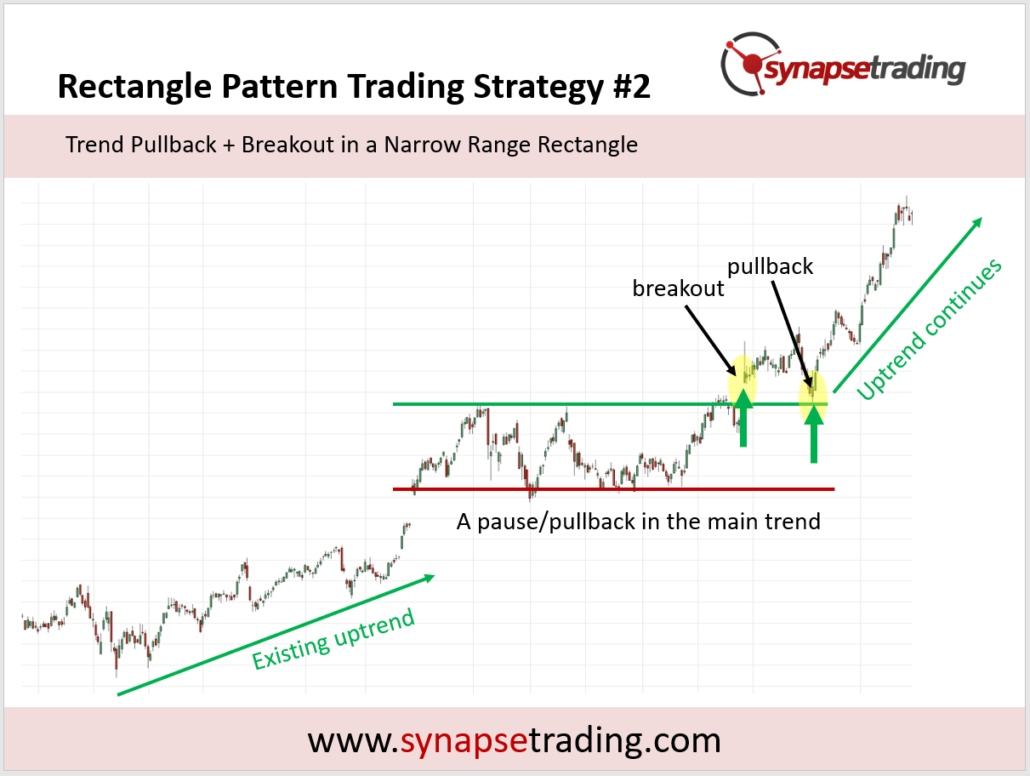
Our second trading strategy for the rectangle price pattern is to look a small rectangle which forms in the middle of a trend, and wait for an opportunity to enter when the trend resumes.
As mentioned earlier, the longer the consolidation, the less likely the trend will continue, so the faster the breakout happens, the higher the probability of a successful trade.
In this example, we can see the rectangle pattern form in the middle of an existing uptrend, and shortly after, prices break upwards to resume the uptrend.
As a trader, we can look to enter at the breakout, or the first pullback after the breakout. This will provide a low risk entry point to ride on the next leg of the trend.
Trading Strategy #3: Buy Low, Sell High
Our next rectangle price pattern trading strategy is for the wide range rectangle.
In a wide range, breakouts have a much lower success rate, and false breakouts are more common than actual breakouts, so it makes sense to buy low and sell high within the range, and sometimes that even means fading (trading against) breakouts and expecting them to fail.
For this strategy to work, the range needs to be clearly defined, and it also needs to be wide enough, so that there is enough “meat” on the trade, meaning there needs to be enough room for the trade to move from one end of the range to the opposite end.
In this example, the green and red arrows show the buying and selling opportunities on the chart, where you can take buy positions near the bottom of the range, and flip to sell positions at the top of the range.
You can also use dynamic scaling at different parts of the range, such as accumulating multiple buy positions as prices are in the lower end of the range, and as price move to the upper end of the range, start selling off the buy positions and start accumulating sell positions.
Do note that eventually, after numerous false breakouts, one of the breakouts is going to be real, so when that happens make sure you cut the position and get out fast.
Trading Strategy #4: Breakout + Pullback
Our last strategy for the rectangle price pattern is a breakout from the wide range.
As mentioned previously, successful breakouts are rare in a wide range, so to avoid any false breakouts, we should only enter breakouts from a wide range after a pullback, meaning we do not enter immediately upon the breakout itself.
In the example above, we see price breaking down from the bottom of the range, and the first clue would be how strong the breakout is, and how far it continues moving after the breakout.
For trading, we would look to enter only during the pullback, which gives us a high probability and low risk entry point.
Note that this large range eventually leads to a reversal (change of trend direction).
Profit Target for Rectangle Pattern
Once a rectangle pattern is completed, one of the most useful things about it is its ability to provide a price projection, which can be used to estimate a minimum profit target for your trade.
This can be done by taking the maximum height of the rectangle, and projecting that distance from the breakout point.
In the chart above, the maximum height of the rectangle is indicated by the blue rectangular box, which is then used as a price projection at the breakout point.
The black horizontal arrow indicates the price level which serves as the minimum profit target for the rectangle pattern breakout.
If the rectangle is small, you can even use multiple rectangle projections for multiple profit targets.
This price projection technique can be used in conjunction with other methods, such as support and resistance levels, and if there is any confluence, gives an added layer of confirmation.
Tips from the Trading Desk
- Trade with the larger trend
- The wider the range, the greater the uncertainty, and the bigger the risk
- When in doubt, wait for a pullback after breakout
- The longer the pattern takes to form, the bigger the potential move after breakout
- The wider the range, the higher the chance of a change in trend
I mentioned this near the start of the guide, that it can serve as a useful gauge of how likely a rectangle consolidation is going to lead to a trend continuation or a trend reversal.
As you can see in the diagram, when the range/consolidation is narrow, there is a higher chance of the prior trend continuing, whereas if the range is wide, there is a higher chance of a reversal occurring.
The reason for this is that in a narrow range, the buyers/sellers who are riding on the existing trend are mostly still holding onto their positions, with only a minority taking profits (and waiting to enter again), so there is not much pressure to change the trend.
In a wide range, buyers/sellers will attempt to trade within the range, so they will sell near the top and buy near the bottom, creating a more balanced bullish/bearish pressure, meaning there is an equal chance that the trend can swing either way.
If you look at continuation chart patterns like the flag and pennant, they tend to have a narrow range, whereas in reversal patterns like head and shoulders and double top/bottom, they tend to have a wide range.
Taking this into account, the best approach is to trade with the trend if the rectangle pattern is narrow, and trade both sides when the rectangle pattern is wide.
Now that I have shared the various trading strategies for the rectangle price pattern, which is your favourite strategy?
Let me know in the comments below.

If you would like to learn all the different price chart patterns, also check out: “The Definitive Guide to Trading Price Chart Patterns”
 Our flagship mentoring program is suitable for both beginners and advanced traders, covering the 4 strategies which I used over the past 15 years to build up my 7-figure personal trading portfolio.
 If you're looking for a reputable brokerage that covers all products (SG stocks, US stocks, global stocks, bonds, ETFs, REITs, forex, futures, crypto) and has one of the lowest commissions, this is what I currently use.
Spencer is an avid globetrotter who achieved financial freedom in his 20s, while trading & teaching across 70+ countries. As a former professional trader in private equity and proprietary funds, he has over 15 years of market experience, and has been featured on more than 20 occasions in the media.


Leave a Reply
Want to join the discussion?Feel free to contribute!