

Expanding Triangle Pattern: 3 Ways to Trade the Megaphone, and the One to Skip
Want the daily routine? Get the free 15-Minute Swing Trader’s Checklist. Get it free →
By Spencer Li, CFTe · Last updated: 3 October 2026
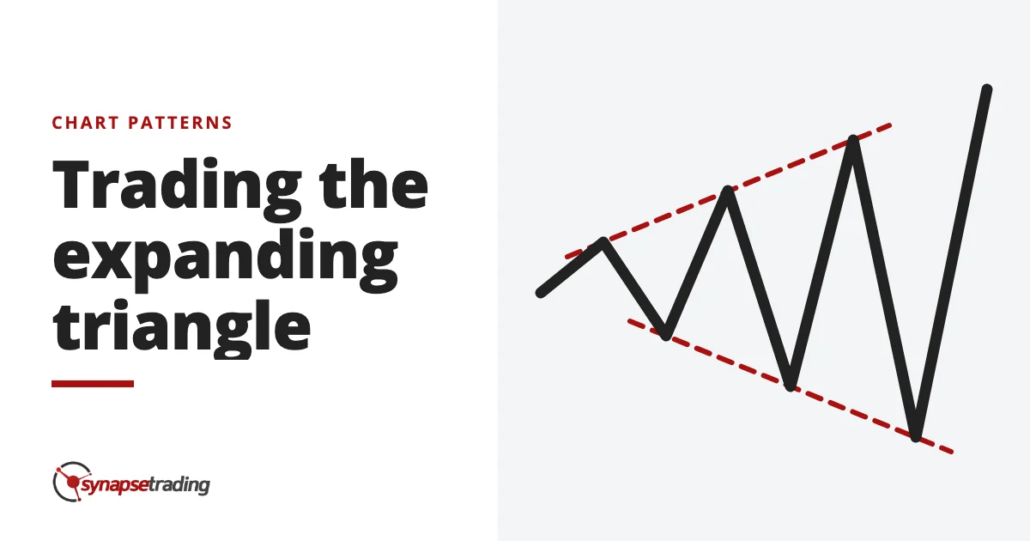
An expanding triangle is a chart pattern where price makes higher highs and lower lows at the same time, so the two lines drawn across the swings move apart instead of closing in. It is also called a broadening formation or a megaphone. It usually forms late in a trend, and most often near a top.
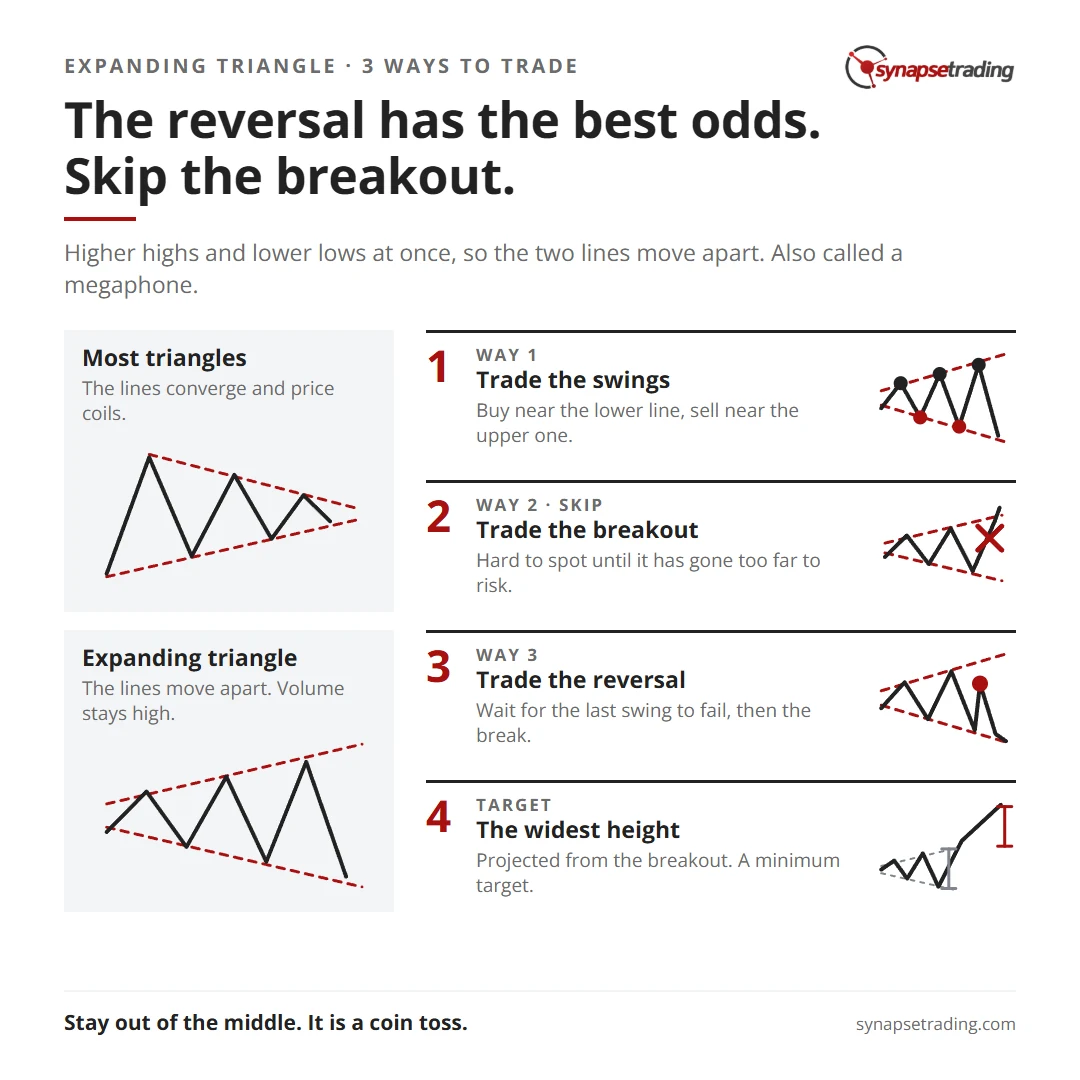
There are three ways to trade it. You can trade the swings between the two lines, trade a breakout in the direction of the old trend, or trade a reversal once the old trend fails. The reversal has the best odds, the swings only pay at the edges, and the breakout is the hardest of the three to catch.
What does an expanding triangle look like?
Most triangles squeeze. In a symmetrical, ascending or descending triangle the two lines converge, price coils into a smaller and smaller space, and sooner or later it has to break out.
The expanding triangle does the opposite. Each rally pokes a little higher than the one before, each drop goes a little lower, and the space between the two lines keeps getting bigger. So you get higher highs, which looks like an uptrend, and lower lows, which looks like a downtrend, both on the same chart.

Edwards and Magee, whose Technical Analysis of Stock Trends first came out in 1948, give two more clues. The swings are loose, and they “usually do not all stop at clearly marked boundary lines”. And volume stays high and erratic the whole way through, while a normal triangle goes quiet as it narrows.
So do not expect a tidy shape.
Why do the swings keep getting wider?
Imagine a crowd that cannot agree. Buyers push price to a new high. They look like they have won. A few days later sellers push it to a new low, and now they look like the winners. Neither side keeps its win for long, and every swing drags in more people who are afraid of missing the move, so each one travels further than the last.
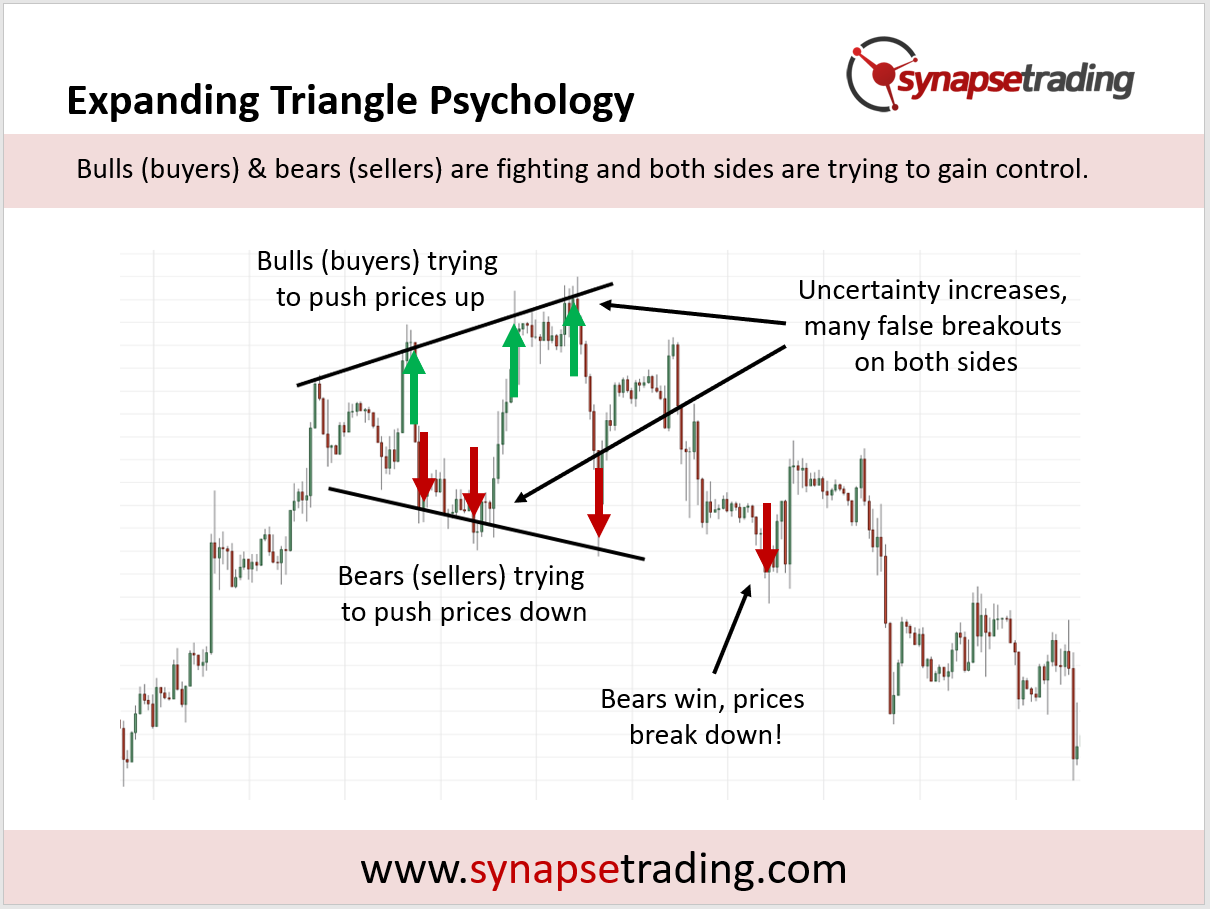
Edwards and Magee described it as the picture of a market “lacking intelligent sponsorship and that is out of control”. Then they add that the shape only suggests it.
That rising doubt is why the megaphone counts as a reversal pattern. When nobody is sure where price is going, the trend that came before it is running out of believers.
Is the expanding triangle bullish or bearish?
On 2 August 2026, a trader on Reddit’s r/technicalanalysis asked about a megaphone on the chart of a Japanese chip supplier. Edwards and Magee read it as a top, the trader said, while Schabacker saw “indecision or increasing disagreement between bulls and bears”. So which is it?
Both. And the two camps are closer than they look. Edwards built his half of that book on Richard Schabacker’s research.
The bearish case is strong. After about 20 years of studying charts, Edwards and Magee concluded that 9 times out of 10 these patterns carry bearish implications, and that they show up most often at or near an important top. In stocks that makes sense. Bottoms are usually fast and panicky, while tops take their time, and a slow, arguing top is exactly the kind of place where a megaphone has room to build.
But Schabacker’s caution survives too. A megaphone describes doubt, and doubt can resolve either way. Martin Pring, in his 2005 book on price patterns, goes further and judges the classic five-point broadening top practically extinct outside 1929. So the textbook version is rare, and the loose version you actually meet on a chart only leans bearish.
Personally, I treat a megaphone after a long rally as a reason to watch, rather than a reason to short.
For a short daily routine that fits around a full-time job, my free 15-minute swing trader checklist is the one I run myself.
What are the 3 ways to trade an expanding triangle?
Each way is a different bet on how the fight ends.
| Way | What you are betting on | Works best when |
|---|---|---|
| Trade the swings | Price keeps bouncing between the two lines | The lines are far apart and price is at an edge |
| Trade the breakout | The old trend carries on | The prior trend was strong, and the triangle is small and quick |
| Trade the reversal | The old trend is over | The prior trend was weak and late, and the triangle is large and slow |
How do you trade the swings?
Treat the two lines like the top and bottom of a range. Buy near the lower line, and sell or short near the upper line. It works much like a rectangle pattern, except that the floor and the ceiling slope away from each other.
One odd feature works in your favour. As the lines spread, the distance to the other side grows with every swing, while your risk depends only on where you enter. So the reward-to-risk ratio gets better as the pattern ages. That is how much you stand to make for each dollar you risk.
The cost is the stop.
In my weekly outlook on 23 October 2025 the market was choppy, nothing like a textbook megaphone, but it had the same problem. I said that even on trades where we were right, “the difference of one or two days of timing” got us whipsawed or stopped out. My answer then was to give the trade a wider stop, or to pinpoint the entries more precisely, and the same choice applies here.

Every megaphone breaks out eventually. So this is a trade for while the pattern lasts.
How do you trade the breakout?
Here you treat the megaphone as a pause, and bet that the trend before it resumes.
The trouble is the line you need to break. In an uptrend the upper line slopes upwards, so price needs a big move in a short time just to clear it. A slow breakout looks like price riding the edge, and you cannot tell whether anything has happened. Edwards and Magee wrote that a true breakout can be “difficult, if not impossible, to detect” when it happens, and that by the time it is obvious, the move may have gone too far to risk a trade.
If you take it anyway, the cleaner version is a break that shoots well past the line, pulls back, and builds a stable base. The base gives you a place to enter and a place to admit you were wrong.
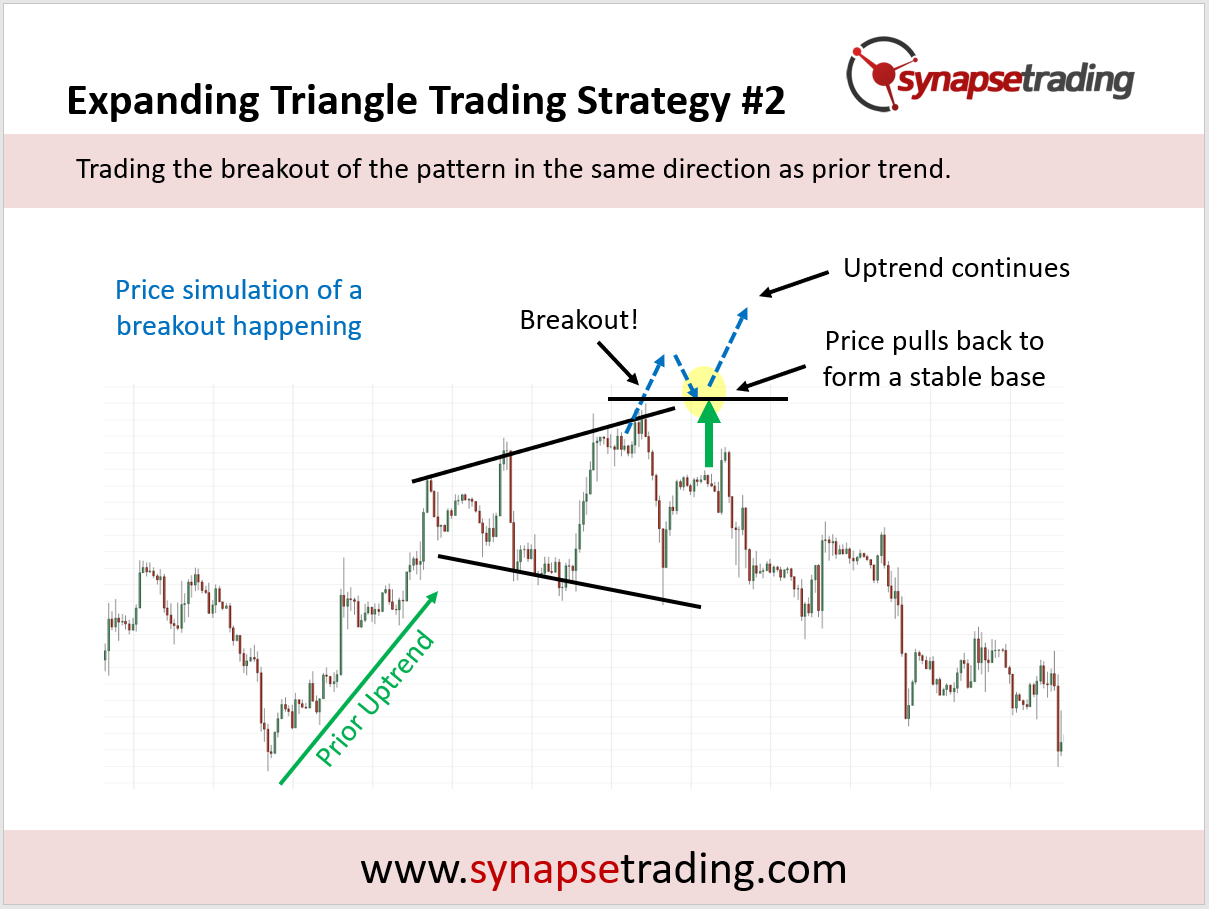
The breakout in this chart is simulated, shown by the blue dotted line, because a clean live example was hard to find.
Personally, this is the one I skip. My own breakout setup asks for a close above a flat level that has been tested at least twice, on a jump in volume. A megaphone offers a sloping line and volume that is high all the way through, so neither test has anything to measure.
How do you trade the reversal?
Now flip the bet. The trend that came before the megaphone is over, and you want to be early into the new one.
The signal Edwards and Magee watch for is a failure. Before a break to the downside, the last rally inside the pattern fails to reach a new high, which ends the run of ever-higher tops. Before a break to the upside, the last dip fails to reach a new low. They found these failures in most broadening formations, and they count one as confirmed once price goes on to clear the previous swing in the new direction by a decisive margin.
So suppose a market has run up for months, and the swings start widening. You do not short the first big drop. That is the trade fear and impatience push you into. You wait for a rally that stalls below the last high, then for price to break under the last low, and then for lower highs and lower lows to show that a downtrend has started. You can add to the position as it confirms.

Size matters here. The bigger and older the megaphone, the longer the two sides have fought, and the more likely it is that the old trend has already lost.
Personally, this is the one I find worth the wait. My rule for reversals is to never act on a structure that has not confirmed, and the failure is the confirmation. Patient trades like this are what the free 15-minute swing trader checklist is built around.
How do you set a profit target on an expanding triangle?
Measure the megaphone at its widest point, from the upper line to the lower one. Then project that distance from the breakout point, in the direction of the break. That gives you a minimum target.
Say the widest part runs from 100 down to 80, using made-up numbers. That is a height of 20. If price breaks down through the lower line at 85, the minimum target is 85 minus 20, which is 65.

Treat that number as a floor rather than a promise, and check it against support and resistance. When the projection lands on a level that already mattered, the two confirm each other.
Why should you stay out of the middle of the pattern?
The middle is a coin toss. Price can look like it is breaking out, then make a full U-turn a few bars later, and anyone who chased it gets whipsawed.
In my outlook on 12 February 2026, the market had gone sideways for about a month and a half and sat “right in the middle of the range”. I said that as long as it stayed there, it would be more challenging to trade, because with no clear trend you cannot be aggressive. A megaphone makes that worse, since its swings are bigger than a normal range.

So wait for price to reach an edge, or for the failure that signals the turn. Sitting out feels like missing something. Often the relief comes a few days later, when the move you skipped turns around on the people who took it.
FAQ
What is an expanding triangle pattern?
It is a chart pattern where price makes higher highs and lower lows at the same time, so the two trendlines move apart.
Is an expanding triangle bullish or bearish?
It leans bearish. Edwards and Magee found it carried bearish implications 9 times out of 10 and appeared most often near tops, though a megaphone describes doubt, and doubt can resolve either way.
Is the expanding triangle a reversal or a continuation pattern?
It is usually classed as a reversal pattern, because widening swings show growing doubt about the trend before it.
How do you trade an expanding triangle?
Trade the swings near the edges, trade a breakout with the prior trend, or trade the reversal once the old trend fails. The reversal has the best odds.
Have you ever sold a megaphone too early, or bought what looked like a breakout and watched it turn? Which of the three ways do you trade? Let me know in the comments.
If you want every pattern covered in detail, read my Guide to Trading Price Chart Patterns. The triangle patterns that converge, the rectangle pattern, the head and shoulders and the guide to continuation vs reversal patterns each have a page of their own. The rest of my free trading guides are collected in one place.

If you would like to learn all the different price chart patterns, also check out: “The Definitive Guide to Trading Price Chart Patterns”
And if you want a daily routine that does not need hours at the screen, grab the free 15-minute swing trader checklist.
About the author. Spencer Li is The 15-Minute Trader and the founder of Synapse Trading. He is a Certified Financial Technician (CFTe) with 15+ years of trading, run from 70+ countries. He holds a B.Acc and B.BM from SMU. Every trade he takes is public, dated, losses left in. He teaches rules-based swing trading in 15 minutes a day, one system for any market.
Education, not financial advice. Synapse Trading is not licensed by MAS to advise on investment products. Trading carries risk of loss, and past performance is not indicative of future results.
Want the daily routine? Enter your email for the free 15-Minute Swing Trader's Checklist.
Free 5-page PDF, then occasional trading emails. Education only, not financial advice. Unsubscribe anytime. Kit stores your email in the US: see our privacy policy.
Want to learn the full method? The Trading Mastery Program teaches the 4 strategies I have traded since 2011. It suits beginners and experienced traders.
Rather follow the trades as they happen? Daily Trading Signals is our Telegram channel: my trade ideas with entry, stop and exit, and every trade is public.
Questions about this post? Ask in the free Telegram channel →
Educational content only, not personalised financial advice. Trading carries risk, including loss of capital. Past performance is not indicative of future results. Synapse Trading is not licensed or regulated by MAS.


I think the first strategy, where you trade the swings is cool
Thank you so much for this article! I find the way you explain the graph is very easy to understand, as well as laying all possibilities of trading strategies gives me a clear picture and builds a solid understanding.
I find strategy #3 the easiest and the lowest risk which I think I would start from here.
I think strategy #1 is also interesting, but as you said, we need to manage our trading position well as it will eventually lead to a breakout. So I think strategy #1 might be a bit more challenging for a beginner like myself.
What do you think?