

Trading Price Patterns with the Trend: How to Read a Pattern in Context
Want the daily routine? Get the free 15-Minute Swing Trader’s Checklist. Get it free →
By Spencer Li, CFTe · Last updated: 26 October 2026
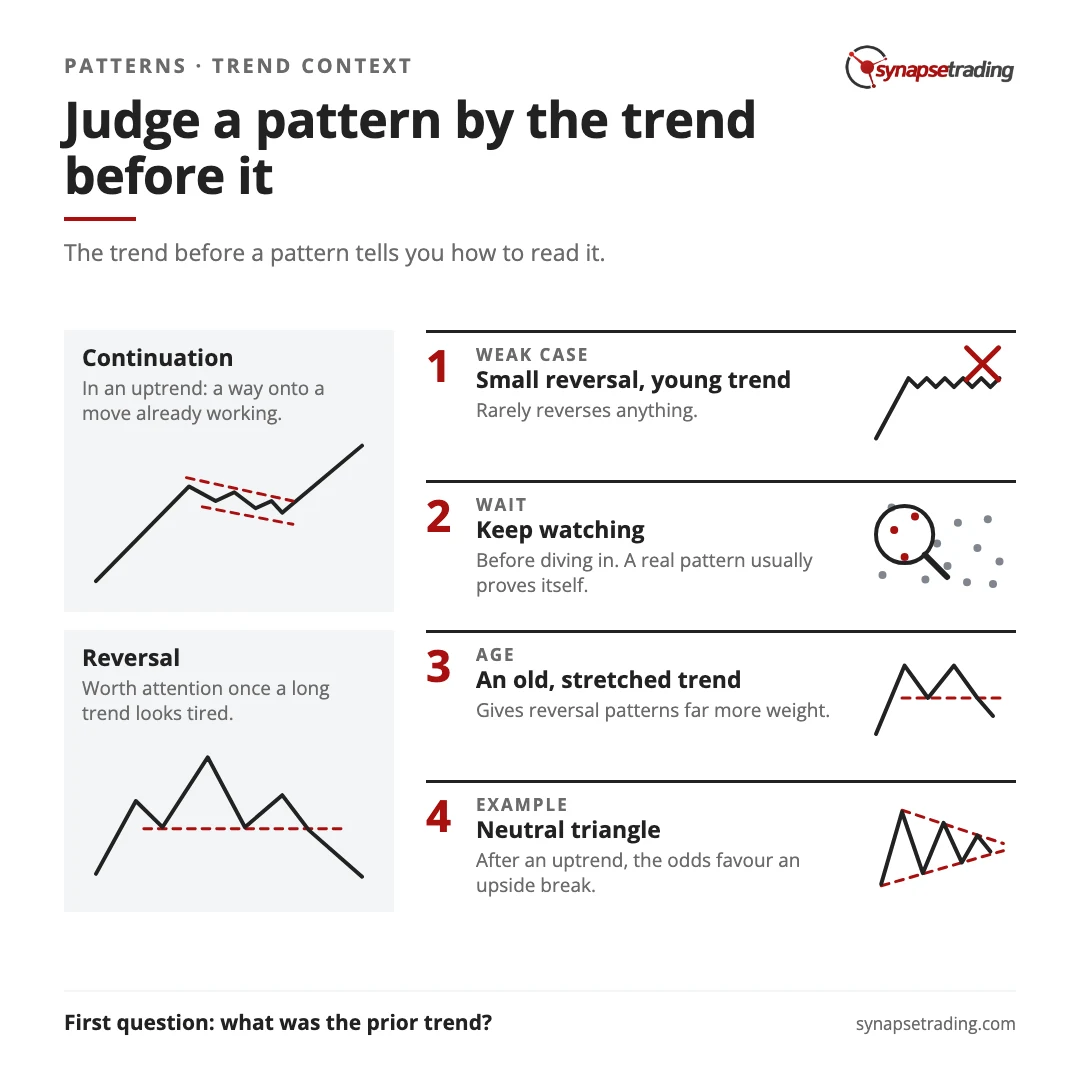
The trend before a price pattern tells you how to read the pattern. In an uptrend, you want to be looking for continuation patterns, which give you a way onto a move that is already working. When a trend has run for a long time and looks tired, reversal patterns start to deserve your attention. A small reversal pattern inside a strong, young trend rarely reverses anything, so it is usually better to keep watching, or even to wait for that pattern to fail. And a triangle, which every textbook calls neutral, stops being neutral once you know which way price was heading before it formed.
Why does the same pattern mean different things?
The trader and author Al Brooks has a line that sounds like a typo the first time you read it. “There is really no such thing as a trend reversal pattern,” he writes. “When there is a trend, all patterns are continuation patterns, but occasionally one will fail.”
He is exaggerating on purpose. The point underneath is a good one. A pattern on its own is a snapshot of a fight between buyers and sellers, and the snapshot cannot tell you who has been winning. The trend can. So a double top that forms after six months of steady buying is a very different animal from the same double top after three weeks of drifting sideways, even though the two might look identical on your screen.
Martin Pring puts the same idea in plainer words. A reversal pattern must have something to reverse. A top needs an uptrend in front of it, and a bottom needs a downtrend, otherwise there is nothing for the pattern to end.
So before asking what a pattern is called, it is worth asking what the market was doing before it showed up. Hence this is the first thing I look at, and the name of the pattern usually comes a distant second.
Is a triangle really neutral?
Ask most pattern guides which way a symmetrical triangle breaks, and the honest ones will tell you they have no idea.
Robert Edwards and John Magee, who catalogued the classic patterns in their 1948 book, said there is “seldom any clue” on the chart of the triangle itself. Price swings in a narrowing range, the buyers and sellers keep meeting closer to the middle, and nobody can say who blinks first. But the same authors then made a quiet observation about the triangles that form inside an uptrend. “Three out of four of these formations will turn out to be just that,” they wrote, meaning a pause before the trend carries on. “The fourth is the dangerous one (if you own the stock).”
That is dry humour from 1948. It still holds up. Pring’s advice is the practical version. Since the triangle gives you no clue, assume it will break in the direction of the trend that came before it.
Look at the chart below. The pattern is technically neutral, and it could have broken either way, but the odds favoured an upside breakout because of the uptrend that came first.
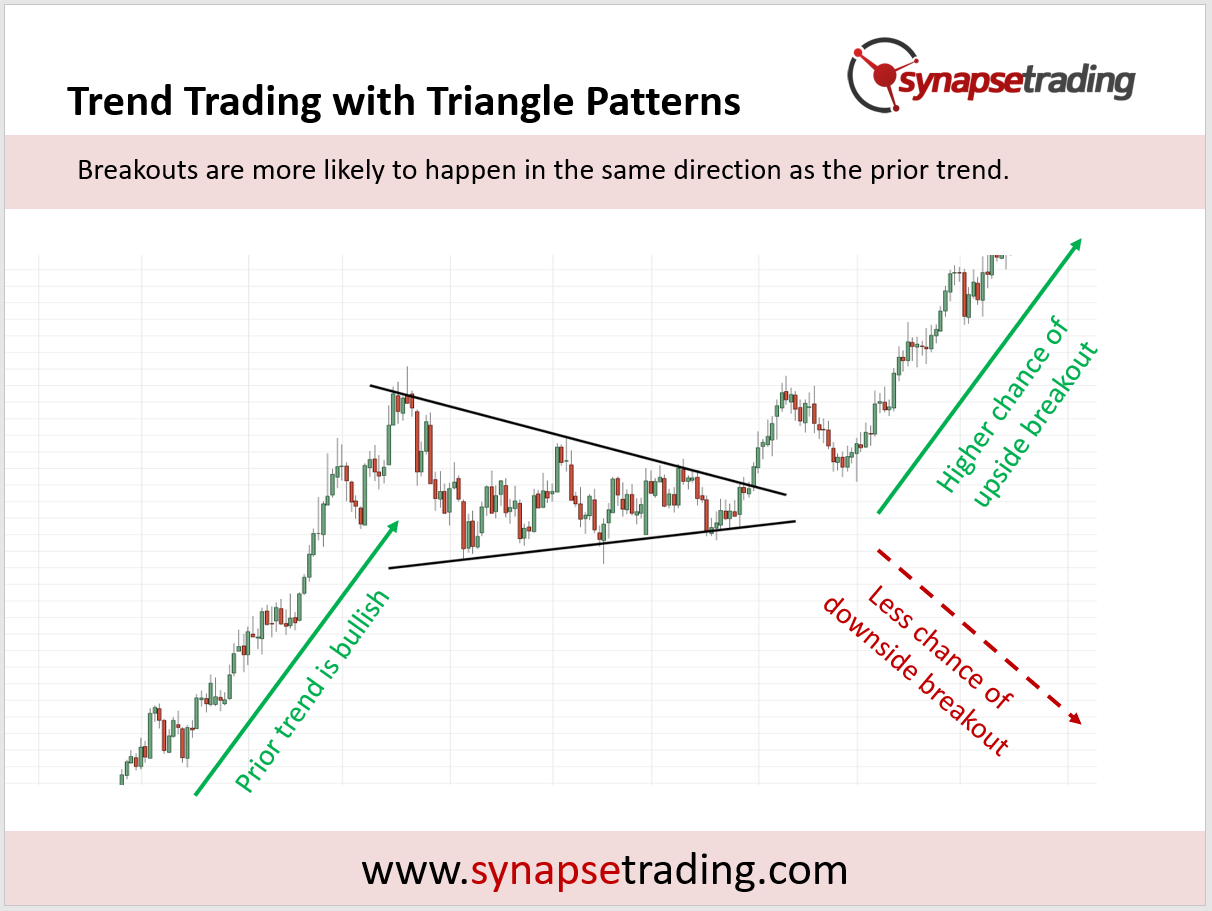
In my weekly outlook on 27 November 2025, I pointed out that gold “has just broken out of this symmetrical triangle pattern”. I said that if it was able to stay above the breakout, there was “a good chance that it will test new highs”. I did not know whether it would. Nobody does at the time.
Here is what the data says happened next, so you can check the read against the record. COMEX gold futures had set a record close on 20 October 2025. They first closed above it on 17 December 2025, and went on to a fresh record close on 29 January 2026. That is one example, and one example proves very little, but it shows what “with the trend” looks like in practice.
Reading the trend before the pattern is a daily habit more than a skill, and my free 15-minute swing trader checklist is the short routine I run each day to keep it.
Why does a small reversal pattern rarely stop a strong trend?
Newton’s first law says an object in motion stays in motion unless a force acts on it, and a heavy object needs a bigger force to change course. Al Brooks reaches for a similar picture when he says a trend is like a huge ship. You cannot turn a container ship with a rowing oar.
Markets are not physics. Still, the analogy helps with one common mistake. Picture a strong uptrend that is still quite young. Then a small reversal pattern appears, perhaps a little double top that is tiny next to the size of the rise. It is tempting to call the top, especially if you missed the move and feel the regret of watching it run without you. But the odds of a small pattern reversing a big, young trend are slim. The trend is the heavyweight here, and the pattern is a featherweight.
Pring goes further. He notes that trends nest inside each other, with short swings inside longer ones, and the longer trend governs the size of the shorter moves. In his account, trading losses tend to come from being positioned against the bigger trend. And in his chapter on false breakouts, a break against the trend heads the list.
So what do you do with a weak reversal pattern in a strong trend? Personally, I do one of two things. I keep watching before diving in, because a pattern that is real will usually prove itself. Or I wait for the reversal pattern to fail, and treat the failure as a chance to join the trend instead of fighting it. The reasoning is simple once you think about who is in the trade. Everyone who bet on the top is now trapped on the wrong side, and their exit adds fuel to the move they were betting against.
When does a reversal pattern start to matter?
If young trends swallow reversal patterns, the obvious question is when that stops being true.
Edwards and Magee gave the answer in their notes on triangles. Triangles that form inside a trend usually break with it, they said. Those odds “are greatest … in the early stages of either a Primary Bull or Bear Market, with the chances of Reversal increasing as those Major Trends mature.” So the same pattern carries more weight the older the trend gets. A small double top in the second month of a rally is noise. The same double top after two years of buying, with every pullback getting shallower and every push higher looking a bit more desperate, deserves a much closer look.
There is a twist here that I find quite interesting. Edwards and Magee noticed that failed head and shoulders tops “almost never occur in the early stages of a Primary Advance”. When one does fail, they read it as “a warning that even though there is still some life in the situation, a genuine turn is near.”
Do note what that means for the failure trade above. Early in a trend, a failed reversal pattern is often a gift. Late in a trend, the same failure can be the market’s last push before the real turn. The pattern is the same in both cases, and the age of the trend decides which story it is telling.
There is also some hard evidence that pro-trend patterns behave better. In a study of 5,235 patterns reported in Pring’s book, about 70% of bullish bottoms in bull markets reached their price objective, against about 55% of bullish breaks in bear markets. I go through that study in what are price patterns.
Doesn’t trading with the trend make you late?
On 12 October 2026, a trader on Reddit’s r/Daytrading asked: “What if the trend you’re following is the reason you miss the real move?”
It is a fair challenge. Their post argued that higher highs and higher lows describe what price has been doing, and say much less about what it does next. Some of the biggest moves start after months of price going the other way.
My answer is that the trend is a statement about odds. It cannot see the future. Most of the time, a trend that is in motion stays in motion, and a reader who sides with it is right more often than one who keeps calling the top. That is a probability, and it comes with a price.
The price is that you will always be late at the turn. Here is a concession with a date on it. On 30 January 2026, the day after that record close, COMEX gold futures closed about 10.8% lower in a single session. A trader reading the trend that afternoon was still reading an uptrend, because the trend only changes after price has already moved. Nothing in the approach warns you of a day like that in advance. What it does is keep you from shorting every small top on the way up, which in a long rise is how most of the damage is done.
So I accept being late at both ends of a move. I would rather miss the first part of a new trend than fight an old one that still has life in it.
If you would rather check the trend once a day than watch every top form, the free 15-minute swing trader checklist is the routine I use myself.
What should you ask before reading any pattern?
Here is the whole idea reduced to three questions. I find it useful to run any pattern through them before deciding what it means.
- What was the prior trend? Up, down or sideways. This sets your bias before anything else, and a reversal pattern with no trend behind it has nothing to reverse.
- How old and how strong is that trend? A young, strong trend favours continuation, and it also favours reversal patterns failing. An old, stretched trend gives reversal patterns far more weight.
- How big is the pattern next to the trend? A pattern that is tiny next to the move it is supposed to end is the weak case. Measure it against the trend, never in isolation.
Answer those three, and most patterns read themselves. For the patterns that pause a trend and the ones that end it, see my guide to continuation and reversal patterns, and for the most common pause of all, the triangle pattern.

If you would like to learn all the different price chart patterns, also check out: “The Definitive Guide to Trading Price Chart Patterns”
FAQ
Should I trade a pattern with the trend or against it?
By default, with the prior trend, especially when that trend is strong and still young. A pattern against the trend deserves weight only when the trend is old and stretched, and the pattern is large next to the move it is trying to end.
Is a triangle bullish or bearish?
On its own, a symmetrical triangle is neutral, and Edwards and Magee said its chart gives “seldom any clue”. In context, assume it breaks in the direction of the trend before it. After an uptrend, the odds favour an upside break.
What is the difference between a continuation and a reversal pattern?
A continuation pattern is a pause inside a trend before it carries on in the same direction. A reversal pattern marks the trend ending and turning. Which one to look for depends on whether the trend looks healthy or tired.
Why do reversal patterns fail in strong trends?
A small pattern rarely outweighs a large, young trend. The trend has more buyers or sellers behind it than the pattern does, so weak counter-signals get absorbed, and the traders who bet on the turn are often forced out.
How do I know when a trend is getting old?
There is no exact bar count. Look at how far and how long the trend has already run, and at whether reversal patterns are getting bigger and more frequent. Edwards and Magee noted that the chance of a reversal rises as a major trend matures.
Does a failed reversal pattern always mean the trend will continue?
No. Early in a trend, it often does. Late in a trend, Edwards and Magee read a failed head and shoulders top as a warning that a genuine turn is near.
Do you usually look at the trend first, or the pattern first? Have you ever shorted a “top” in a young trend and watched it keep running? Let me know in the comments.
To see one of the big reversal patterns up close, read the head and shoulders pattern, or start with my free trading guides.
And if you want a routine that checks the trend before the shape, without hours at the screen, grab the free 15-minute swing trader checklist.
About the author. Spencer Li is The 15-Minute Trader and the founder of Synapse Trading. He is a Certified Financial Technician (CFTe) with 15+ years of trading, run from 70+ countries. He holds a B.Acc and B.BM from SMU. Every trade he takes is public, dated, losses left in. He teaches rules-based swing trading in 15 minutes a day, one system for any market.
Education, not financial advice. Synapse Trading is not licensed by MAS to advise on investment products. Trading carries risk of loss, and past performance is not indicative of future results.
Want the daily routine? Enter your email for the free 15-Minute Swing Trader's Checklist.
Free 5-page PDF, then occasional trading emails. Education only, not financial advice. Unsubscribe anytime. Kit stores your email in the US: see our privacy policy.
Want to learn the full method? The Trading Mastery Program teaches the 4 strategies I have traded since 2011. It suits beginners and experienced traders.
Rather follow the trades as they happen? Daily Trading Signals is our Telegram channel: my trade ideas with entry, stop and exit, and every trade is public.
Questions about this post? Ask in the free Telegram channel →
Educational content only, not personalised financial advice. Trading carries risk, including loss of capital. Past performance is not indicative of future results. Synapse Trading is not licensed or regulated by MAS.

