

What Are Price Patterns? How Chart Patterns Form and What They Tell You
Want the daily routine? Get the free 15-Minute Swing Trader’s Checklist. Get it free →
By Spencer Li, CFTe · Last updated: 26 October 2026
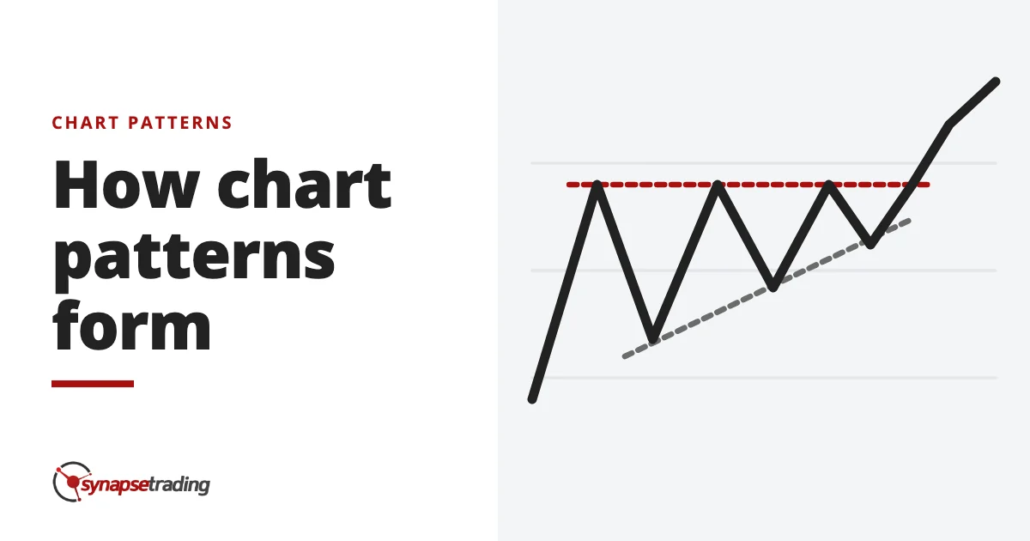
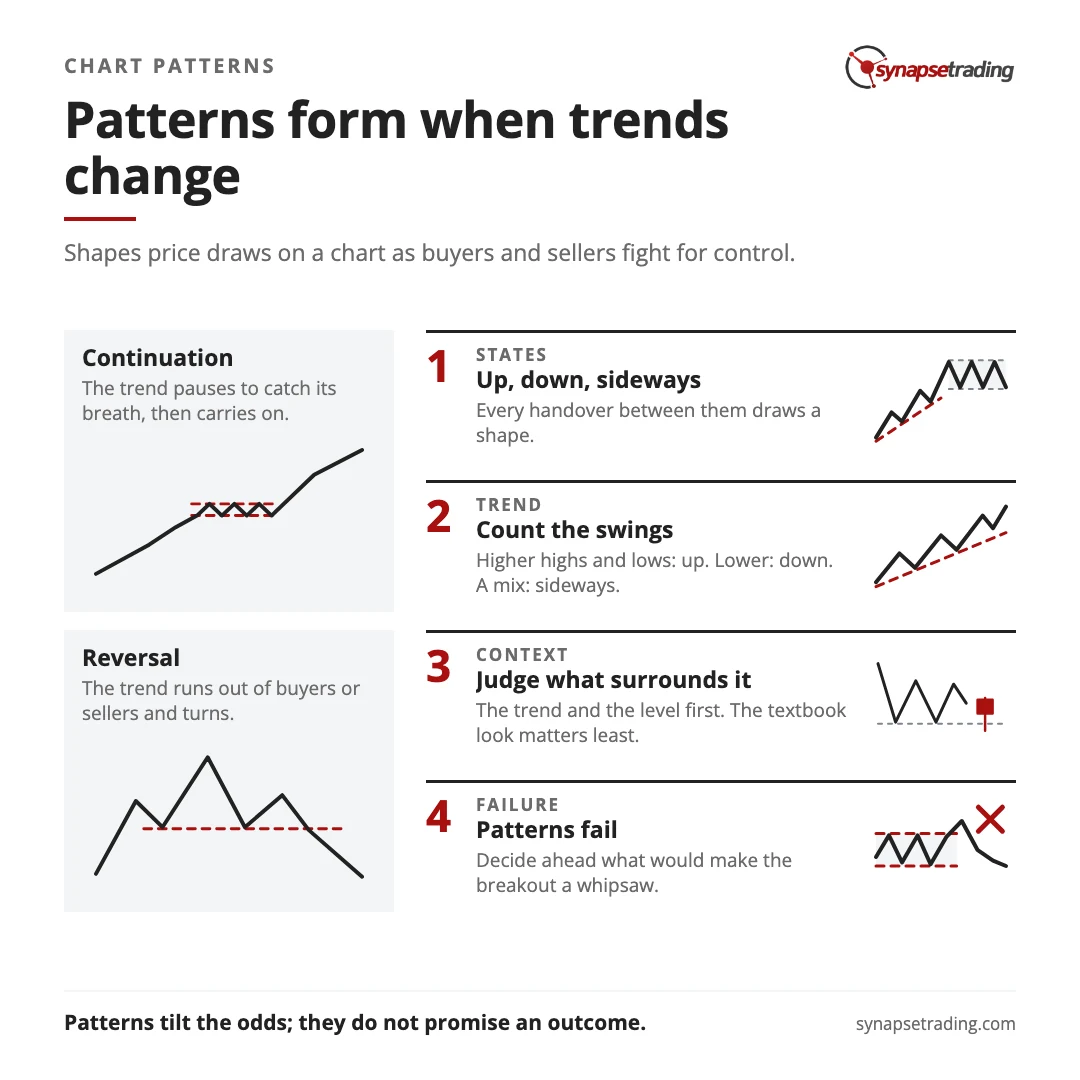
Price patterns, also called chart patterns, are the shapes that price draws on a chart as buyers and sellers fight for control. They form when a market changes state. An uptrend, a downtrend or a sideways range turns into one of the other two, and because price rarely turns on a dime, the slow handover leaves a mark. Almost every pattern belongs to one of two families. A continuation pattern is a pause before the trend carries on, and a reversal pattern is the turn into a new trend. Neither family predicts the future. What a pattern gives you is a read on which side is winning, which is a more modest promise than most pattern guides make, and a more useful one.
Why does price draw shapes at all?
The market writer Garfield Drew once put it this way: “Stocks don’t sell for what they are worth, but for what people think they are worth.”
Martin Pring quotes that line in his book on price patterns, and most of the book follows from it. If price is set by what people think, then price moves when what people think changes, and people rarely change their minds all at once, which is why a change of trend usually takes weeks. A market that has risen for months does not flip into a downtrend overnight, because its buyers do not all lose faith on the same afternoon. Some take profits early, some hold on, and some new buyers arrive late. For a while the two sides are roughly matched, and price goes nowhere in particular.
That stretch of going nowhere is the pattern. Pring calls it a transitional trading range.
There are only three states a market can be in, which keeps the subject smaller than it looks.
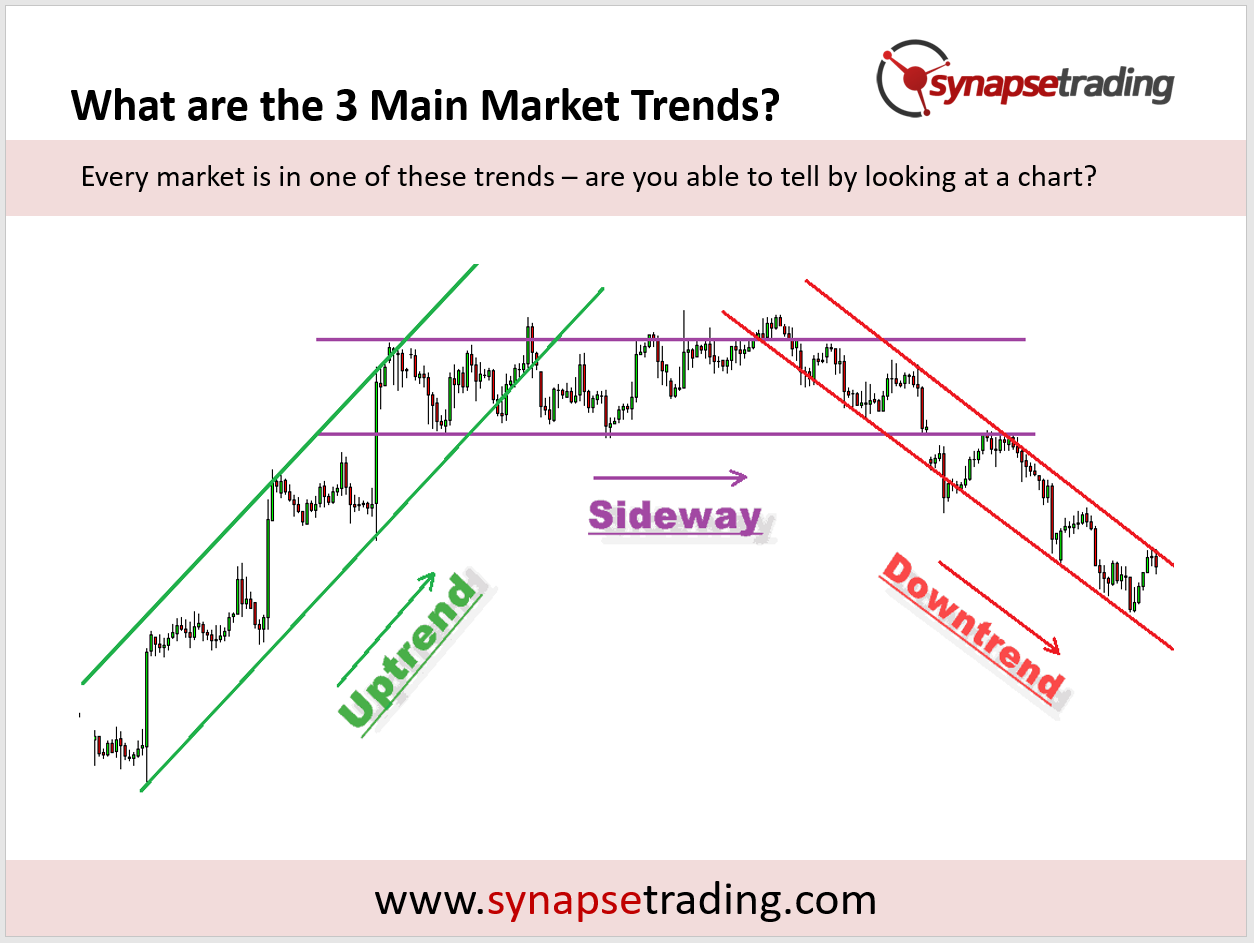
Every handover from one state to another passes through some kind of range, so every change of trend draws a shape. Traders have been naming those shapes for a long time. The classic names mostly come from Technical Analysis of Stock Trends, first published in 1948 by Robert Edwards and John Magee. They built on the work of Richard Schabacker, a former financial editor at Forbes. Seventy-eight years later, a head and shoulders is still called a head and shoulders.
Who is actually fighting inside a pattern?
If you have ever haggled at a night market on holiday, you have already watched a price pattern form.
The stall owner asks for 500 and you offer 200. She comes down to 400, you go up to 250, and with every round the gap gets smaller. Then one of two things happens. Either somebody gives in and the deal is struck, or you walk off and the price goes somewhere else entirely. On a chart, that narrowing back and forth is a triangle. The moment someone gives in is the breakout.
Markets work the same way, with a lot more people at the stall. Pring makes a point that sounds obvious and is easy to forget, which is that every trade has a buyer and a seller. So price never moves because there were more buyers than sellers. It moves because one side was keener, and was willing to pay up or sell down to get the trade done.
That is also why the same range can mean two very different things. At the top of a long rise, a range is often distribution, where shares pass from the people who bought early to the people who arrived late and excited. At the bottom of a long fall, it is often accumulation, where shares go from tired sellers to patient buyers. The two shapes can look almost identical. Who is buying from whom is what tells them apart.
What are the two families of price patterns?
Here is an odd fact about the most famous pattern of all. Edwards and Magee, the men who catalogued it, wrote that “True Double Tops and Double Bottoms are exceedingly rare.” Triple tops, they added, are rarer still, and a real double top can seldom be confirmed until price has gone a long way from it.
So the pattern traders name most often is, by the account of the book that named it, one of the hardest to call while it forms. Keep that in mind as we go through the two families.
| Family | What it tells you | What price tends to do next | Common examples |
|---|---|---|---|
| Continuation | The trend has paused to catch its breath | Carry on in the same direction | Flags, pennants, rectangles, triangles |
| Reversal | The trend is running out of buyers or sellers | Turn and start a new trend | Head and shoulders, double tops and bottoms, broadening tops |
Do note that one shape can belong to either family, depending on where it turns up. A rectangle halfway up a healthy trend is usually a pause. The same rectangle after a long, tired run can be the top.
Edwards and Magee and Pring both state a rule that sounds almost too simple to write down. A reversal pattern must have something to reverse. A head and shoulders after three weeks of sideways chop has no uptrend behind it, so there is nothing for it to end. I go through how each family behaves in continuation and reversal patterns.
Reading the family before the shape is a daily habit, and my free 15-minute swing trader checklist is the short routine I run each day to keep it.

If you would like to learn all the different price chart patterns, also check out: “The Definitive Guide to Trading Price Chart Patterns”
Why does the trend around a pattern matter so much?
Does a pattern behave the same way in a bull market as in a bear market? Somebody actually counted.
In a study reported in Pring’s book, a firm called Recognia had a computer find 5,235 head and shoulders, double top and double bottom patterns in stocks from 1982 to 2003. The average pattern took about 49 trading days to form. Then they checked how often each one reached the price objective the textbooks give it.
The two numbers worth putting side by side are these.
About 70% of bullish bottoms that formed in bull markets reached their objective. For bullish breaks in bear markets, it was about 55%.
So the same shape did noticeably better when it agreed with the bigger trend. Fifteen points is a big gap. Read the other side of those numbers too. Roughly 3 in 10 of the good ones still missed. And the test allowed unlimited losses along the way, so plenty of winners first fell far enough to shake out anyone nervous. Pring’s summary is that false signals almost always develop against the trend above them.
That is why the first question about any pattern is what the trend is doing. The simplest way to answer it is to count the swings. Higher highs and higher lows mean an uptrend, lower highs and lower lows mean a downtrend, and a mix means sideways.

In my weekly outlook on 27 November 2025, I said the market still trended up overall. But to get the best results, I said, we wanted the stocks with “the strongest price patterns”, and I was being “very selective” about them.
Can you trust your eyes on a chart?
This is where the subject gets humbling, and it has more to do with psychology than with markets.
A researcher named Harry Roberts showed that head and shoulders tops, triple tops and trend channels turn up all the time in fake price charts, made by adding up coin flips. Later, a researcher named Arditti showed expert chartists a mix of real and simulated charts. They did no better than guessing. The trading author David Aronson ran the same test on his own graduate students, straight after his technical analysis course. Same result.
Aronson is careful about what this proves. It does not prove that markets are random. It proves that the eye alone cannot tell a real structure from a fake one, and he compares it to a jeweller who cannot tell a diamond from glass. That jeweller has no business valuing diamonds, however confident he feels.
Our brains are built to find shapes, which is useful when the shape is a tiger in the long grass and much less useful when it is a flag on a five-minute chart, where the tiger is usually imaginary. So the defence is to judge a pattern by what surrounds it: the trend, the level it formed at, and how the buyers and sellers inside it behaved. How textbook it looks matters least.
In the course I teach, I tell students they do not really have to memorise the patterns. What matters more is understanding why a pattern forms. Then, when a messy one turns up looking nothing like the picture in the book, they can still read it.
What happens when a pattern fails?
On 25 September 2026, a trader on Reddit’s r/Daytrading posted a chart of SPY, the S&P 500 fund. A bull flag had broken down, and a bearish pennant had shot straight up. Their question was a fair one: “Is it simply because patterns don’t always work how they’re supposed to.”
The short answer is yes, and I can show you with my own calls.
In my weekly outlook on 27 November 2025, I told viewers that USD/SGD had formed “this nice accumulation pattern”, and that I had expected it to break to new highs. Instead it formed “a small double top” and fell back below its trend line. So I reduced my long exposure and waited to see whether the last support level would hold. In the same video, I pointed out a “mini head and shoulders” on the stock market chart. That reversal pattern had failed, and price was back above all its moving averages.
So in one recording, one of my patterns failed against me and another failed in my favour.
Now, a failed pattern still carries information. Pring noticed that when a right-angled triangle breaks the “wrong” way, against the expected direction, the move that follows is often sharp. Part of the reason is that everyone who traded the textbook direction now has to get out. A bearish pattern that fails inside an uptrend is often the uptrend telling you it is stronger than it looked. Hence his advice to “decide ahead of time what type of price action would cause you to conclude that the breakout was a whipsaw.” That way a failure is something you planned for, rather than a surprise you explain away afterwards.
If you would rather check all this once a day than watch every flag form, the free 15-minute swing trader checklist is the routine I use myself.
FAQ
Is a price pattern the same thing as a chart pattern?
Yes. They are two names for one thing, a shape that price draws on a chart as buyers and sellers fight for control.
What are the two main types of chart patterns?
Continuation patterns, where the trend pauses and then carries on, and reversal patterns, where the trend ends and turns. Flags, pennants and rectangles are usually continuations. Head and shoulders and double tops are reversals.
Do chart patterns actually work?
They tilt the odds rather than promise an outcome. In a 1982 to 2003 study of 5,235 patterns, about 70% of bullish bottoms in bull markets reached their objective, against about 55% in bear markets. Roughly 3 in 10 of the better group still missed.
Which timeframe are price patterns most reliable on?
Pring found that patterns on longer timeframes are more reliable, because they carry less random noise. A pattern on a weekly chart usually means more than the same shape on a five-minute chart.
Do I need to memorise every chart pattern?
No. It helps far more to understand why patterns form, the shift from buyer control to seller control or back, because a real pattern rarely looks like the textbook picture.
How are chart patterns different from candlestick patterns?
A candlestick pattern is one to three candles, often a single day’s fight. A chart pattern takes many candles, and the patterns in the Recognia study averaged about ten weeks. I explain the first kind in what are candlestick patterns.
Have you ever traded a pattern that failed, and did the failure tell you more than the pattern would have? Which family do you find easier to read, the pauses or the turns? Let me know in the comments.
To go deeper on two of the reversal patterns, start with the double top and double bottom and the head and shoulders. For the wider picture, start with my free trading guides.
And if you want a routine that reads the trend before the shape, without hours at the screen, grab the free 15-minute swing trader checklist.
About the author. Spencer Li is The 15-Minute Trader and the founder of Synapse Trading. He is a Certified Financial Technician (CFTe) with 15+ years of trading, run from 70+ countries. He holds a B.Acc and B.BM from SMU. Every trade he takes is public, dated, losses left in. He teaches rules-based swing trading in 15 minutes a day, one system for any market.
Education, not financial advice. Synapse Trading is not licensed by MAS to advise on investment products. Trading carries risk of loss, and past performance is not indicative of future results.
Want the daily routine? Enter your email for the free 15-Minute Swing Trader's Checklist.
Free 5-page PDF, then occasional trading emails. Education only, not financial advice. Unsubscribe anytime. Kit stores your email in the US: see our privacy policy.
Want to learn the full method? The Trading Mastery Program teaches the 4 strategies I have traded since 2011. It suits beginners and experienced traders.
Rather follow the trades as they happen? Daily Trading Signals is our Telegram channel: my trade ideas with entry, stop and exit, and every trade is public.
Questions about this post? Ask in the free Telegram channel →
Educational content only, not personalised financial advice. Trading carries risk, including loss of capital. Past performance is not indicative of future results. Synapse Trading is not licensed or regulated by MAS.

