• Link to Facebook
  • Link to X
  • Link to Instagram
  • Link to Youtube
  • Link to LinkedIn
  • Link to Mail
Synapse Trading
  • Home
  • About
    • My Background
    • My Trading Journey
    • My Travel Log
    • Media & Interviews
  • Mentoring
    • Trading Mastery Program
    • Results & Testimonials
  • Signals
    • Daily Trading Signals
    • Daily Trading Signals (Results)
  • Telegram (Free to join!)
  • Resources
    • Free Trading Guides
    • Tools & Resources
    • Blog & Infographics
  • Contact
    • Contact Us
    • Partnership Opportunities
  • Click to open the search input field Click to open the search input field Search
  • Menu Menu
The Synapse Network

How to Profit from Interest Rate Cuts?

Market Analysis
how to profit from interest rate cuts

In times of economic uncertainty, central banks often turn to interest rate cuts as a key monetary policy tool to stimulate growth.

These cuts lower the cost of borrowing, encouraging individuals and businesses to take out loans, invest, and spend, which in turn supports economic expansion.

However, the implications of rate cuts extend far beyond basic borrowing; they ripple through financial markets, affecting asset prices, consumer confidence, and even international trade.

Understanding the dynamics of interest rate cuts is crucial for investors seeking to make informed decisions in an evolving economic landscape.

This blog post explores the concept of interest rate cuts, providing an in-depth analysis of their historical timeline and impact across various asset classes.

By examining past trends, we can better understand how rate cuts have influenced markets such as real estate, bonds, equities, and currencies.

Additionally, this report identifies potential investment opportunities that may arise from future rate adjustments, allowing investors to position themselves strategically in anticipation of further changes in the global financial environment.

As central banks around the world, including the Federal Reserve, continue to adjust interest rates to navigate economic challenges, investors must remain vigilant in evaluating how these changes influence the broader market.

From identifying sectors that benefit from lower borrowing costs to understanding how rate cuts can affect currency values and inflation, this report offers valuable insights into the role of interest rate policy in shaping investment opportunities over the coming years.


1. What are Interest Rate Cuts?

Interest rate cuts are a core component of a central bank’s monetary policy toolkit, primarily used to stimulate economic activity by reducing the cost of borrowing.

In the U.S., the Federal Reserve (Fed) manages the federal funds rate, the key rate at which banks lend to each other overnight to meet reserve requirements.

This rate serves as a benchmark for many other interest rates across the economy, such as those on mortgages, auto loans, and business financing.

By lowering the federal funds rate, the Fed aims to reduce borrowing costs across the economy, encouraging consumer spending and business investments, which in turn boosts economic growth.

The Mechanics of Interest Rate Cuts

When the Fed cuts interest rates, it increases the availability of money in the economy.

By reducing the cost of borrowing, businesses find it more affordable to finance expansion, purchase new equipment, or hire additional workers.

Consumers, too, benefit from lower interest rates on loans, mortgages, and credit cards, encouraging them to spend on homes, cars, and other goods.

This injection of capital into the economy typically spurs demand, leading to higher levels of economic activity.

The central bank cuts interest rates in response to a variety of economic challenges.

For example, during periods of recession, deflationary pressures, or weakening employment markets, rate cuts are used to ease financial conditions and prevent further economic contraction.

The ultimate objective is to stimulate growth, keep inflation within a target range (often around 2% for the Fed), and stabilize employment.

In 2024, for instance, the Federal Reserve implemented a 50-basis point cut, bringing the federal funds rate to a range of 4.75% to 5%.

This action followed more than a year of elevated interest rates, which had been raised aggressively from near-zero levels in response to inflation surging after the COVID-19 pandemic recovery.

The September 2024 rate cut was preemptive, aimed at bolstering a labor market showing early signs of cooling, and to prevent a potential recession.

Historical Context and Precedents

Historically, interest rate cuts have been employed during major economic crises.

In 2008, for example, the Fed slashed rates from 5.25% to near zero in response to the global financial crisis. Similarly, in early 2020, the onset of the COVID-19 pandemic led the Fed to cut rates to the 0%-0.25% range to provide immediate support to a collapsing global economy.

By comparison, the September 2024 cut followed a period where the federal funds rate had risen as high as 5.25%-5.50%, the highest level since the early 2000s.

This dramatic swing in interest rate policy underscores how rate cuts are often reactive measures, used after periods of tight monetary policy aimed at controlling inflation.

The aggressive rate hikes from 2022 to 2023 were designed to combat inflation, which peaked at 9.1% in mid-2022, the highest in over 40 years.

By cutting rates in 2024, the Fed aimed to ensure that inflation stayed under control while supporting economic growth as the labor market softened.

Risks and Potential Drawbacks of Interest Rate Cuts

While interest rate cuts stimulate growth, they can also introduce risks. One primary concern is the potential for inflation. If rates are cut too much, borrowing becomes too cheap, leading to an excessive influx of money into the economy.

This can result in demand outpacing supply, driving up prices and leading to inflationary pressures. For example, after the Fed slashed rates in 2020 to near zero, inflation skyrocketed in 2021 and 2022 as pent-up demand, supply chain issues, and labor shortages drove prices higher.

Another risk is the creation of asset bubbles.

Low-interest rates make borrowing cheap, which can lead to speculation and inflated prices in assets such as real estate, stocks, or commodities.

For instance, in the early 2000s, low-interest rates contributed to the housing bubble that eventually led to the 2008 financial crisis.

In the current environment, concerns about inflated equity and real estate markets are prominent, especially with borrowing costs having been historically low for extended periods.

Furthermore, prolonged periods of low rates can distort financial markets.

Savers, for example, may find it difficult to earn meaningful returns on low-risk investments such as savings accounts or government bonds, pushing them into riskier assets in search of yield.

This risk-seeking behavior can lead to financial market instability, as was observed during the era of near-zero interest rates following the 2008 crisis.

Interest Rate Cuts as Economic Signals

Interest rate cuts also serve as powerful signals to financial markets and the public about the central bank’s view of the economy.

A rate cut often signals that the central bank is concerned about the trajectory of economic growth or inflation.

When the Fed cuts rates, it is generally seen as a sign that the economy is slowing or that the central bank is preemptively acting to stave off a downturn.

For instance, in 2024, while the U.S. economy was not yet in a recession, the Fed cut rates to mitigate risks arising from a cooling labor market and other economic vulnerabilities.

This preemptive action was meant to signal that the Fed would take steps to prevent a deeper slowdown.

On the flip side, unexpected or aggressive rate cuts can sometimes lead to market uncertainty, as investors may interpret them as a sign of looming economic trouble.


2. Timeline & Historical Analysis of Interest Rate Cuts

Interest rate cuts by the Federal Reserve are closely watched by economists, investors, and policymakers due to their profound impact on financial markets, borrowing costs, and overall economic activity.

To understand the significance of the Federal Reserve’s decisions, it is essential to explore the timeline and context of major rate cuts, especially in recent decades.
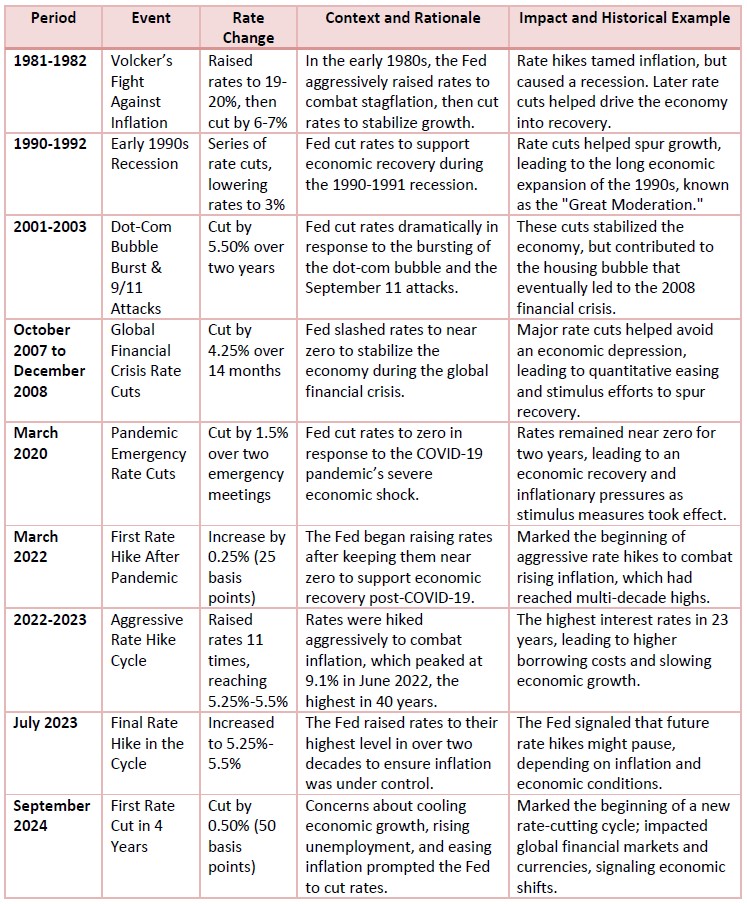
 

timeline of interest rate cuts

The 2020 Rate Cuts: Response to the COVID-19 Pandemic

The Federal Reserve’s most significant recent rate-cutting event occurred in March 2020, during the early days of the COVID-19 pandemic.

As the virus spread globally, triggering widespread economic shutdowns and financial market turmoil, the Fed moved swiftly to cut interest rates.

In a series of emergency actions, the federal funds rate was slashed from a range of 1.50%-1.75% down to 0%-0.25%.

This drastic reduction was an attempt to stave off a deep economic recession by providing cheap credit to businesses and households.

It was the first time since the 2008 financial crisis that rates had been brought down to near-zero levels.

The results of these rate cuts were immediate. Liquidity surged into financial markets, and borrowing costs for consumers and businesses fell sharply.

For instance, the average 30-year fixed mortgage rate dropped below 3%, spurring a housing boom as buyers sought to lock in historically low rates.

Stock markets, which had plunged in early 2020, rebounded strongly. The S&P 500 recovered from its March lows to reach new record highs by the end of the year.

The 2022-2023 Rate Hikes and the Return of Inflation

However, the recovery from the pandemic brought about new challenges.

The rapid injection of liquidity into the economy, coupled with supply chain disruptions, labor shortages, and rising consumer demand, led to a significant spike in inflation.

By mid-2021, inflation had reached levels not seen in decades, with the Consumer Price Index (CPI) climbing over 9% year-over-year in June 2022.

In response, the Federal Reserve shifted from an accommodative policy stance to a hawkish one, raising interest rates aggressively.

From March 2022 through July 2023, the Fed hiked interest rates 11 times, pushing the federal funds rate from near-zero to a range of 5.25%-5.5%, the highest level in more than two decades.

The purpose of these rate hikes was to cool the overheated economy and bring inflation back under control. While inflation did begin to decline toward the Fed’s 2% target—falling to around 3% by mid-2024—the hikes also began to weigh on economic growth, particularly in sectors sensitive to interest rates, such as housing and technology.

The September 2024 Rate Cut: A Pivotal Moment

After more than a year of holding rates at elevated levels, the Federal Reserve made a pivotal decision in September 2024 to cut interest rates by 50 basis points, bringing the federal funds rate to 4.75%-5%.

This marked the first rate cut in over four years and was widely anticipated by financial markets, which had been pricing in a potential easing of monetary policy due to signs of slowing economic growth and a softening labor market.

The September 2024 cut was described by the Fed as a preemptive move to support the labor market, which had been showing signs of cooling. Unemployment had ticked up slightly from its post-pandemic lows, and job growth had begun to slow.

Although inflation was no longer the immediate threat it had been in 2022, the Fed was concerned about the risk of a broader economic slowdown. By cutting rates, the Fed aimed to stimulate demand without stoking a new round of inflation.

This cut also signaled the beginning of a potential new rate-cutting cycle. With the economy entering a period of slower growth, many analysts predicted that the Fed could lower rates further in 2025, depending on the trajectory of inflation and employment.

Financial markets reacted positively to the cut, with major stock indices rising as investors anticipated that lower rates would boost corporate earnings and consumer spending.

Historical Context: Comparing Recent Cuts to Past Cycles

To fully understand the impact of the 2024 rate cut, it’s important to place it within the context of past rate-cutting cycles.

Since 1990, the Federal Reserve has undergone six major rate-cut and rate-hike cycles, each corresponding to different economic crises or recessions.

For example:
1990-1992: In response to a recession caused by rising oil prices and tighter monetary policy in the late 1980s, the Fed cut rates from 8% to 3% over a period of 18 months.
2001-2003: Following the burst of the dot-com bubble and the 9/11 terrorist attacks, the Fed slashed rates from 6.5% to 1% to stimulate a struggling economy.
2007-2009: During the global financial crisis, the Fed cut rates from 5.25% to near-zero, a period marked by massive economic contraction and financial instability.

Each of these rate-cutting cycles was followed by a period of recovery, though the speed and magnitude of the recovery varied based on the underlying causes of the economic downturn.

The 2024 rate cut is likely to be compared most closely to the rate cuts made in the aftermath of the 2001 recession and the 2008 financial crisis, as these events also followed aggressive periods of rate hikes.

Projections for Future Rate Cuts

Looking forward, many analysts expect that the Fed’s September 2024 cut could be the first in a series of reductions, depending on economic data in the coming months. Current forecasts suggest that the Fed could lower rates by an additional 100 to 150 basis points by the end of 2025 if inflation remains under control and growth continues to slow. However, the pace of these cuts will be highly dependent on the labor market and inflation data.

A key factor to watch will be whether the economy can avoid slipping into a recession. If the labor market weakens significantly or if inflation falls below the Fed’s 2% target, the central bank may opt for a more aggressive rate-cutting cycle. Conversely, if inflation begins to reaccelerate, the Fed could pause or slow the pace of cuts to avoid stoking new price pressures.

3. Impact on Various Asset Classes & Investment Opportunities

Interest rate cuts by the Federal Reserve have wide-reaching effects across all asset classes, from fixed income to equities, real estate, and commodities.

When the Fed lowers interest rates, the cost of borrowing declines, which directly and indirectly influences the returns on different investments.

Investors tend to shift their strategies in response to rate cuts, reallocating their portfolios to take advantage of lower borrowing costs and the potential for economic growth.

In this section, we will explore how interest rate cuts affect major asset classes, including bonds, equities, real estate, and currencies, supported by historical examples and current forecasts.
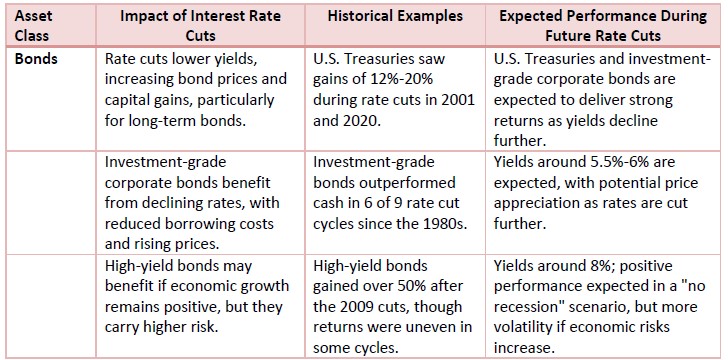
asset class1
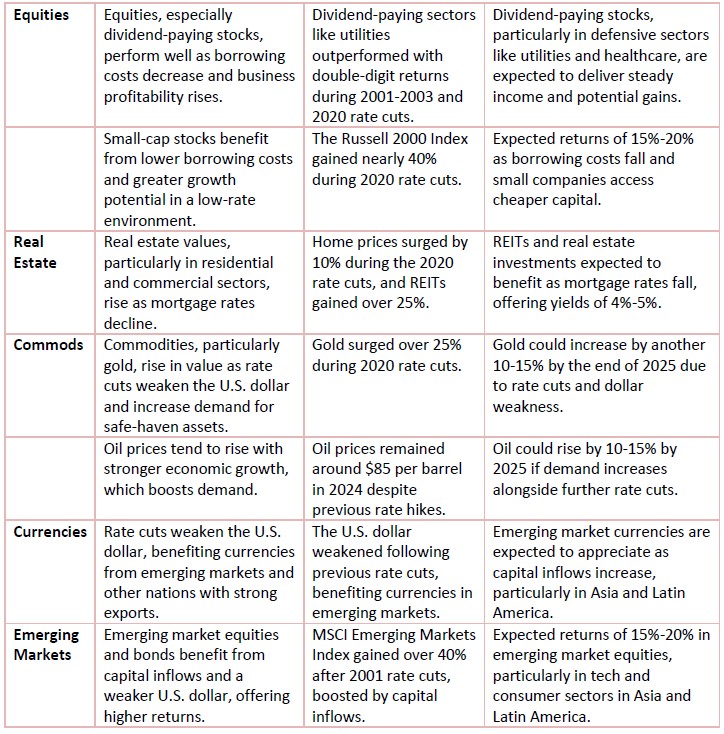
asset class2

Bonds: The Primary Beneficiary

Fixed income assets, particularly government bonds, are usually the biggest beneficiaries of interest rate cuts.

Bond prices have an inverse relationship with interest rates—when rates fall, bond prices rise.

This is because new bonds issued after a rate cut offer lower yields, making existing bonds with higher coupon rates more attractive.

As demand for these higher-yielding bonds increases, their prices rise, providing capital gains to bondholders.

High-Yield Bonds

High-yield bonds, also known as “junk bonds,” can have a more mixed performance during rate-cut cycles.

These bonds, which are rated below investment grade (BB or lower), offer higher yields to compensate for their higher default risk.

In a “no recession” scenario, high-yield bonds often perform well as lower borrowing costs allow companies to refinance their debt more easily.

However, in the lead-up to or during a recession, high-yield bonds may underperform due to heightened credit risk.

For example, during the 2020 rate cuts, high-yield bonds experienced significant volatility.

While they rebounded strongly after the initial market panic subsided, many investors remained cautious due to concerns about rising default rates among riskier borrowers.

In 2024, high-yield bonds could see similar volatility, particularly if the U.S. economy enters a slowdown or mild recession.

However, if the Fed’s rate cuts successfully prevent a downturn, high-yield bonds could deliver strong returns, especially in sectors like energy and industrials.

Equities: Mixed Performance Depending on Economic Context

Stocks, or equities, typically benefit from lower interest rates, as cheaper borrowing costs support corporate profitability and boost economic activity.

However, the degree of impact varies depending on the broader economic context and the specific sector in question.

Growth Stocks vs. Value Stocks

Growth stocks, which are companies expected to grow at above-average rates, often benefit significantly from rate cuts.

These companies tend to rely more on external financing for expansion, and lower rates reduce the cost of this capital.

In past rate-cutting cycles, technology stocks have been major beneficiaries.

For instance, during the rate cuts following the 2008 financial crisis, the NASDAQ-100, heavily weighted toward tech companies, outperformed broader market indices, growing by over 50% in the first year of rate cuts.

In contrast, value stocks—companies trading below their intrinsic value, often with stable cash flows—may not benefit as much from rate cuts, although they still provide solid returns in certain environments. Value stocks in sectors like utilities and consumer staples tend to perform better in recessionary periods, as they are less sensitive to economic downturns and provide reliable dividends.

In 2024, with the Federal Reserve initiating a new cycle of rate cuts, growth stocks, particularly in sectors like technology and healthcare, are expected to outperform.

Companies such as Apple, Amazon, and Microsoft, which have large cash reserves and significant growth potential, stand to benefit from lower rates as their future cash flows are discounted at a lower rate, increasing their present value.

Value stocks, particularly in sectors like energy and financials, may lag behind but could still provide attractive dividend yields.

Small-Cap vs. Large-Cap Stocks

Small-cap stocks, which are companies with smaller market capitalizations, often benefit more from rate cuts than their larger counterparts.

These companies typically rely more heavily on short-term borrowing, so lower interest rates reduce their financing costs, boosting their bottom lines.

During the Fed’s last rate-cutting cycle in 2020, the Russell 2000, a small-cap index, outperformed the S&P 500, gaining nearly 40% by the end of the year.

In 2024, small-to-mid cap stocks are once again poised to outperform, particularly if the U.S. economy avoids a recession.

Analysts have noted that many small-cap companies are already seeing earnings acceleration, while large-cap companies are facing slowing profit growth.

As rate cuts reduce borrowing costs, small-cap companies in sectors like industrials and consumer discretionary could deliver significant returns, with some forecasts projecting gains of 15%-20% in 2025.

Real Estate: A Significant Beneficiary of Rate Cuts

Real estate, particularly through vehicles like real estate investment trusts (REITs), tends to benefit strongly from rate cuts.

Lower interest rates reduce mortgage costs for both commercial and residential real estate, making property more affordable and increasing demand.

This leads to rising property values and higher rental incomes for REITs.

In the 2020 rate-cutting cycle, real estate experienced a boom, with home prices soaring as mortgage rates dropped to historic lows.

The average 30-year fixed mortgage rate fell below 3%, spurring a wave of home buying and refinancing.

Similarly, commercial real estate saw a recovery as businesses took advantage of lower borrowing costs to expand or refinance existing debt.

In 2024, as rates begin to decline again, real estate markets are expected to benefit. REITs, which offer higher-than-average dividend yields, are particularly attractive to income-seeking investors.

The Vanguard Real Estate ETF (VNQ), a broad-based REIT index, could see significant inflows, with some analysts predicting returns of 10%-12% over the next 12 months as property values and rental incomes rise.

Currencies

When the Fed cuts interest rates, the U.S. dollar tends to weaken relative to other major currencies, as lower rates reduce the yield on dollar-denominated assets, making them less attractive to foreign investors. In 2024, following the September rate cut, the U.S. dollar index (DXY) fell by around 1%, and further cuts are expected to push the dollar down by an additional 3%-5% in 2025.

A weaker dollar benefits U.S. exporters by making American goods cheaper abroad, which could boost sectors like manufacturing and agriculture.

Commodities

Commodities such as gold and oil often react differently to rate cuts.

Gold, traditionally seen as a hedge against inflation and currency depreciation, tends to rise when interest rates fall, as the opportunity cost of holding non-yielding assets decreases.

In 2020, gold prices surged by over 25% as rates dropped to near zero.

In 2024, with further rate cuts on the horizon, gold is expected to perform well, with some analysts forecasting prices to reach $2,200 per ounce by mid-2025.

Oil prices, on the other hand, are more sensitive to global economic growth.

While lower rates can boost demand by stimulating economic activity, oil markets are also affected by supply dynamics and geopolitical events.

In 2024, oil prices remained relatively stable following the Fed’s rate cut, hovering around $85 per barrel.

However, if rate cuts successfully stimulate growth in emerging markets, demand for oil could increase, pushing prices higher in 2025.


4. Conclusion

Interest rate cuts represent one of the most powerful tools that central banks, such as the Federal Reserve, have at their disposal to influence economic conditions.

These cuts lower the federal funds rate, making borrowing cheaper for businesses and consumers.

The main objective is to stimulate economic activity by encouraging spending and investment, particularly during times of economic slowdown or financial distress.

The Fed’s recent 50-basis point cut in September 2024, the first in over four years, marks a pivotal shift in its monetary policy after an extended period of aggressive rate hikes to combat inflation.

Historically, rate cuts aim to stabilize inflation, support the labor market, and mitigate the risks of a recession, but the effectiveness of these cuts depends heavily on the broader economic context and timing.

The timeline of rate cuts and hikes reveals that these shifts often come in response to economic crises.

Since 1990, six major rate-cut cycles have occurred, often following periods of financial stress, such as the dot-com bubble, the 2008 global financial crisis, and the COVID-19 pandemic.

The 2024 cuts, coming after an aggressive hiking cycle that pushed rates to a 23-year high, signal the Fed’s concerns over cooling economic growth and rising unemployment.

These cuts are expected to continue into 2025, potentially providing significant relief to global economies, particularly those with dollar-denominated debt.

The impact of interest rate cuts spans multiple asset classes, with bonds typically being the primary beneficiaries. U.S. Treasuries, investment-grade corporate bonds, and high-yield bonds all perform well when rates fall, as the cost of borrowing decreases, leading to capital gains.

Equities, particularly dividend-paying stocks and small-cap companies, also tend to benefit from rate cuts, as lower interest rates support higher corporate earnings and growth potential.

Real estate, both residential and commercial, sees increased demand due to lower mortgage rates, making real estate investment trusts (REITs) a key area of opportunity for income-seeking investors.

Commodities like gold often rise as rate cuts weaken the U.S. dollar, while oil prices can increase with stronger economic demand.

Looking ahead, the current rate-cut cycle presents a range of potential investment opportunities.

Bonds, especially U.S. Treasuries and investment-grade corporate bonds, are poised for capital gains as yields decline.

Dividend-paying stocks and small-cap equities may outperform, driven by lower financing costs and improved earnings. Real estate remains a significant beneficiary, with REITs offering attractive yields in a low-rate environment.

Commodities, particularly gold and oil, could experience price appreciation, while emerging markets stand to gain from increased capital inflows and a weaker dollar.

Investors should consider these opportunities and adjust their portfolios accordingly as the Fed continues its rate-cutting policy into 2025.

As we come to the end of the report, here are some questions to ponder about:

1. With interest rates expected to decline further, how can investors balance the risks of inflation with the potential for growth in fixed-income assets like bonds?

2. As emerging markets stand to benefit from a weaker U.S. dollar and lower rates, what are the potential geopolitical risks that could influence their long-term growth prospects?

3. Given that rate cuts can stimulate both positive economic growth and excessive risk-taking, how can central banks effectively manage the delicate balance between fostering growth and preventing asset bubbles in financial markets?

Let me know your answers in the comments below!

0 Comments/by The Synapse Network
https://synapsetrading.com/wp-content/uploads/2024/10/how-to-profit-from-interest-rate-cuts-1.png 720 1280 The Synapse Network https://synapsetrading.com/wp-content/uploads/2019/10/logo.jpg The Synapse Network2024-10-26 21:46:472024-10-29 23:12:38How to Profit from Interest Rate Cuts?
Spencer Li

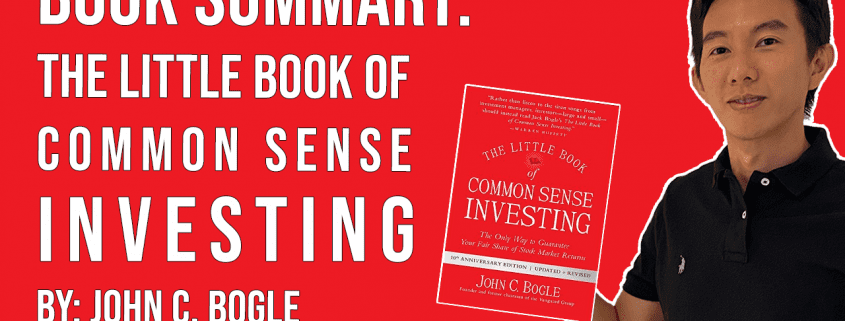
Book Summary: The Little Book of Common Sense Investing by John C. Bogle

Book Summaries
thumbnail Book Summary The Little Book of Common Sense Investing

The Little Book of Common Sense Investing (Bogle): Summary and Key Ideas

Last updated: 3 July 2026 · By Spencer Li, CFTe


“The Little Book of Common Sense Investing” by John C. Bogle argues that the surest way for an ordinary investor to build wealth is to buy a low-cost index fund (a fund that simply tracks the whole market instead of trying to beat it), hold it for decades, and stop trying to be clever. Bogle, who founded Vanguard and created the first index fund for everyday investors, makes one core case across the whole book: most investors, professionals included, cannot beat the market consistently, and the fees they pay trying to do so quietly eat their returns. So the rational move is to own the market cheaply and let compounding do the work. The book is short, plain, and almost boring on purpose. That is the point. It is a manual for getting out of your own way.

I read this as a trader, not as a passive investor, and I still think it is one of the most important investing books ever written. Here is why, what is actually in it, and how a trader should read it.

Who is John Bogle, and why listen to him?

John C. Bogle (1929 to 2019) founded the Vanguard Group in 1975 and launched the first index mutual fund available to the public the following year. At the time, the idea of a fund that deliberately did not try to outperform was treated as a joke. Today index funds hold trillions of dollars, and Bogle is often called the “godfather of index funds.”

What makes him credible is that he spent a career arguing against his own industry’s profit centre. Fund companies make money from fees. Bogle’s whole message was that those fees are the enemy of the investor. He built Vanguard as a client-owned structure so it could keep costs low. Hence the no-nonsense tone of the book: he is not selling you a product. He is telling you to buy the cheapest, dullest thing on the shelf.

What is the book actually about?

The book makes one argument and defends it from several angles: own the entire market through a low-cost index fund, hold for the long term, and refuse to be talked out of it.

Bogle’s reasoning runs like this. The stock market, over a long enough horizon, delivers a return that reflects the real growth of the businesses inside it. That return is there for the taking. The problem is that investors keep subtracting from it: trading costs, management fees, taxes from churn, and bad timing decisions driven by fear and greed. An index fund minimises every one of those leaks. You capture close to the full market return because you are not paying anyone to try (and usually fail) to beat it.

The villain of the book is cost. Bogle’s most quotable idea is simple: in investing, you get what you don’t pay for. A 2% annual fee sounds small. Over 30 years of compounding, it can quietly consume a large slice of your final wealth. That is the engine behind everything else he says.

The core ideas, without the repetition

The source material for this book lists the same handful of points many times over. Stripped down, Bogle is really making six arguments:

  1. Own the whole market. A broad index fund gives you instant diversification (spreading money across many holdings so no single one can sink you) at almost no cost.
  2. You probably can’t beat the market, and neither can the pros. The majority of actively managed funds underperform their index over the long run, especially after fees.
  3. Cost is the thing you can actually control. You cannot control returns. You can control how much you pay, so drive it to the floor.
  4. Compounding rewards time, not cleverness. Start early, stay invested, and let the math run. Trying to get rich quickly usually does the opposite.
  5. Your emotions are the other enemy. Fear and greed make people sell at bottoms and buy at tops. A simple plan you can hold through a crash beats a brilliant plan you abandon in a panic.
  6. Simplicity wins. The more moving parts, the more places to leak money and nerve. Boring is a feature.

Active funds vs index funds, over time

Here is the comparison at the heart of Bogle’s case, laid out plainly:

Active fundLow-cost index fund
GoalBeat the marketMatch the market
Typical costHigh (management fees, trading, taxes from churn)Very low
Long-run record vs indexMost underperform after feesTracks the market by design
What you rely onA manager’s skill staying hot for decadesThe market’s long-term growth
Effort to runPicking and switching fundsBuy, hold, ignore
Bogle’s verdictA bet against the oddsThe rational default

Do note that this is the long-horizon picture. Over a single year, plenty of active funds beat the index. The trouble is that the winners rarely repeat, and you cannot know in advance which ones they will be. Across decades, the cost drag compounds and the odds tilt hard toward the cheap, simple option.

How should a trader read this book?

This is the part people get wrong. They see “index funds win” and assume Bogle is telling everyone to never trade. That is not the lesson I take.

Personally, I run two separate buckets, and this book governs only one of them. The long-term bucket is exactly what Bogle describes: low-cost, diversified, automatic, untouched. It is the foundation. The active bucket is where I trade with a defined system, defined risk, and a public log. The mistake is mixing the two, treating your serious savings like a casino, or treating your trading capital like it should be left alone for 30 years.

So read Bogle as the floor, not the ceiling. He is right that most people who try to beat the market lose to it. He is also describing exactly why a disciplined, low-cost, rules-based approach matters whether you are indexing or trading. The discipline is the same. Cut costs, control emotions, think in decades, and do not confuse activity with progress.

Here is the one honest caveat. If you are going to trade actively, Bogle’s data is a warning shot, not an insult. It tells you the bar is high and the average participant is below it. That should make you more rigorous about edge, sizing, and process, not less. A fund manager with a research team usually fails to beat a dumb index. That is the company you are choosing to keep when you decide to trade, so bring a real system or don’t bother.

Where the human edge comes in

An index fund is the ultimate “let the machine do it” investment. You hand the whole job to a rules-based vehicle and walk away, and for most people that is the right call. The judgment is not in running it. It is in deciding which money belongs there and which money you are willing to actively manage, sizing each bucket to your real life, and then having the discipline to leave the long-term bucket alone through a 30% drawdown. The fund captures the market return. Whether you actually keep it is down to your behaviour, and that is the first of the Five Edges no fund can supply for you.

FAQ

What is the main message of The Little Book of Common Sense Investing?
Buy a low-cost index fund that owns the whole market, hold it for the long term, and stop trying to beat the market. Bogle argues that low cost and simplicity, not stock-picking skill, are what actually drive long-term investing success.

Is The Little Book of Common Sense Investing worth reading?
Yes, especially if you are new to investing or want to simplify a portfolio that has drifted into too many funds and fees. It is short, plain, and built around one durable idea. Experienced traders also benefit from it as a reminder of how much cost and emotion quietly cost you.

What does Bogle mean by “you get what you don’t pay for”?
He means that in investing, lower cost directly raises your net return. Because you cannot control the market’s return, the fees you avoid are the most reliable way to keep more of what the market gives. Over decades of compounding, even a small annual fee can consume a large share of your final wealth.

Does Bogle say you should never trade or pick stocks?
He argues that most investors, including professionals, fail to beat the market consistently, so for the bulk of your money, indexing is the rational default. He does not claim it is impossible to trade well, only that the odds are against the average participant, which is a reason to be disciplined rather than reckless.

Are index funds really safer than active funds?
Index funds are not immune to market crashes, since they fall with the market they track. What they remove is the extra risk of a single manager underperforming and the steady drag of high fees. Bogle’s point is about reliability and cost, not about avoiding market risk altogether.


Now that you have Bogle’s case for the boring, low-cost, long-term approach, the real question is which of your money it should govern, and which money you are willing to actively trade with a real system. Have you read this one? Let me know your key takeaway in the comments.

For more, browse the full shelf: Best Investing and Trading Books of All Time.

Want a system for the active side of the ledger? Grab the free 15-Minute Swing Trading Starter Kit, the exact routine I use to scan once a day and trade any market in 15 minutes.


About the author. Spencer Li is the founder of Synapse Trading and a Certified Financial Technician (CFTe) with 15+ years of trading across stocks, forex, crypto, commodities, and bonds. His trade log is public: every trade since April 2024, dated, losses left in. He has taught a 15-minute daily trading routine since 2014, one system for any market.

Education, not financial advice. Synapse Trading is not licensed by MAS to advise on investment products. Trading carries risk of loss; past performance is not indicative of future results.


Related

Best Investing and Trading Books of All Time (pillar) · The Intelligent Investor summary · A Random Walk Down Wall Street summary

0 Comments/by Spencer Li
https://synapsetrading.com/wp-content/uploads/2023/01/thumbnail-Book-Summary-The-Little-Book-of-Common-Sense-Investing.png 720 1280 Spencer Li https://synapsetrading.com/wp-content/uploads/2019/10/logo.jpg Spencer Li2024-08-05 19:30:072026-10-05 12:10:01Book Summary: The Little Book of Common Sense Investing by John C. Bogle
Spencer Li

The Yen Carry Trade: Unwinding and Its Global Implications

Economics & News Trading
blog post thumbnail yen carry trade

blog post thumbnail yen carry trade

The yen carry trade has long been a cornerstone of global financial strategies, allowing investors to leverage Japan’s low-interest rates for higher returns abroad.

However, recent developments have put this once-reliable trade under pressure.

In this blog post, I will explain what the yen carry trade is, its historical context, the reasons behind its current unwinding, and how it will affect the various financial markets.


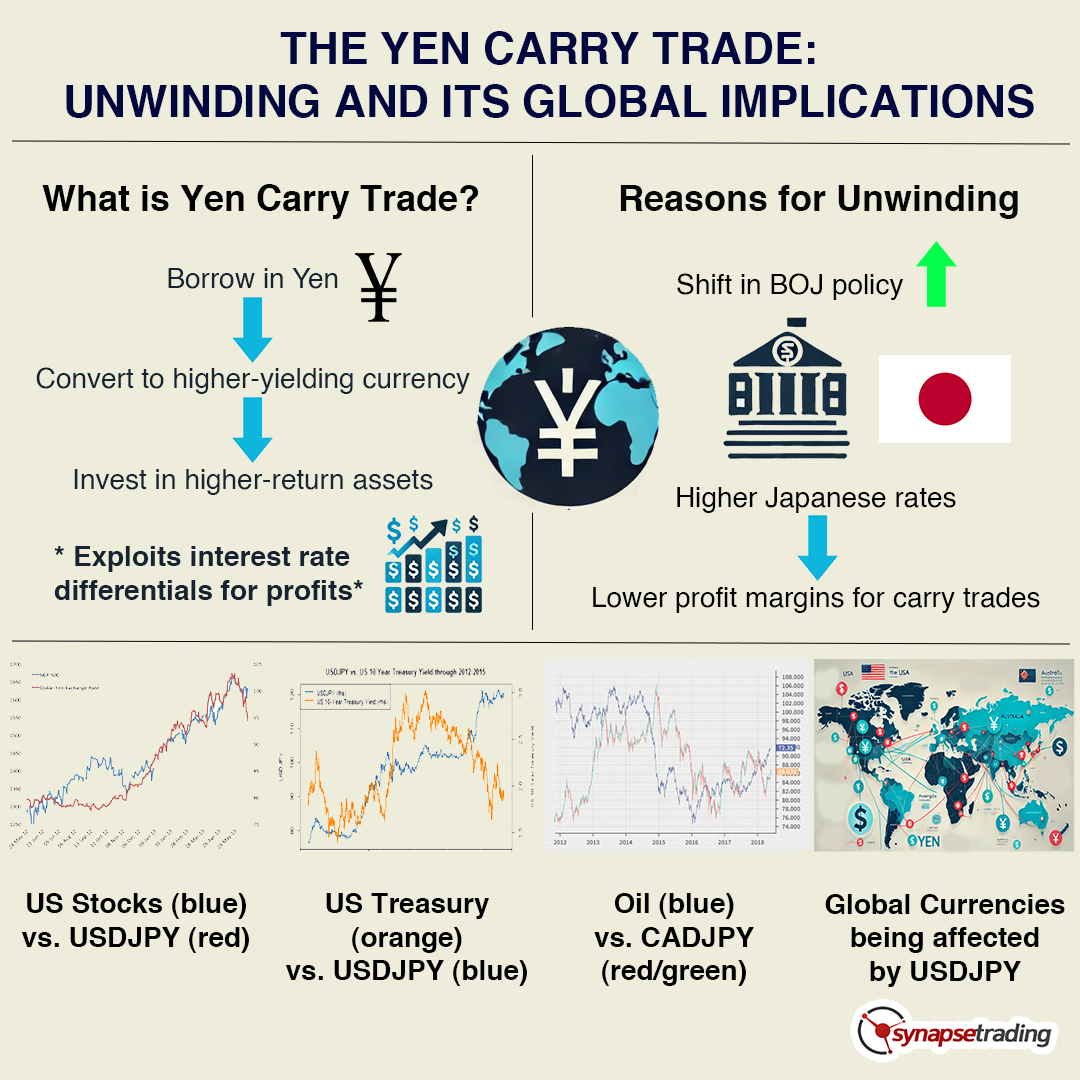
final infographics The Yen Carry Trade

What is the Yen Carry Trade?

The yen carry trade involves borrowing funds in Japanese yen, where interest rates are typically very low, and then converting these funds into a currency with higher interest rates to invest in assets that yield better returns.

This strategy exploits the differential in interest rates between Japan and other countries, allowing investors to profit from the spread. Historically, it has been a lucrative endeavor, with minimal cost for borrowing in yen and potential for significant gains in higher-yielding currencies and assets.

To elaborate, the core mechanism of the yen carry trade is based on the interest rate differential. Japan has maintained one of the lowest interest rates among developed countries, often near or at zero.

Investors borrow in yen at these low rates and convert the yen into currencies like the U.S. dollar or Australian dollar, where interest rates are higher. The borrowed funds are then invested in assets that provide higher returns, such as government bonds, corporate bonds, equities, or real estate in those higher-yielding currencies.

The profit for the investor comes from the difference between the low cost of borrowing in yen and the higher returns on the investments made in other currencies.

For example, if an investor borrows yen at an interest rate of 0.1% and invests in U.S. Treasury bonds yielding 2%, the investor earns the difference, minus any exchange rate changes. This trade is particularly attractive during periods of stable or appreciating currencies against the yen, as any gain in the target currency further enhances returns.

Historical Context

The yen carry trade gained popularity in the late 1990s and early 2000s as Japan maintained ultra-low interest rates in response to its prolonged economic stagnation. The Bank of Japan’s (BOJ) commitment to near-zero rates created a fertile ground for this strategy.

Investors flocked to borrow in yen and invest in higher-yielding assets worldwide, driving significant capital flows across global markets. This trade contributed to liquidity in financial markets and often amplified asset price movements.

In the 1990s, Japan’s economy was grappling with the aftermath of the asset bubble burst. The BOJ slashed interest rates to stimulate economic activity, making borrowing extremely cheap.

This environment catalyzed the yen carry trade, attracting global investors who could borrow yen at negligible costs. By the early 2000s, this strategy was widespread, influencing capital flows and asset prices globally.

The 2008 financial crisis marked a significant moment for the carry trade. As global markets plunged, investors scrambled to unwind their yen positions, leading to a sharp appreciation of the yen.

This episode highlighted the inherent risks of the carry trade—while it could be highly profitable in stable times, it also posed substantial risks during periods of market turbulence.

Why is the Trade Unwinding Now?

The yen carry trade is unwinding primarily due to the recent policy shifts by the Bank of Japan. For the first time in many years, the BOJ has signaled an end to its ultra-loose monetary policy by lifting its main interest rate. This move, aimed at combating inflation and stabilizing the economy, has had profound implications for the carry trade.

As Japan’s interest rates rise, the cost of borrowing in yen increases, reducing the profitability of the carry trade. Consequently, investors are beginning to unwind their positions, repaying yen-denominated debt and selling off foreign assets.

In detail, the BOJ’s decision to raise interest rates is a response to rising inflationary pressures. Japan, historically plagued by deflation, is now facing inflationary trends similar to other advanced economies.

To curb inflation, the BOJ has started to tighten its monetary policy, which includes raising interest rates. This change increases the cost of borrowing in yen, thereby diminishing the appeal of the carry trade.

As the yen appreciates, the cost of repaying yen-denominated loans increases, prompting investors to close their positions.

The rapid unwinding has created significant volatility in financial markets, particularly in assets that were popular targets of the carry trade, such as U.S. equities and emerging market currencies.

What is the Significance of This?

The unwinding of the yen carry trade is significant for several reasons.

Firstly, it signals a major shift in Japanese monetary policy, which has been a cornerstone of global financial markets for decades.

Secondly, it highlights the interconnectedness of global markets, where a policy change in Japan can ripple through to impact asset prices and capital flows worldwide. The yen exchange rate has become a key driver of global markets, indicating the profound influence of Japanese monetary policy on international financial dynamics.

This shift underscores the global dependency on Japanese monetary policy.

For years, the yen carry trade has been a source of global liquidity, supporting asset prices and economic growth in various regions. The BOJ’s policy shift not only affects Japan but also has broad implications for global financial stability.

The yen’s appreciation and the subsequent market reactions demonstrate how deeply intertwined global financial systems are, with Japan playing a pivotal role.

How Does it Affect the Markets?

The impact of the yen carry trade unwinding is already being felt across various markets.

The rapid appreciation of the yen against the U.S. dollar has caught many market participants off guard. Over the last month, the yen has surged approximately 8% against the dollar, a stark contrast from its depreciation earlier in the year. This sudden rally has triggered a sell-off in U.S. equities, as investors unwind their carry trade positions, leading to downward pressure on asset prices.

This market reaction highlights the vulnerabilities in financial markets to changes in the yen exchange rate. The appreciation of the yen increases the cost of repaying yen-denominated debt, prompting investors to liquidate assets to meet these obligations. This selling pressure has led to declines in equity prices and increased volatility in financial markets.

Deep Dive on Specific Markets

  1. U.S. Equities: The U.S. stock market has experienced increased volatility and a broad slump as the yen appreciates. The unwinding of the carry trade leads to selling pressure on U.S. equities, exacerbating declines in stock prices. This negative reaction of U.S. equity prices is an early warning of the challenges ahead.The relationship between the yen carry trade and U.S. equities is significant because many investors use borrowed yen to invest in U.S. stocks. When the yen strengthens, these investors face higher costs to repay their loans, leading them to sell their U.S. stock holdings. This selling pressure contributes to market declines and increased volatility.
  2. U.S. Government Debt: The yields on U.S. government bonds have also been affected. As investors sell foreign assets to repay yen-denominated debt, there is a shift in demand dynamics for U.S. Treasuries, influencing yields and bond prices.Typically, during periods of financial stress, U.S. Treasuries are seen as a safe haven. However, the unwinding of the carry trade can lead to complex dynamics. While some investors may flock to Treasuries for safety, others may sell them to cover their yen-denominated liabilities, leading to fluctuating yields.
  3. Global Currency Markets: The yen’s rally has had a ripple effect on other currencies, particularly those that were heavily borrowed against in carry trades. This includes higher-yielding currencies like the Australian dollar and emerging market currencies, which have seen increased volatility and depreciation against the yen.The strength of the yen affects global currency markets by altering the dynamics of capital flows. Currencies that were favored in carry trades may experience significant depreciation as investors unwind their positions. This can lead to heightened volatility and potential financial instability in countries reliant on these capital flows.
  4. Commodities: Commodity markets are also impacted as the unwinding of the carry trade affects global liquidity and risk sentiment. A stronger yen can lead to reduced commodity prices, as Japan is a significant importer of raw materials.Commodities are sensitive to changes in global liquidity and risk sentiment.The unwinding of the carry trade can reduce liquidity, leading to lower demand for commodities. Additionally, a stronger yen makes imports cheaper for Japan, potentially reducing the global prices of commodities such as oil and metals.

Concluding Thoughts

The unwinding of the yen carry trade is a pivotal development in global financial markets, driven by the Bank of Japan’s shift in monetary policy. Its effects are far-reaching, impacting equities, bonds, currencies, and commodities worldwide. As the yen appreciates, the vulnerabilities in global markets are laid bare, underscoring the interconnectedness of financial systems.

Investors and policymakers alike must navigate these changes with an understanding of the intricate dynamics at play, ensuring strategies are adapted to this new financial landscape.

Now that I have shared all about the Yen carry trade unwinding, here are some questions to ponder about:

  • How might the unwinding of the yen carry trade influence the stability and valuation of emerging market currencies that were previously beneficiaries of this strategy?
  • What potential long-term impacts could the shift in Japanese monetary policy have on global equity markets, particularly in terms of investment flows and asset allocation strategies?

Let me know your answers in the comments below.

0 Comments/by Spencer Li
https://synapsetrading.com/wp-content/uploads/2024/08/blog-post-thumbnail-yen-carry-trade.png 1024 1792 Spencer Li https://synapsetrading.com/wp-content/uploads/2019/10/logo.jpg Spencer Li2024-08-05 14:39:392024-08-08 15:23:11The Yen Carry Trade: Unwinding and Its Global Implications
Spencer Li

SkillsFuture Course on Trading & Investing!

News & Events

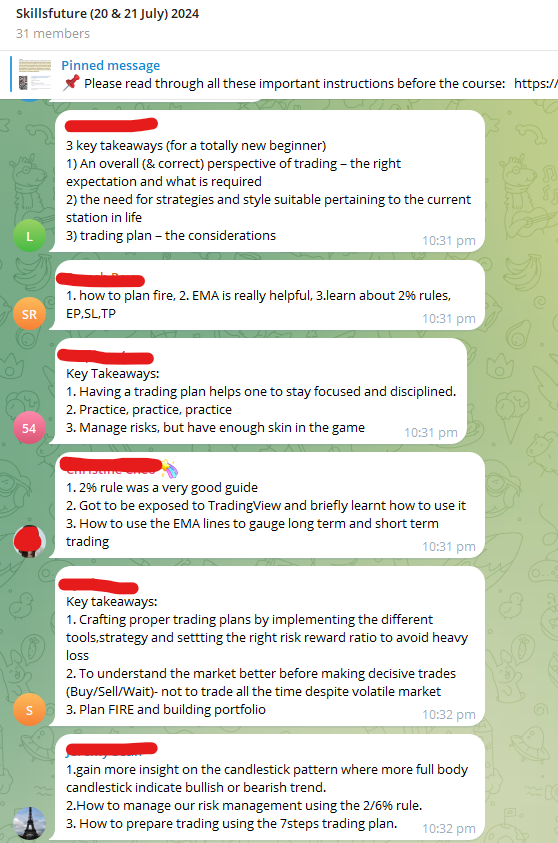
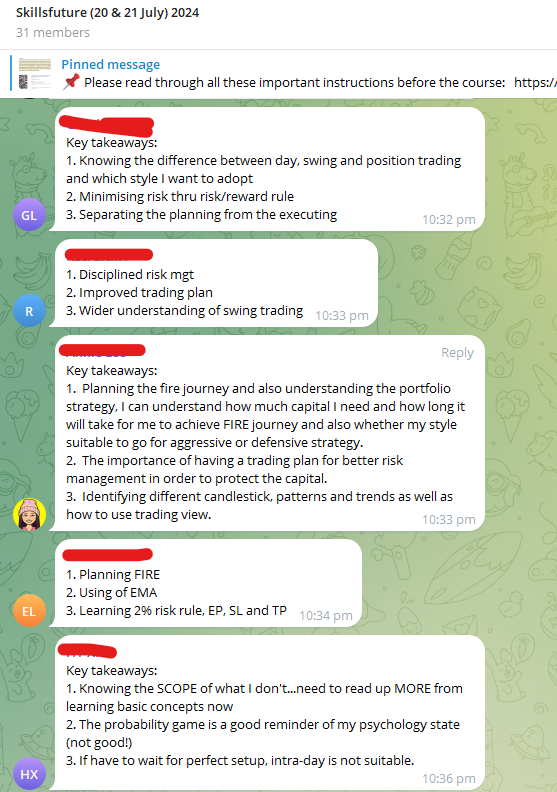
Last week, we conducted another online workshop on the basics of trading and investing, and since it is a SkillsFuture Credit-Eligible Course, participants could use their SkillsFuture credits to pay for the course instead of cash.

Thanks for the support!

During the 9 hours of training, participants learnt portfolio strategies to build and protect their wealth, as well as trading skills like market-timing, chart-reading and risk management to improve their trading results.

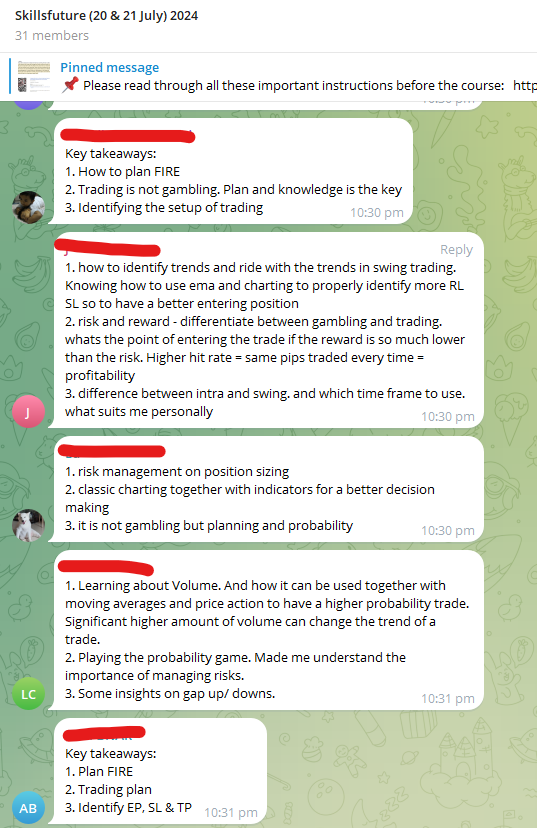
Here is some of the feedback and learning points from participants, after our hands-on market analysis session to find trading opportunities in the market.

This workshop no longer runs. To learn the full method with us now, see the Trading Mastery Program.


skillsfuture feedback 1 240724 skillsfuture feedback 2 240724 skillsfuture feedback 3 240724 skillsfuture feedback 4 240724


0 Comments/by Spencer Li
https://synapsetrading.com/wp-content/uploads/2019/10/logo.jpg 0 0 Spencer Li https://synapsetrading.com/wp-content/uploads/2019/10/logo.jpg Spencer Li2024-07-24 23:06:372026-10-05 01:24:02SkillsFuture Course on Trading & Investing!
Spencer Li

Understanding Contracts for Difference (CFDs)

Trading Tips
thumbnail CFDs with title

What Are CFDs (Contracts for Difference) and How Do They Work?

Last updated: 3 July 2026 · By Spencer Li, CFTe


A CFD (Contract for Difference) is an agreement between you and a broker to exchange the difference in an asset’s price from when you open the trade to when you close it, without ever owning the asset itself. If the price moves your way, the broker pays you the difference; if it moves against you, you pay the broker. You can go long (buy, betting the price rises) or short (sell, betting it falls), and because CFDs are traded on margin (you put up a small fraction of the position’s value), a small amount of capital controls a large position. That leverage cuts both ways: it magnifies your gains and your losses in equal measure. CFDs let you trade stocks, indices, forex, commodities, and crypto from one account, which is the real draw. The catch is that the same leverage that makes them attractive is what blows up most beginners. So they suit experienced traders who already have risk management down, not someone learning on a live account.

Here is how they actually work, the markets you can trade, the trade-offs, and two worked examples.

What is a CFD, in plain terms?

A CFD is a financial derivative (a contract whose value is derived from something else) that lets you speculate on an asset’s price without buying the asset. You never hold the shares, the gold, or the coins. You hold a contract that tracks the price.

Think of it like betting on the outcome of a football match without buying the team. You agree with the bookmaker (the broker) on a price now. When the match ends (you close the trade), whoever was right collects the difference. That is the whole idea.

Four things happen in every CFD trade:

  • Opening a position. If you think the price will rise, you open a long (buy) position. If you think it will fall, you open a short (sell) position. The ability to short easily is a big part of why traders like CFDs.
  • Leverage. CFDs trade on margin, so a small deposit controls a much larger position. This amplifies profits, and it amplifies losses by exactly the same factor. Do note that this is the part that hurts people.
  • Spread and costs. Your cost includes the spread (the gap between the buy price and the sell price) plus any holding cost charged for keeping a position open overnight.
  • Closing a position. To bank the profit or loss, you do the opposite of what you did to open: you sell if you bought, and you buy if you sold. The difference between your open and your close is your result.

Where did CFDs come from?

CFDs were created in the early 1990s in London, developed by two investment bankers at UBS Warburg, Brian Keelan and Jon Wood. They were not built for retail traders at all. They started as an equity swap that institutions used to hedge positions on the London Stock Exchange cheaply, mostly to sidestep the UK stamp duty tax on buying physical shares.

Three things made them useful from the start:

  • Tax efficiency. They let big institutional players avoid stamp duty on large share purchases.
  • Leverage. They let traders control large positions with a small amount of capital (amplifying profit and loss alike).
  • Flexibility. They made it easy to go both long and short, in any market condition.

Through the late 1990s and early 2000s, online brokerages and trading platforms put CFDs in front of retail traders for the first time. The product spread out of the UK into Europe and Australia, with each region adapting it to its own rules.

That popularity brought scrutiny. Regulators like the Financial Conduct Authority (FCA) in the UK and the Australian Securities and Investments Commission (ASIC) stepped in to protect retail investors. They imposed leverage limits to cap the risk, and they required brokers to give clear risk warnings so clients understand what they are getting into. That regulatory tightening is also why CFDs are restricted or banned outright in some countries.

What can you trade with CFDs?

This is the genuine appeal. One CFD account gives you access to a wide range of markets:

  • Stocks. Shares of companies like Apple, Google, and Tesla.
  • Indices. The S&P 500, FTSE 100, Nikkei 225, and other market indices.
  • Forex. Currency pairs like EUR/USD and GBP/JPY.
  • Commodities. Precious metals like gold and silver, and energy like oil and natural gas.
  • Cryptocurrencies. Bitcoin, Ethereum, and others.
  • ETFs. Exchange-traded funds, for exposure to whole sectors or asset classes at once.

Pros and cons of trading CFDs

CFDs come with real advantages and real risks, and you need both halves of the picture before you decide whether they fit you.

CFDs
LeveragePro: higher potential returns from a smaller deposit. Con: the same leverage can produce losses that exceed your initial outlay.
Market accessPro: stocks, forex, commodities, indices, and crypto from one platform.
DirectionPro: profit from falling markets (short) as easily as rising ones (long).
OwnershipPro: no need to custody or handle the underlying asset. Con: you own nothing, so no dividends-in-kind, no voting, no shares to hold long term.
Entry costPro: lower capital required than buying the asset outright.
Trading costsCon: spread, overnight holding costs, and sometimes commission.
RegulationCon: not available in some countries; restricted in others.
ComplexityCon: managing leveraged positions takes real understanding of markets and risk.
Counterparty riskCon: if the broker defaults, your positions are exposed.

Personally, the line I would underline is counterparty risk and leverage. A CFD is a contract with your broker, not a share you hold in your own name, so the broker’s health matters. And leverage is the single feature that turns a manageable mistake into an account-ending one. Respect it, or it will teach you the hard way.

CFD vs owning the shares: what is the difference?

A common question is how a CFD differs from just buying the stock. The core difference: with a CFD you own a contract that tracks the price, not the asset.

CFDOwning the shares
What you holdA contract with the brokerThe actual asset in your name
Capital requiredA margin deposit (a fraction of position size)The full value of the position
Short sellingEasy, built inHard or restricted for retail
LeverageYes, magnifies gains and lossesUsually no
Overnight costHolding cost charged dailyNone
Time horizon it suitsShort-term speculationLong-term investing
Counterparty riskYes, exposed to the brokerNo

The short version: CFDs are a tool for short-term, leveraged speculation. If your goal is to buy and hold for years, owning the asset is usually the cleaner choice.

Two worked examples

Numbers make this concrete. Here is one long trade and one short trade, costs excluded for clarity.

Long example (stocks). You think Apple will rise. You buy 100 CFD shares of Apple (AAPL) at $150. The price rises to $160, and you close.

  • Opening position: 100 shares x $150 = $15,000
  • Closing position: 100 shares x $160 = $16,000
  • Profit: $16,000 minus $15,000 = $1,000 (excluding costs)

Short example (commodities). You think gold will fall. You sell 10 CFDs of gold at $1,800 per ounce. The price drops to $1,750, and you close.

  • Opening position: 10 ounces x $1,800 = $18,000
  • Closing position: 10 ounces x $1,750 = $17,500
  • Profit: $18,000 minus $17,500 = $500 (excluding costs)

Side by side, so the long-vs-short mechanics are clear:

Long (Apple)Short (Gold)
Your viewPrice will risePrice will fall
Action to openBuy at $150Sell at $1,800
Action to closeSell at $160Buy at $1,750
Result+$1,000+$500

Notice the short trade: you sold first and bought back lower, and you still made money. That is the part new traders find counterintuitive, and it is exactly what CFDs make easy.

Where the human edge comes in

Leverage and one-click access to every market are now free. Any broker hands them to you on signup. What no platform hands you is the discipline to size a leveraged position so a single bad trade cannot end your account, or the judgment to skip a market you do not actually understand. The leverage is the easy part. Knowing how much of it to use, and when to use none at all, is the part worth learning. That is discipline and sizing, the second of the Five Edges no broker can supply for you.

FAQ

What is a CFD in simple terms?
A CFD (Contract for Difference) is an agreement with a broker to exchange the difference in an asset’s price between when you open and close the trade, without owning the asset. If the price moves your way you profit; if it moves against you, you lose.

Are CFDs good for beginners?
Generally no. CFDs use leverage, which magnifies losses as much as gains, so they are best suited to experienced traders who already have risk management in place. A beginner is better off learning position sizing and a tested system first.

Can you lose more than you invest with CFDs?
Yes. Because CFDs are leveraged, losses can exceed your initial deposit. This is why regulators impose leverage limits and require risk warnings, and why sizing matters more than the entry.

What is the difference between a CFD and buying the stock?
With a CFD you hold a contract that tracks the price, not the share itself. CFDs require less capital, allow easy shorting, and use leverage, but carry overnight costs and broker counterparty risk. Owning the stock suits long-term investing; CFDs suit short-term speculation.

What can you trade as CFDs?
Stocks, indices (like the S&P 500 and FTSE 100), forex pairs, commodities (gold, silver, oil), cryptocurrencies, and ETFs, all from a single account.


Now that you know how CFDs work, the question is not really “what is a CFD,” it is “how do I keep leverage from blowing me up.” That answer is the same in every market: a tested system and disciplined sizing. Which leads naturally to the next thing to learn.

If you want the full foundation, start with the pillar: The Beginner’s Guide to Trading.

Want a system that controls the risk for you? Grab the free 15-Minute Swing Trading Starter Kit. It’s the exact routine I use to scan once a day and trade any market in 15 minutes, with sizing baked in so leverage works for you, not against you.


About the author. Spencer Li is the founder of Synapse Trading and a Certified Financial Technician (CFTe) with 15+ years of trading across stocks, forex, crypto, commodities, and bonds. His trade log is public: every trade since April 2024, dated, losses left in. He has taught a 15-minute daily trading routine since 2014, one system for any market.

Education, not financial advice. Synapse Trading is not licensed by MAS to advise on investment products. Trading carries risk of loss, including the risk of losing more than your initial deposit with leveraged products; past performance is not indicative of future results.


Related

The Beginner’s Guide to Trading (pillar) · Leverage and margin explained · Long vs short selling · Forex trading basics

0 Comments/by Spencer Li
https://synapsetrading.com/wp-content/uploads/2024/06/thumbnail-CFDs-with-title.png 1024 1792 Spencer Li https://synapsetrading.com/wp-content/uploads/2019/10/logo.jpg Spencer Li2024-06-20 04:57:192026-10-05 12:10:25Understanding Contracts for Difference (CFDs)
Page 5 of 184«‹34567›»

Free Trading Guides

Free Trading Guides

Blog Categories

  • Beginner's Guide
  • Blockchain & Crypto
  • Book Summaries
  • Economics & News Trading
  • Investing & Portfolio Management
  • Living Your Best Life
  • Market Analysis
  • Markets & Products
  • News & Events
  • Promotions
  • Risk & Money Management
  • Stock Trading
  • Technical Analysis & Price Action
  • Testimonials
  • Tools & Resources
  • Trading Psychology
  • Trading Strategies
  • Trading Tips
  • Travel & Lifestyle

Free Trading Guides

Free Trading Guides

Contact Us

Synapse Trading Pte Ltd
Registration No. 201316168H

Whatsapp: +65-8897-1204
Telegram: @iamrecneps
Email: info@synapsetrading.com

Links

Disclaimer
Privacy policy
Terms & Conditions
Contact us
Partnerships

© 2012-2026 Synapse Trading | All rights reserved | - powered by Enfold WordPress Theme
  • Link to Facebook
  • Link to X
  • Link to Instagram
  • Link to Youtube
  • Link to LinkedIn
  • Link to Mail
Scroll to top Scroll to top Scroll to top