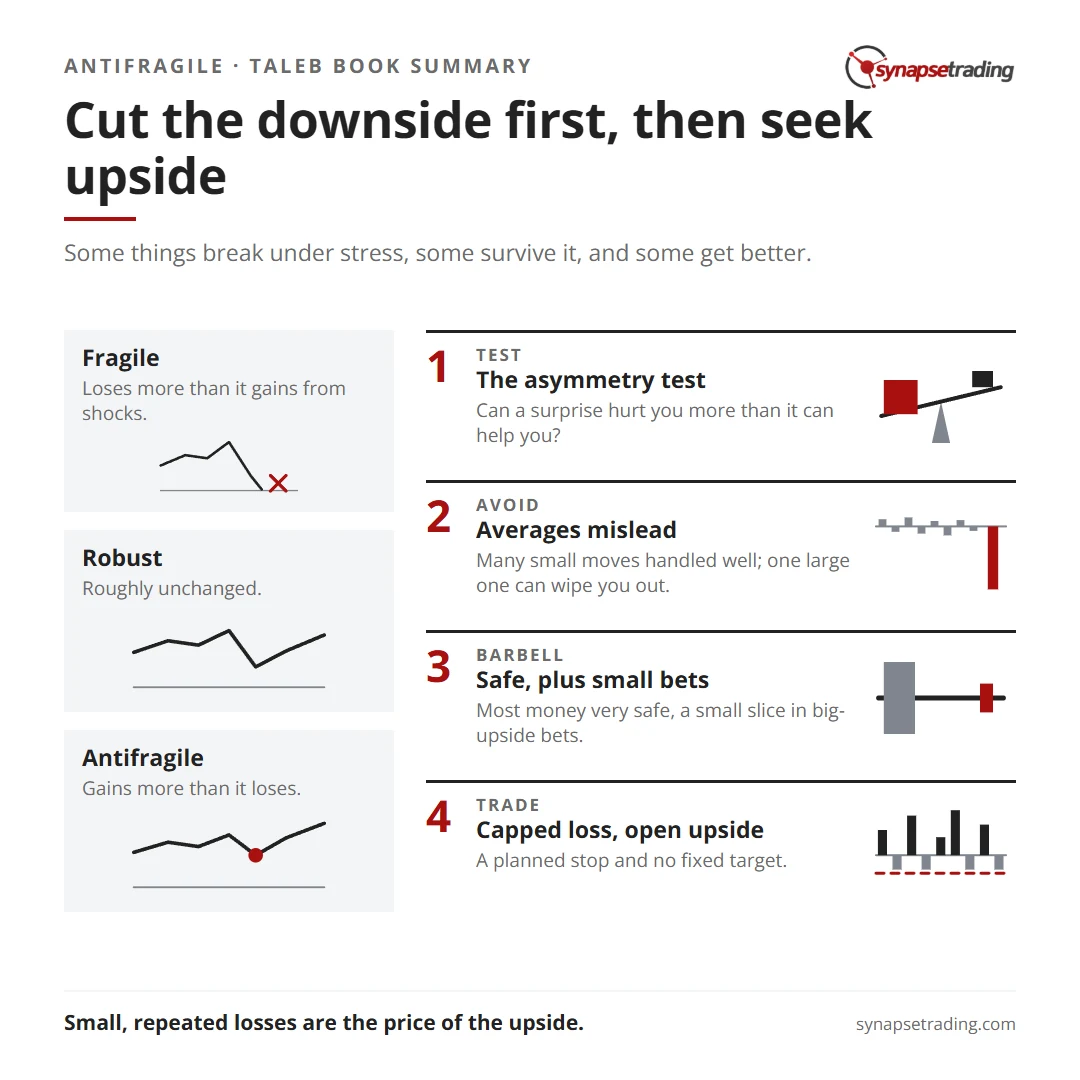
What is Antifragile about? Nassim Nicholas Taleb’s 2012 book argues that there are 3 kinds of things in the world, where most of us only see 2. Fragile things are harmed by shocks. Robust things shrug them off. And antifragile things actually gain from shocks, the way muscles grow back stronger after training.
His point is that you can tell which is which without predicting anything. You only need to look at the shape of the payoff. If a surprise can hurt you more than it can help you, you are fragile. If it can help you more than it can hurt you, you are antifragile.
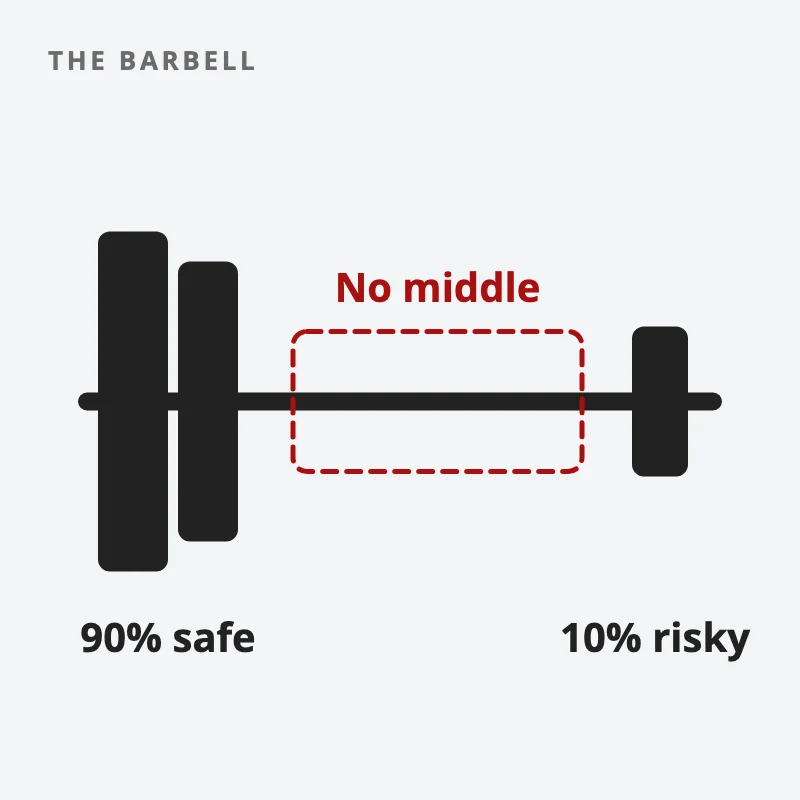
His most famous practical idea is the barbell: keep most of your money extremely safe, put a small slice into bets with large upside, and avoid the middle. This summary covers the triad, the barbell, and what each idea means for a trader.
Who is Nassim Nicholas Taleb?
Taleb is a former options trader and risk manager who turned to writing about uncertainty. Antifragile is the third book in his Incerto series, after Fooled by Randomness and The Black Swan. Our summary of The Black Swan covers the problem: rare events dominate, and nobody can forecast them. Antifragile is his answer to what to do about it.
Do note the style. Taleb calls the book an essay, and it moves by stories, polemics and examples more than by data. There is no backtest in it. It is best read for the way of thinking, with each idea tested against your own experience before you rely on it, since the book itself offers stories and arguments where a trader might expect evidence.
What is the difference between fragile, robust and antifragile?
The whole book hangs on this triad. Taleb defines the fragile as “what does not like volatility.” The robust is unharmed by it. And the antifragile goes one step further: in his framing, the resilient resists shocks and stays the same, while the antifragile gets better.
His mythological picture makes it easy to remember. Damocles, with a sword hanging over him by a single hair, is fragile. The Phoenix, which always rises back to where it was, is robust. The Hydra, which grows 2 heads for every 1 cut off, is antifragile.
Category
How it reacts to shocks
Taleb’s image
A trading example
Fragile
Loses more than it gains
Damocles
A leveraged account with no stop
Robust
Roughly unchanged
Phoenix
A small, diversified position held with a planned stop
Antifragile
Gains more than it loses
Hydra
A position with a capped loss and open upside
His test fits in one line. Fragility and antifragility can almost always be spotted “using a simple test of asymmetry.” More downside than upside from a random event means fragile. More upside than downside means antifragile.
And his favourite image sums up the whole book in 8 words: “The glass on the table is short volatility.” Left alone, it is fine. Any shock can only hurt it.
Why does fragility hurt more than you expect?
Because harm to a fragile thing grows faster than the shock. Taleb’s example is a car. Driving into a wall once at 50 mph does far more than 10 times the damage of driving into it 10 times at 5 mph.
That is why averages mislead. A portfolio that handles a lot of small moves well can still be wiped out by 1 large one. Taleb’s folk version: “Do not cross a river if it is on average four feet deep.”
He is also blunt about borrowing: “Debt always puts you on the left.” The left, in his language, is the side of the distribution where the losses live. Debt removes your ability to wait out a shock, because the lender can demand repayment or more margin at exactly the moment prices are lowest, which turns a bad day into a forced sale. Our post on how much leverage a beginner should use looks at the same problem from a trader’s side.
If you want a short daily routine that keeps your downside planned before every trade, our free 15-Minute Swing Trader’s Checklist covers it. Get the free checklist →
What is Taleb’s barbell strategy?
A trader asked on an investing forum: ‘Can someone please ELI5 the concept of “barbell investing”?’ Here it is in plain words.
Taleb’s example is to put 90 percent of your money in something boring and safe, such as cash protected from inflation, and 10 percent in maximally risky bets. Your worst case is then a loss of about 10%. Your best case is open. He compares it with putting everything in “medium” risk assets, which he calls a “sucker game,” because medium risks are exactly the ones people measure badly.
Taleb’s barbell keeps most money very safe and a small slice in big-upside bets.
Two things about the barbell often get lost.
The 90/10 is one example, nothing more. Taleb introduces it as “an example from vulgar finance,” and gives no derivation of those numbers anywhere in the book. The idea is the shape: extreme safety on one side, small bets with large upside on the other, and nothing in the fragile middle.
The safe side comes first. Taleb says the first step toward antifragility is cutting the downside, and that this is a requirement, before any thought about increasing the upside. Survival comes before success. If the safe side is not truly safe, there is no barbell.
That gives a simple check to run before any trade or investment, in 3 questions. What is my worst case, and is it capped? Would a shock twice as big hurt me more than twice as much? And does surprise help me, or only calm?
How do options and optionality fit in?
Taleb tells the story of Thales, the Greek philosopher, who paid small deposits in winter for the right to use every olive press in the area. When the harvest came in large, he rented them out on his own terms. Taleb calls this “the very first option on record”: “the right but not the obligation.”
His point is that you do not need to predict well if your payoff is lopsided. The size of the win when you are right “makes it unnecessary to be right too often.” And many of the best options in life, he says, cost nothing: “most interesting options are free, or at the worst, cheap.”
For a trader, the parallel is direct. A trade with a planned stop and no fixed target has a capped loss and an open upside. That is the payoff shape Taleb prefers. It is also why trend following can make money with a win rate below 50%.
The reverse shape is selling options for steady income. Taleb calls payoffs like that “bounded right”: limited gains, with the losses open on the left. Our post on the real risk of selling covered calls shows how that plays out.
What does Antifragile mean for traders?
Three ideas carry over directly.
Track records lie in both directions. Taleb argues that for fragile strategies, like selling insurance, a short track record looks better than the truth, because the rare disaster has not happened yet. For antifragile strategies, a short record looks worse than the truth, because the rare big win has not happened yet. So a smooth equity curve can be the most dangerous one to trust.
Robust across conditions beats tuned for one. In our Black Swan summary, I wrote that “a method built to perform only in calm conditions is fragile by definition.” A system tuned to last month’s market is short volatility, like the glass on the table.
Small, repeated losses are the price of the upside. A stop that costs a little, often, is what keeps the left side capped. That is the trader’s version of the barbell.
Antifragile reads best as a risk book more than an investing book. It does not tell you what to buy. It tells you what to check before you buy anything. For more on that, see our guide to money and risk management.
Concluding thoughts
Antifragile is long, opinionated and sometimes repetitive. But its core test fits in a sentence: does a shock help you or hurt you more? And its core rule is short: cut the downside first.
Do note one tension the book leaves open. In one chapter Taleb argues for spreading bets thinly across many small positions. In another he argues for the barbell’s heavy concentration in safety. Both can be useful, as long as you know which one you are using and why.
So, on your current positions, which side of the triad are you on? If the market gapped hard against you tomorrow, would you lose more than you planned?
FAQ
What is the main idea of Antifragile?
Some things gain from shocks and disorder, beyond simply surviving them. Taleb calls them antifragile, and says you can spot them by checking whether a surprise would help or hurt you more.
What is the barbell strategy?
Taleb’s example is about 90% in very safe assets and 10% in high-risk, high-upside bets, with nothing in the middle. He presents the 90/10 as an illustration, without a formula behind it.
What is the difference between robust and antifragile?
A robust thing resists shocks and stays the same. An antifragile thing gets better from them. Taleb says the resilient resists while the antifragile improves.
Should I read The Black Swan or Antifragile first?
The Black Swan first. It explains the problem of rare, unpredictable events. Antifragile then explains how to position yourself so those events help you or at least cannot ruin you.
How does Antifragile apply to trading?
It points to a capped downside on every position, care with debt and leverage, and trades where the possible gain is much larger than the planned loss. Strategies with smooth returns and hidden tail risk deserve extra suspicion.
Go deeper
A capped downside starts with a plan you write before you trade. The free 15-Minute Swing Trader’s Checklist has the daily routine, the questions to ask before every trade, and the five rules that protect your account.
About the author. Spencer Li is The 15-Minute Trader and the founder of Synapse Trading. He is a Certified Financial Technician (CFTe) with 15+ years of trading, run from 70+ countries. He holds a B.Acc and B.BM from SMU. Every trade he takes is public, dated, losses left in. He teaches rules-based swing trading in 15 minutes a day, one system for any market.
Educational content only, not personalised financial advice. Trading carries risk, including loss of capital. Past performance is not indicative of future results. Synapse Trading is not licensed or regulated by MAS.
https://synapsetrading.com/wp-content/uploads/2026/10/antifragile-nassim-taleb-card.webp6301200Spencer Lihttps://synapsetrading.com/wp-content/uploads/2026/10/synapse-logo-horizontal-light.pngSpencer Li2026-09-09 09:34:142026-10-27 17:06:29Antifragile Summary: Nassim Taleb on Gaining From Disorder, and the Barbell
Last updated: 30 September 2026 · By Spencer Li, CFTe
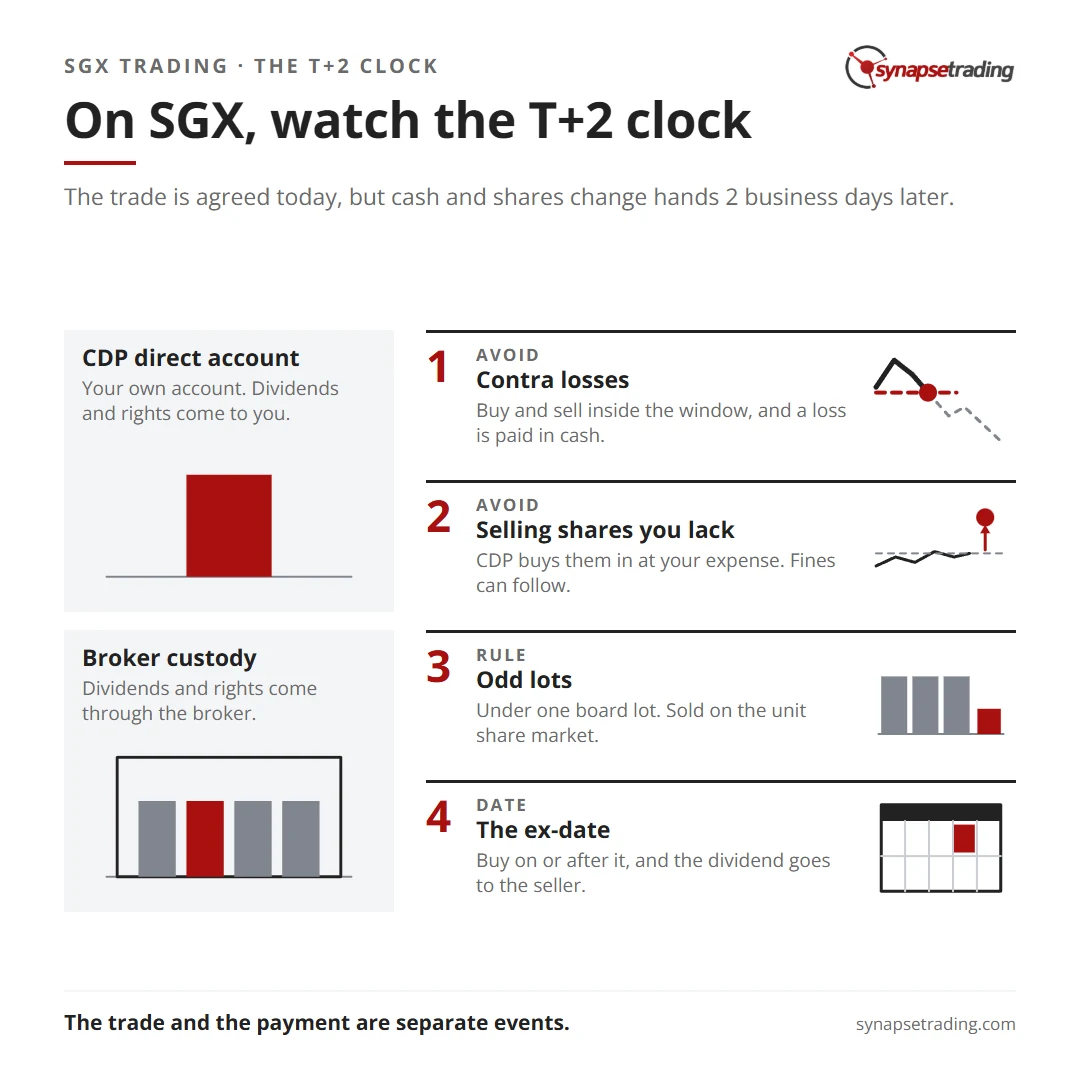
When you buy a share on SGX, 2 things happen on 2 different days. The trade is agreed the moment your order fills. The shares and the cash only change hands 2 business days later, which SGX calls T+2. Almost every confusing word in Singapore stock trading, from CDP to contra to buying-in, lives in the gap between those 2 days.
In short, your shares sit either in your own CDP account at the Central Depository, or in a custody account with your broker. Contra trading is buying and selling the same stock inside that 2-day window, so only the difference is settled. An odd lot is any quantity smaller than a board lot, and it trades on SGX’s separate unit share market. Corporate actions are what the company does to your shares, such as paying a dividend or offering rights, and what you get depends on what sits in your account on the record date.
2 of these changed in 2026, so much of what you will find online is already out of date.
Where do your SGX shares actually sit?
In one of 2 places: a CDP direct account, or a custody account run by your broker.
The CDP Depository Rules say CDP opens a “Direct Securities Account for an individual or corporation which holds the Deposited Securities beneficially for his or its own account.” You get one, because “A person shall not have more than one Direct Securities Account”. CDP sends a statement each month you trade, and a holdings statement at least every 6 months.
The second route is growing fast. In its 1 July 2026 release, SGX said “six such accounts opened for every direct account opened with CDP over the period from October 2024 to April 2026”, meaning broker custody accounts. From 15 July 2026, depository agents may also hold SGX shares for clients “in omnibus broker custody accounts”, the model most overseas markets already use.
Does the choice matter? Mostly when the company does something. In a direct account, the dividend, the rights offer and the meeting notice come to you. In a custody account they come through the broker. SGX said it will bring in “minimum service standards for brokers and depository agents to facilitate the exercise of shareholder rights”, covering “handling of corporate actions and assisting attendance at shareholder meetings”, by the end of 2026. Personally, I would ask any broker how it handles a rights issue before parking a long-term holding there.
What does T+2 mean for your cash?
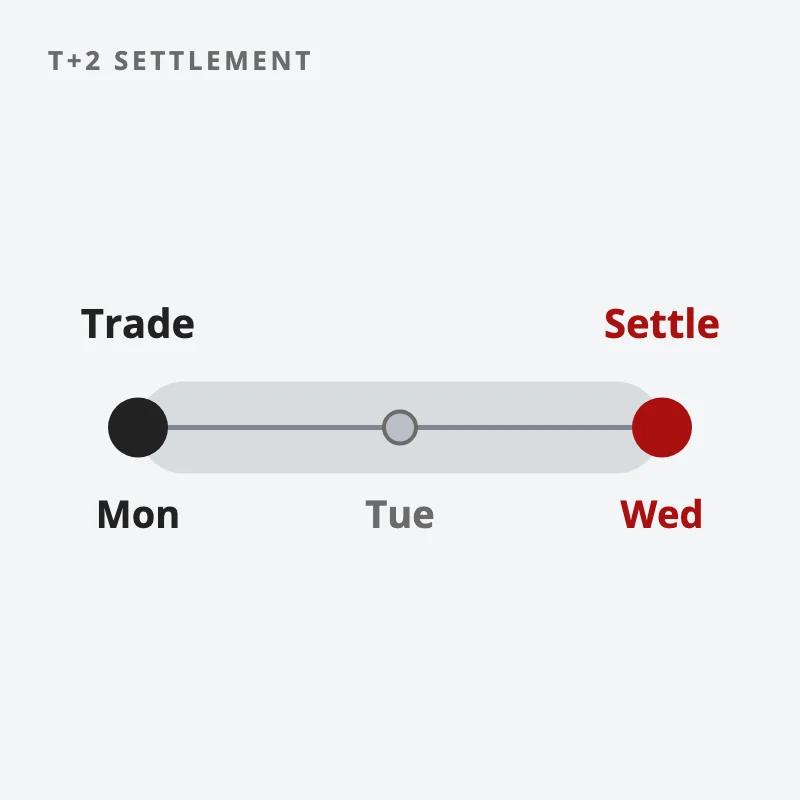
T+2 means the trade settles 2 business days after the trade date. SGX moved to it on 10 December 2018. Its FAQ gives the example of a Monday trade with no holiday in between: “the settlement date will be Wednesday.”
Buy on Monday and the cash is due on Wednesday. Sell on Monday and the shares are due on Wednesday. Every term below describes what happens when one side of that does not turn up on time, which is why I call this the T+2 clock. Once you can see the clock, contra, buying-in and the ex-date all make sense on their own.
On SGX the trade is agreed today, but cash and shares change hands 2 business days later.
What is contra trading, and how does a contra loss happen?
Contra trading is buying and selling the same stock inside the settlement window, so only the difference is paid. A 2014 MAS and SGX consultation paper listed 3 features. First, “customers do not have to put up any collateral for their trades.” Second, a buy on trade day T “is offset by a sale transaction of the same security within the settlement cycle”. Third, “the offsetting trades are settled on a net basis.” The paper was written when the cycle was T+3. Today it is T+2.
The same paper found that “about 31% of total trading value on SGX is due to contra trading” between October 2012 and October 2013.
Here is a contra loss, with hypothetical numbers. You buy SGD 10,000 of a stock on Monday without that cash in your account. By Tuesday it has fallen 4%, and you sell. You never pay the SGD 10,000. You do pay the difference, which is about 4% of the position plus 2 sets of fees, in cash, by the deadline your broker sets.
Had it risen 4%, you would collect a contra gain. That appeal is also the problem. You controlled SGD 10,000 of stock with nothing down, so a 10% gap on bad news costs you 10% of a sum you never had.
A new investor on r/askSingapore hit this in April 2025, after an order filled with too little cash in the account. “I got no idea what the meaning of sell contra… pls help… afraid will affect my existing shares”. The position must be paid for or sold, and your broker’s terms decide what happens if neither is done. Read them before the first contra trade.
If you want a daily routine that keeps each trade inside a plan, the free 15-Minute Swing Trader’s Checklist is at the end of this post.
What happens if you sell shares you do not have?
CDP buys them for you, at your expense. That process is called buying-in.
MAS’s Guidelines on the Regulation of Short Selling describe it. CDP buys “securities on behalf of sellers who do not possess securities for delivery on settlement day”. Then “the cost of purchase and an additional penalty is charged to the seller who failed to deliver the securities.” Under CDP Clearing Rule 6.7.4, the buying-in bid is set at “2 minimum bids above the highest of” the previous close and the recent traded and bid prices. So you buy back above the market, by design.
Then come the fines. Clearing Rule 6.7A.1 lets CDP fine the clearing member “$1,000 or 5% of the contract value of the undelivered securities (whichever is higher)”, rising to “$5,000 or 10%” if a trade from the buying-in market also fails. SGX’s FAQ adds that “The Clearing Member may pass on the charges and penalties to the customers that fail to deliver.” On a small trade, the minimum fine can dwarf any profit you hoped for.
What is a board lot, and what changed in October 2026?
A board lot is the standard trading unit on SGX. SGX cut it from 1,000 units to 100 on 19 January 2015, saying a smaller lot would “make it more affordable for retail investors to invest in a wider range of equities, including blue chips”.
It changed again this year. From 5 October 2026, the lot went “From 100 units to 10 units for instruments priced above $10 and up to $100”. Above SGD 100 it went “From 100 units to 1 unit”. The first round covered 11 stocks priced above SGD 10, which SGX said made up 35% of trading activity in the first half of 2026.
A hypothetical stock at SGD 40 used to need 100 shares, so SGD 4,000, for one lot. At 10 shares a lot, the minimum is SGD 400.
Share price (hypothetical)
Board lot before 5 Oct 2026
Board lot once SGX moves the stock
Smallest board-lot purchase after
SGD 5
100
100 (no change)
SGD 500
SGD 40
100
10
SGD 400
SGD 150
100
1
SGD 150
A stock only moves to the smaller lot when SGX’s quarterly review adds it, and the next review is in January 2027. And SGX said “Board lot size reductions will remain even if stocks fall below the $10 and $100 thresholds.”
How do you buy or sell an odd lot?
On the unit share market. SGX’s rules define it as “The securities market operated by SGX-ST in which an order may be matched in any quantity of less than one board lot.”
Odd lots usually arrive by accident. A rights issue or a share consolidation can leave you with 37 shares of a stock that trades in lots of 100. The unit share market is thinner, so the spread can be wider, and a minimum fee is a bigger slice of a small trade.
For stocks with a 1-unit lot, the problem disappears, because every quantity is a full lot.
How do dividends, rights and other corporate actions reach you?
Through your account. Whoever holds the shares on the company’s record date gets the entitlement. Because a trade takes 2 business days to settle, the shares start trading “ex” before the record date. Buy on or after the ex-date, and the dividend goes to the seller.
Corporate action
What happens
What to watch
Cash dividend
Cash paid to holders on the record date
IRAS treats one-tier dividends from Singapore companies as “generally” not taxable for individuals
Scrip dividend
You may elect new shares in place of the cash
On the SGX notice template, “the default payment is in cash”
Rights issue
You are offered new shares in proportion to what you hold
Miss the deadline and your share of the company shrinks
Bonus issue
Extra shares at no cost, and the price adjusts down
Can leave you with an odd lot
Share consolidation
Several shares become one, and the price adjusts up
Can leave you with an odd lot
A scrip election, a rights subscription or a takeover acceptance needs your instruction before a deadline. Direct account holders can file some on the SGX Investor Portal, and custody holders go through the broker. How a dividend from a foreign stock is taxed is a separate question, covered in the post on tax and trading profits.
So which of these should you actually worry about?
The T+2 clock. Everything in this post is a rule about what happens inside those 2 business days, and almost every costly surprise comes from forgetting that the trade and the payment are separate events. A contra loss is a bill that arrives before you have decided anything. A buying-in fine is the price of selling shares that were never in the account. A missed dividend is a purchase made 1 day too late.
So, do you know which kind of account your shares sit in today, and what your broker does when a rights offer lands?
FAQ
What is contra trading in Singapore?
Contra trading is buying and selling the same SGX stock within the T+2 settlement window, so only the price difference is settled. A contra loss must be paid in cash, plus fees.
How long is the SGX contra period?
Trades on SGX settle 2 business days after the trade date (T+2), the cycle SGX has used since 10 December 2018. Your broker’s own terms set the exact deadline for paying a contra loss.
Do I need a CDP account to buy Singapore shares?
No. You can hold SGX shares in a CDP direct account in your own name, or in a custody account with a broker. SGX said in July 2026 that broker custody accounts were being opened at about 6 for every new CDP direct account.
How do I sell odd lot shares in Singapore?
Odd lots trade on SGX’s unit share market, which matches orders of less than one board lot. Spreads there are often wider, so check the bid and ask before you sell.
Go deeper
The free 15-Minute Swing Trader’s Checklist has the daily routine, the questions to ask before every trade, and the five rules that keep you in the game.
About the author. Spencer Li is The 15-Minute Trader and the founder of Synapse Trading. He is a Certified Financial Technician (CFTe) with 15+ years of trading, run from 70+ countries. He holds a B.Acc and B.BM from SMU. Every trade he takes is public, dated, losses left in. He teaches rules-based swing trading in 15 minutes a day, one system for any market.
Educational content only, not personalised financial advice. Trading carries risk, including loss of capital. Past performance is not indicative of future results. Synapse Trading is not licensed or regulated by MAS.
Selling options for income, and what the monthly number leaves out
Last updated: 5 October 2026 · By Spencer Li, CFTe
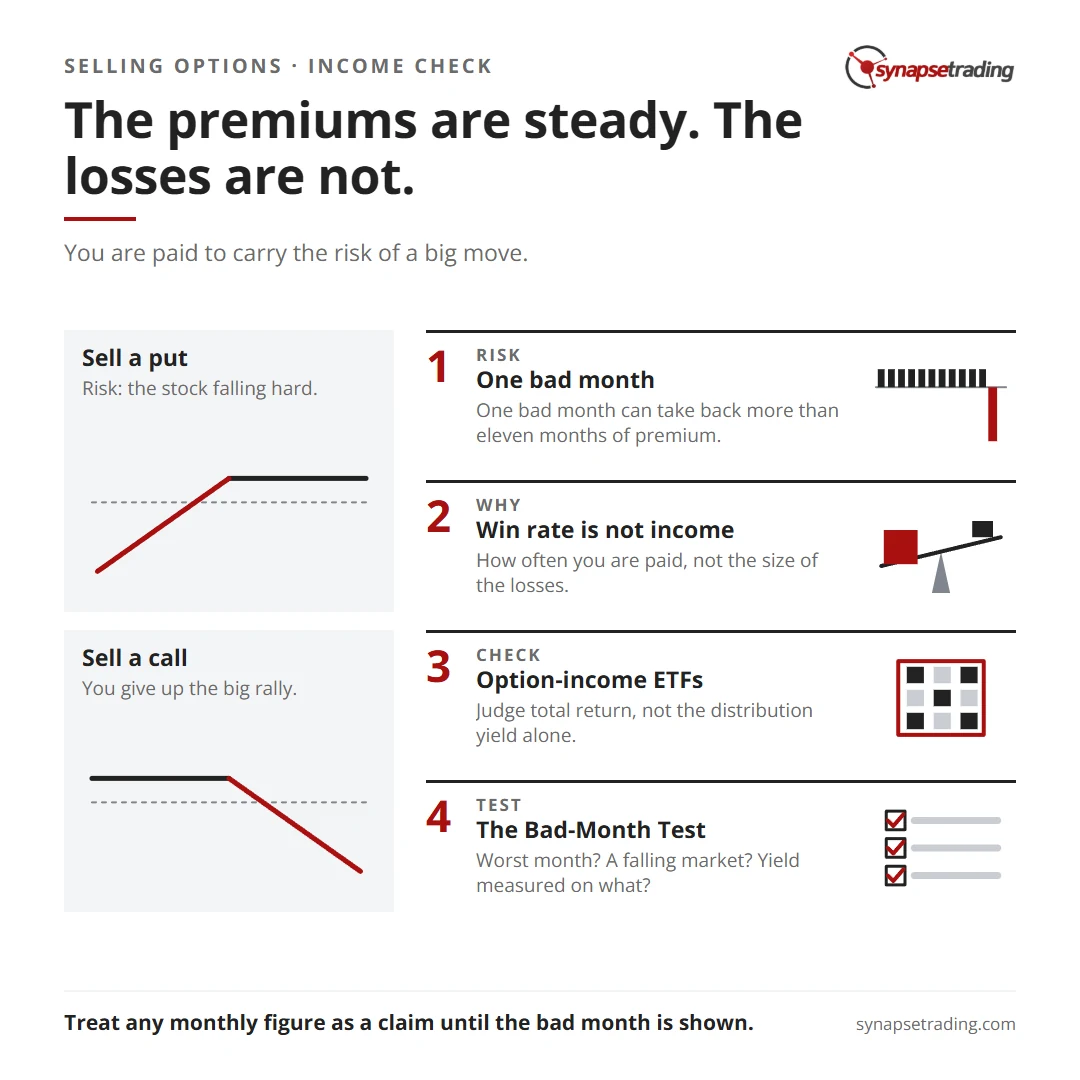
Selling options can collect small premiums month after month while markets are calm. Whether that adds up to a steady monthly income is a different question, and nobody can promise it. The premiums are steady. The losses are not.
When you sell an option, you are paid to carry the risk of a big move. Most months the big move does not come, and you keep the premium. In the month it does, a single loss can take back many months of premium at once. So a monthly figure on its own tells you almost nothing about what selling options for income will actually pay. It only means something with the worst month printed beside it.
That is the whole post in one line, and the rest is the arithmetic, the evidence and a simple check you can run on any income claim. I will call the check the Bad-Month Test.
Where does the premium come from?
Think about the travel insurance you buy before a holiday. You pay a small amount, you almost never claim, and the insurer keeps most of what you paid. That is a good business for the insurer, until the year a volcano closes every airport in the region and the claims arrive all at once.
An option seller is the insurer. The buyer of a put is paying you to carry the risk of the stock falling hard. The buyer of a call is paying you to give up the big rally. Either way, the premium is the price of a risk you agreed to hold, and the market sets that price to cover the bad months on average, over time.
So the premium is real, and it is also a payment for something. That something shows up eventually.
What do small wins and rare losses add up to?
Let’s put numbers on it, with one hypothetical example. The figures are made up to keep the arithmetic easy, and they are not what any strategy pays.
Say you sell a cash-secured put every month on the same stock, about 10% below the current price, and collect 1.5% of the cash you set aside each time. For 11 months the stock stays above the strike and every put expires. In month 12, bad results come out and the stock falls about 32%, to 34 against your strike of 45.
Months
What happens
Result on the cash set aside
1 to 11
each put expires, premium kept
+1.5% a month, +16.5% in total
12
assigned at 45, shares worth 34, premium kept
about −22.9%
The year
11 good months, 1 bad one
about −6.4%
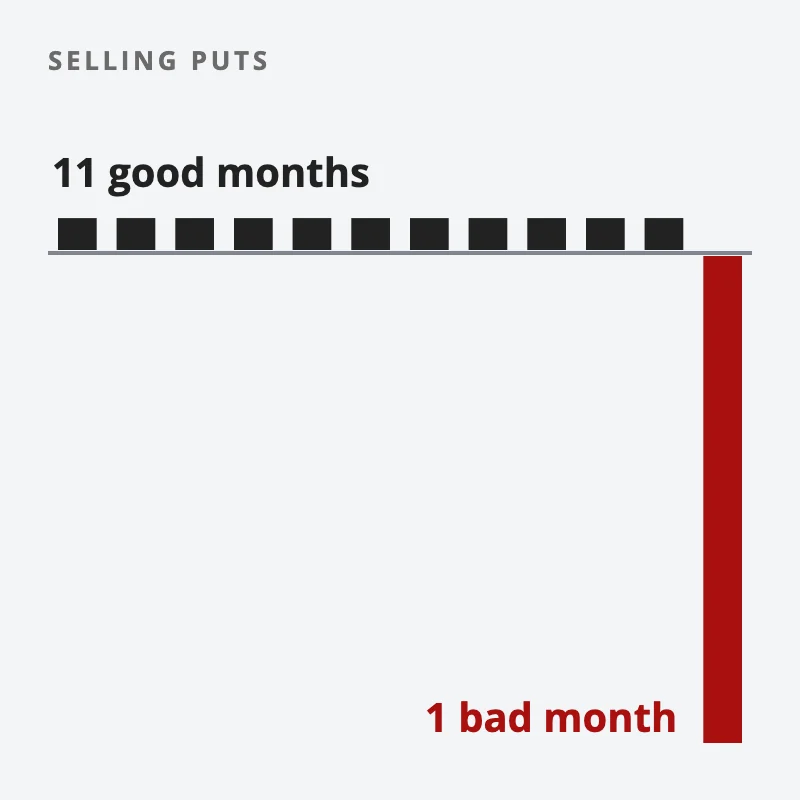
Look at the 2 numbers in collision. Eleven months of income that felt steady, and one month that cost 15 months of premium. The average month in that year was a loss, even though 92% of the months paid.
One bad month can take back more than eleven months of steady premium.
And notice what the monthly statement looked like for 11 straight months. Smooth, green and reassuring. Anyone who stopped counting at month 11 would have called it a steady income. That is the problem with judging this strategy by its good months, because the good months are the ones you see most of.
What do traders who tried it report?
The question comes up constantly. In the r/thetagang forum, which exists for option sellers, one thread asks it directly: “Anyone actually living abroad off CSP/wheel income consistently?” CSP there means cash-secured puts.
The evidence people post is mixed, and most of it is self-reported. A retail backtest on r/options in September 2026 ran 42 option strategies on 3 big US index ETFs from 2020 to 2025, each held for 10 trading days. Bull put spreads, a common income structure, won 70.4% of the time and averaged slightly below zero after costs. Selling cash-secured puts won 74.1% of the time, and its worst single trade lost about 20% of the ETF’s value. Another trader logged 60 index iron condor fills in March 2026 and wrote that his “actual returns were consistently coming in 15-20% below what my model projected”, because the fills on a multi-leg order are worse than the price on the screen.
None of this proves that option selling cannot work. It shows that a high win rate and a positive income are 2 different things, and that the gap between them is made of the rare large loss plus the costs.
If you want the routine for the trades we do teach, the free 15-Minute Swing Trader’s Checklist is at the end of this post.
What about option-income ETFs?
These funds sell options on a basket of shares or an index, and pay out the premiums as regular distributions. Some advertise a distribution yield that looks very generous.
A distribution is not the same as a return, though. The figure that matters is the total return, which is the change in the fund’s price plus everything it paid out. If the price falls while the payouts continue, part of what you received was your own capital coming back to you. Funds like this do report part of a payout as exactly that, a return of capital. One covered-call fund’s own notice for September 2026 estimated all of that month’s payout as return of capital. (Tax on the payouts, for a Singapore investor holding a US-listed fund, is a separate matter that this post does not cover.)
So the fund gets the same check as the strategy: what happened in the bad months, and what was left after them.
How do you check a monthly income claim?
Here is the Bad-Month Test. It is 3 questions, and they work on a YouTube channel, a course page, a fund factsheet or a friend at dinner.
What was the worst month, and the deepest drawdown, printed beside the average? An average with no worst month beside it is half a number.
Does the record run through a falling market? A record built only in rising months has not met its bad month yet.
What is the yield measured on? A yield on the full cash the trade could cost is one thing. A yield on the margin the broker asked for is the same trade with leverage on top, and it fails much faster.
Treat any monthly figure as a claim until the bad month is shown beside it. That says nothing about whether option selling is good or bad as a strategy. It says the income framing hides the very number that decides it.
So, back to the r/thetagang question, whether anyone lives abroad off this consistently. Maybe. But the reply worth having is the one that comes with the Bad-Month Test answered, and that is the reply to ask for.
FAQ
Can selling options pay a steady monthly income?
It can collect small premiums in most calm months, but the losses arrive rarely and in size, so the total is not steady. Any monthly figure needs the worst month and the drawdown beside it before it means anything.
Is selling options for income safe?
No strategy that carries the downside of a stock is safe. Selling a put or a covered call collects a premium in exchange for holding that downside, and one large fall can cost many months of premium.
Why does selling options have such a high win rate?
Because most options expire without the big move they insure against, so the seller keeps the premium most of the time. The win rate measures how often you are paid, and it says nothing about the size of the losses.
Are option-income ETFs a good source of monthly income?
Judge them on total return, the price change plus the payouts, and not on the distribution yield alone. Part of a payout can be your own capital coming back to you.
How much do you need to sell options for income?
For a cash-secured put, 100 times the strike price for each contract. Using margin instead lowers the cash needed and raises the risk.
Does Synapse Trading teach option selling?
No, we do not teach options at the moment. We teach end-of-day swing trading in shares, forex and ETFs, with the same rule that applies here, which is to judge any method by its losing stretch as well as its average.
Go deeper
The Bad-Month Test is the same habit that keeps a swing trader honest about any system, and the swing-trading side is the part we do teach. The free 15-Minute Swing Trader’s Checklist has the daily routine, the questions to ask before every trade, and the five rules that keep you in the game.
About the author. Spencer Li is The 15-Minute Trader and the founder of Synapse Trading. He is a Certified Financial Technician (CFTe) with 15+ years of trading, run from 70+ countries. He holds a B.Acc and B.BM from SMU. Every trade he takes is public, dated, losses left in. He teaches rules-based swing trading in 15 minutes a day, one system for any market.
Educational content only, not personalised financial advice. Trading carries risk, including loss of capital, and isn’t suitable for everyone. Past performance is not indicative of future results. Synapse Trading is not licensed or regulated by MAS.
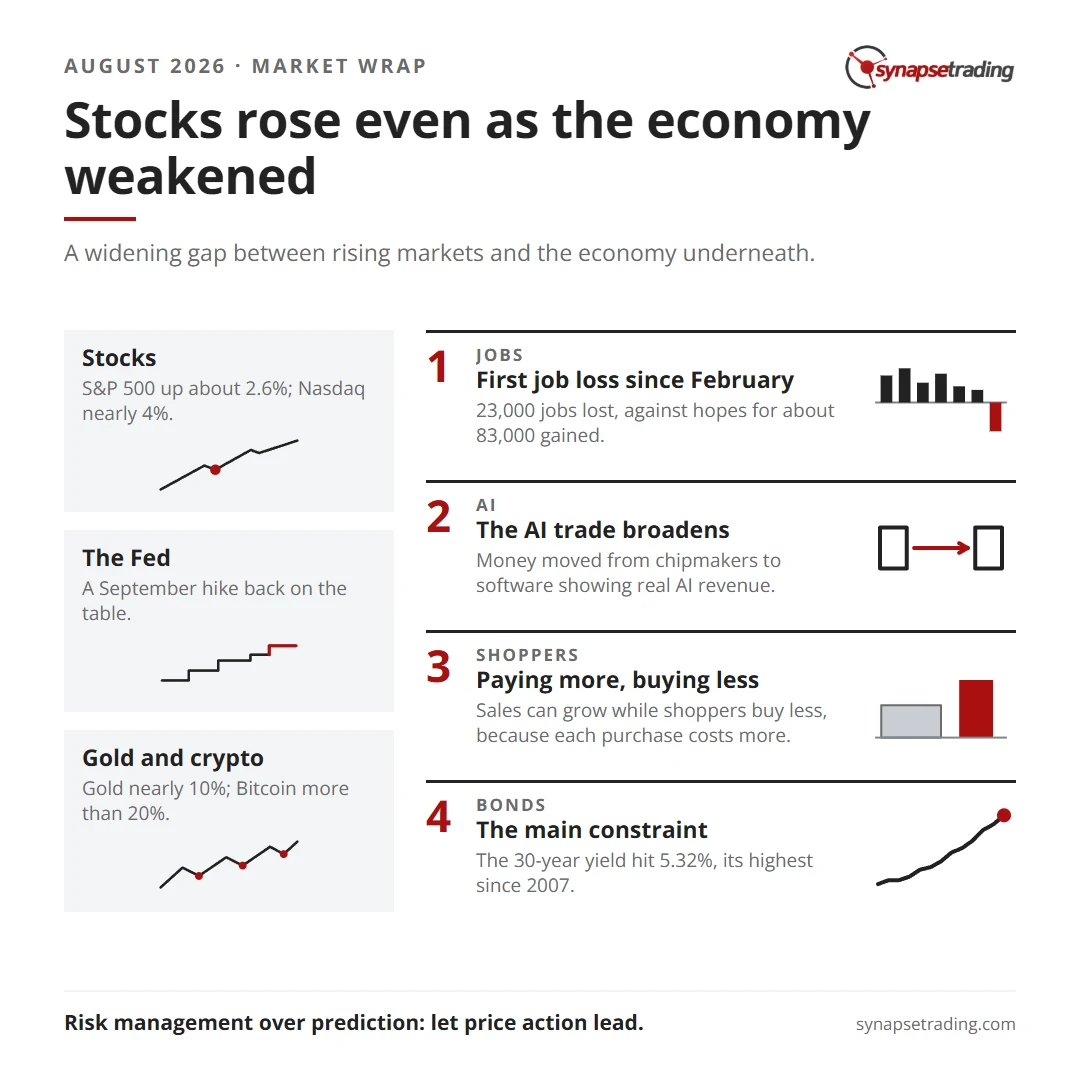
August 2026 presented investors with an unusually contradictory market environment. U.S. equities continued to advance despite weakening labor-market conditions, elevated long-term Treasury yields, persistent inflation pressure, and an increasingly hawkish Federal Reserve. The S&P 500 gained approximately 2.6% during the month and the Nasdaq Composite rose close to 4%, while the Dow Jones Industrial Average recorded its fifth consecutive monthly gain.
Beneath the headline strength, however, volatility remained elevated across asset classes. The United States reported its first monthly job loss since February, Federal Reserve Chairman Kevin Warsh placed a September rate hike firmly back on the table, Brent crude traded between approximately $79 and $94 as tensions with Iran intensified, and Bitcoin surged more than 20% in its strongest monthly performance in over a year.
The central theme of August was therefore not simply risk-on sentiment, but the market’s willingness to look through deteriorating macroeconomic indicators while continuing to reward specific sectors and companies capable of delivering earnings growth. At the same time, the sharp rise in long-term global bond yields created an increasingly restrictive financial backdrop that investors will have to confront heading into September.
1. Global Equity Markets: Rallying Through Macro Uncertainty
U.S. equities spent August climbing what was effectively a wall of worry. The month began with a broad rally as investors reacted positively to hopes that the Strait of Hormuz might eventually reopen. The Dow Jones Industrial Average recorded record closing levels across three consecutive sessions during the first week of August.
The rally accelerated following the release of cooler inflation data. On 13 August, the S&P 500 moved above the 7,800 level for the first time in its history, reaching an intraday record before closing at 7,798.99.
Momentum weakened during the middle of the month as the 30-year U.S. Treasury yield climbed above 5.3%, its highest level since 2007. The move forced investors to reassess whether equity valuations could continue expanding while long-term borrowing costs remained historically elevated.
Sentiment improved again during the final week following Nvidia’s earnings announcement. The reaction was notable not only because Nvidia itself rallied sharply, but because capital rotated into software and cybersecurity stocks, suggesting that investors were beginning to broaden the artificial-intelligence trade beyond semiconductor infrastructure.
Table 1: Major Equity Market Performance (August 2026)
Index / Market
August Closing Level
Monthly Change
Primary Market Driver
S&P 500
7,686
Approx. +2.6%
AI earnings strength and resilient risk appetite
Nasdaq Composite
26,371
Nearly +4%
Technology, software and AI-related gains
Dow Jones Industrial Average
53,186
Just over +1%
Fifth consecutive positive month
STOXX Europe 600
Record near 660 before retreat
Mixed
Higher European bond yields
South Korea Kospi
Highly volatile
Mixed
Semiconductor boom and shareholder-return announcements
Japan Nikkei 225
Broadly sideways
Mixed
Rising Japanese government bond yields
Sector leadership was unusual for an advancing market. Energy was the strongest major U.S. sector, gaining approximately 12% as crude oil prices rose on geopolitical tensions. Financial stocks followed with gains of around 6%, benefiting from higher yields and expectations that interest rates could remain elevated.
International markets were more mixed. The STOXX Europe 600 briefly reached a record near 660 early in the month before declining across five consecutive sessions as European bond yields increased.
South Korea experienced particularly extreme volatility. The Kospi surged 5.9% in a single session after SK Hynix announced a 40 trillion won share buyback, only to fall 3.1% several days later after Samsung failed to meet investor expectations for additional shareholder returns. The Bank of Korea also raised its policy rate to 3.00%, marking its first back-to-back rate increase since 2023.
2. U.S. Labor Market Weakness and the Federal Reserve Policy Dilemma
The macroeconomic story of August unfolded in three distinct stages: weakening employment, moderating inflation, and then a renewed hawkish shift from the Federal Reserve.
The Labor Market Cracks
July payroll data released on 7 August showed the U.S. economy losing 23,000 jobs, dramatically below expectations for an increase of approximately 83,000. It represented the first outright monthly employment decline since February.
Financial markets initially interpreted the report as strongly dovish. Expectations for a September Federal Reserve rate hike fell from approximately 57% to around 44%, as investors assumed that weakening employment would discourage additional monetary tightening.
Inflation Provides Temporary Relief
Inflation data initially reinforced that interpretation. July headline CPI came in at 3.4%, broadly matching expectations, while core CPI was reported at 2.5%. Producer prices were flat on the month and the annual producer-price inflation rate declined from 5.5% to 4.7%.
However, other economic indicators pointed toward weakening consumer conditions. July retail sales fell 0.6%, representing the largest decline in approximately one year. University of Michigan consumer sentiment fell to 51.0, while Chicago PMI declined to 47.1, its weakest level of 2026.
Table 2: Key U.S. Macroeconomic Indicators (August 2026)
Indicator
Reported Value
Forecast / Previous
Market Implication
Nonfarm Payrolls
-23,000
+83,000 forecast
First monthly job contraction since February
Headline CPI
3.4%
In line with consensus
Inflation remained elevated but stable
Core CPI
2.5%
Broadly expected
Moderating underlying inflation
Producer Prices
Flat MoM / 4.7% YoY
5.5% previous annual rate
Reduced near-term inflation concern
Retail Sales
-0.6%
Weakest in around one year
Consumer spending deterioration
University of Michigan Sentiment
51.0
Lower
Weak household confidence
Chicago PMI
47.1
Below 50
Weakest reading of 2026
Core PCE
3.3%
Fourth consecutive month near this level
Persistent inflation pressure
3. Jackson Hole and the Federal Reserve’s Hawkish Reversal
The market’s dovish interpretation was overturned during the second half of August. Minutes from the July Federal Open Market Committee meeting showed officials voting 9-3 to maintain the federal funds rate at 3.50% to 3.75%, with three policymakers preferring an increase.
The decisive event came on 28 August, when Federal Reserve Chairman Kevin Warsh delivered his first Jackson Hole keynote. Warsh emphasized that policymakers still had “work to do” on inflation and argued that current financial conditions were “not restrictive.” He also suggested that traditional forward guidance had overstayed its usefulness.
Warsh specifically highlighted core PCE inflation, which had remained around 3.3% for four consecutive months. Markets reacted immediately. The two-year Treasury yield jumped 13 basis points during the session as investors rapidly rebuilt expectations for additional monetary tightening.
By the end of August, markets were assigning approximately a 60% probability to a Federal Reserve rate increase at the September meeting.
The resulting policy environment is particularly unusual. The Federal Reserve is considering tighter policy even as employment contracts and consumer indicators weaken. This combination introduces a genuine stagflationary risk: growth is slowing, but inflation remains sufficiently persistent to prevent policymakers from easing.
4. Geopolitical Risk: Iran, Hormuz and the Return of the Oil Premium
Geopolitical developments remained one of the dominant drivers of global markets throughout August. The situation surrounding Iran and the Strait of Hormuz progressed through three phases: optimism over a potential reopening, diplomatic stalemate, and renewed military escalation.
The month began with President Trump claiming that an agreement had been reached to reopen the Strait of Hormuz. Iranian authorities disputed that claim through multiple state channels. The existing ceasefire framework subsequently expired on 17 August without a final agreement.
Washington shifted toward additional economic pressure, including a naval blockade of Iranian ports and a sanctions package announced on 24 August under the name “Operation Economic Outcast.” Approximately 60 entities were reportedly covered, including secondary sanctions without an exemption for China.
Shipping activity through the Strait remained severely disrupted. At certain points during the month, only approximately eight vessels per day were transiting the waterway, compared with roughly 130 to 140 before the conflict.
Table 3: Oil and Geopolitical Market Developments (August 2026)
Event / Asset
August Level / Date
Market Impact
Brent Crude – Early August
Approx. $79
Initial optimism over Hormuz reopening
Brent Crude – Escalation Peak
Near $94 around 20 August
Renewed geopolitical risk premium
Brent Crude – Month End
$91.09
+3.4% on final trading day
Hormuz Vessel Traffic
As low as approx. 8 vessels/day
Severe disruption versus 130–140 pre-conflict
24 August Sanctions
Approx. 60 entities
Additional economic pressure on Iran
Final-Day Military Exchange
US strikes / Iranian missile response
Renewed direct conflict premium
Brent crude approached $94 per barrel around 20 August before retreating toward $88 when markets interpreted additional sanctions as a potential substitute for further military escalation.
The situation changed again on the final trading day of the month. U.S. forces struck Iranian rocket launchers on Larak Island, and Iran responded with missiles aimed at U.S. bases in Jordan. Brent crude jumped 3.4% to $91.09.
September therefore begins with a persistent geopolitical premium embedded in energy prices. Until shipping traffic through Hormuz returns to normal, the oil market is likely to remain highly sensitive to diplomatic and military developments.
5. Trade Policy and the Expansion of the U.S. Tariff Regime
Trade policy remained another source of inflationary pressure. A broad new U.S. tariff framework took effect on 1 August, introducing baseline tariffs of approximately 10% to 12.5% across roughly 60 trading partners, with substantially higher country-specific rates in selected cases.
Canada subsequently faced additional measures. The U.S. announced plans to impose 50% tariffs on Canadian automobiles, trucks, automotive parts and steel beginning in January 2027.
Prime Minister Mark Carney responded with retaliatory tariffs covering approximately C$27.6 billion of U.S. goods, scheduled to take effect on 8 September.
The expansion of tariffs adds another complication for central banks. Even if domestic demand continues to slow, higher import costs could prevent goods inflation from falling quickly enough to justify easier monetary policy.
6. Corporate Earnings: AI Leadership Broadens Beyond Semiconductors
Second-quarter corporate earnings remained strong at the headline level. S&P 500 earnings were tracking approximately 50% year-on-year growth according to FactSet, representing the strongest pace since 2021.
However, August demonstrated that beating analyst expectations alone was no longer sufficient. Investors increasingly differentiated between companies able to generate measurable AI-related revenue and companies whose valuations already reflected extremely optimistic assumptions.
Nvidia Remains the Central AI Bellwether
Nvidia reported revenue of $96.2 billion, more than double the previous year’s level and above expectations of approximately $92.2 billion. Earnings per share reached $2.22 compared with analyst expectations of $2.10.
Management guided the following quarter to approximately $108 billion in revenue, above consensus estimates near $104 billion.
The initial reaction was negative because Nvidia projected gross margins declining from approximately 75% toward 71% to 72% by year-end as memory costs increased.
The market reversed its interpretation the following session. Nvidia surged 8.7%, adding approximately $440 billion in market capitalization in a single trading day, the second-largest one-day increase in corporate market value on record. Nvidia’s market capitalization returned to above $5.5 trillion.
Table 4: Major Corporate Earnings and Stock Reactions (August 2026)
Company
Key Result / Development
Stock Reaction
Primary Theme
Nvidia
$96.2B revenue; $2.22 EPS; $108B guidance
+8.7% following earnings
AI demand remains strong despite margin pressure
Salesforce
$5.90 EPS vs $3.27 expected; Anthropic partnership expanded
+22%
AI monetisation in enterprise software
Okta
$805M revenue; $1.05 EPS; raised outlook
Approx. +28%
Cybersecurity rebound
CrowdStrike
Revenue +26% to $1.47B
Best day on record
Cybersecurity / AI revenue
Palantir
Revenue +93%; US commercial sales +149%
Nearly +30%
Rapid AI-driven commercial growth
AMD
$11.5B record revenue; data-center sales doubled
More than -8%
Valuation expectations too high
Marvell
$2.74B revenue, +37%; approx. $18B FY guidance
-8%
Selective semiconductor valuation pressure
Cisco
$17.3B record revenue; $9.3B AI orders
-8%
Strong numbers insufficient for hardware investors
The broader message was that the artificial-intelligence trade began to rotate away from the companies supplying computing infrastructure and toward companies capable of demonstrating actual AI-driven revenue growth.
Salesforce jumped 22%, Okta gained approximately 28%, CrowdStrike recorded its strongest session on record, and Palantir climbed nearly 30%. Software had previously been one of the market’s weakest groups, falling roughly 19% at one stage of the year, making the August reversal particularly significant.
Consumer-related earnings painted a less optimistic picture. Walmart reported adjusted earnings of $0.81 per share, above the $0.74 expected, but U.S. comparable sales increased only 2.6% compared with expectations of 3.7%.
Management noted that customers were increasingly trading off discretionary purchases against higher fuel costs. Walmart shares fell approximately 9%.
Target reported earnings of $4.11 per share against expectations of $2.33, while comparable sales increased 3.8%. However, almost $1 billion of tariff refunds contributed to the result, reducing the quality of the earnings beat in investors’ eyes.
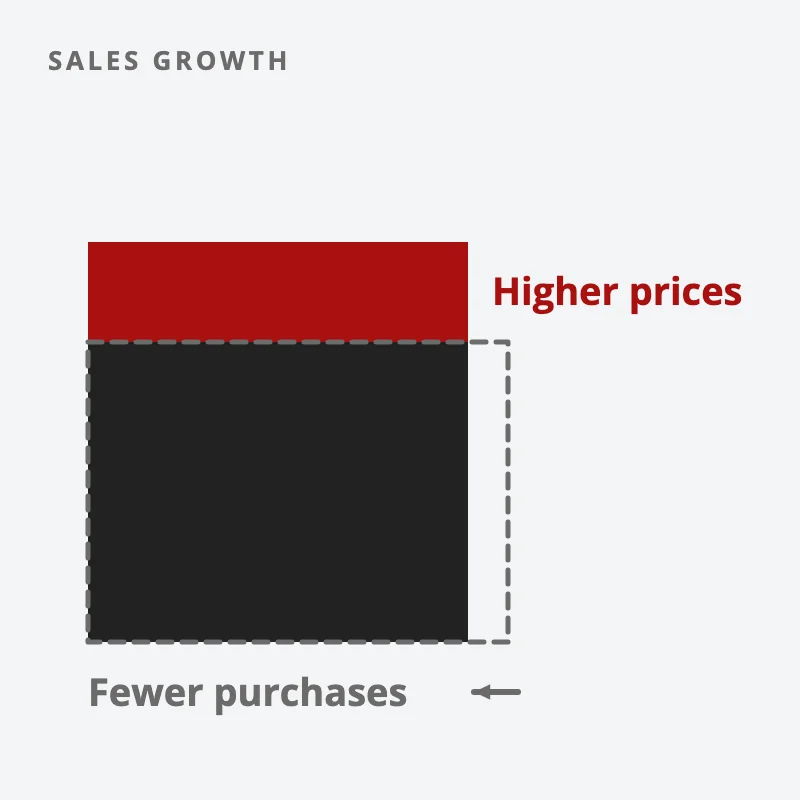
Home Depot increased sales by 5.7% to $47.9 billion and maintained its full-year guidance. However, customer transactions fell approximately 1%, while the entire comparable-sales increase came from a higher average transaction value.
The underlying message was important: consumers were not necessarily purchasing more goods. In many categories, they were simply paying more for them.
Sales can grow while shoppers buy less, simply because each purchase costs more.
Table 5: Significant U.S. Stock Moves (August 2026)
Company
Approx. Stock Move
Reason for Move
Salesforce
+22%
Strong earnings and expanded Anthropic partnership
Okta
+28%
Revenue beat and raised outlook
Palantir
Nearly +30%
93% revenue growth and 149% US commercial growth
Workday
Nearly +20%
Reports of potential Silver Lake takeover
Dick’s Sporting Goods
-31%
Sharp reduction in company outlook
Walmart
Approx. -9%
Weak comparable sales and consumer pressure
AMD
More than -8%
Valuation concerns despite record revenue
Marvell
-8%
Strong results but elevated AI expectations
Cisco
-8%
Hardware stocks failed to receive earnings premium
Other notable moves included Dick’s Sporting Goods, which declined approximately 31% after reducing its outlook, while Moderna approximately doubled following positive melanoma vaccine trial data before giving back 24% the following day.
Microsoft also lost approximately $112 billion in market capitalization during one session after Morgan Stanley questioned whether AI-generated revenue was growing quickly enough to justify the extraordinary level of AI capital expenditure.
8. Fixed Income: Long-Term Bond Yields Become the Market’s Main Constraint
The bond market was arguably the most important underlying story of August. U.S. long-term Treasury yields moved to levels not seen in almost two decades as investors demanded greater compensation to hold long-duration government debt.
The 30-year Treasury yield reached approximately 5.32% during the middle of the month, its highest level since 2007. By month-end, the U.S. 10-year yield stood near 4.76% while the 30-year finished around 5.25%.
The pressure became significant enough that the U.S. Treasury announced plans to at least double its repurchases of 10- to 30-year bonds beginning in September. Federal government debt also exceeded $40 trillion during the month.
Table 6: Global Bond Market Levels (August 2026)
Bond Market
August Yield / Level
Significance
U.S. 2-Year Treasury
Sharp +13 bps move on Jackson Hole day
Reflects renewed September hike expectations
U.S. 10-Year Treasury
Approx. 4.76%
Elevated long-term financing costs
U.S. 30-Year Treasury
Approx. 5.25%
Reached 5.32%, highest since 2007
Japan 10-Year Government Bond
Approx. 2.95%
Highest level since 1996
German 30-Year Bonds
Highest borrowing cost since 2011
European long-duration pressure
The bond sell-off was global rather than purely American. Japan’s 10-year government bond yield reached approximately 2.95%, a level last seen in 1996. Markets were assigning approximately an 87% probability to a Bank of Japan rate increase in September.
German 30-year borrowing costs also reached their highest level since 2011.
The simultaneous tightening of major global bond markets represents an increasingly important constraint on equity valuations. Higher sovereign yields increase corporate borrowing costs, reduce the present value of long-duration earnings, and provide investors with more attractive alternatives to equities.
9. Commodities: Gold Surges While Oil Retains Its War Premium
Gold delivered one of its strongest monthly performances of the year, gaining close to 10%. The metal began August near $4,000 and climbed to approximately $4,730 on 25 August, its highest level in more than three months.
Warsh’s hawkish Jackson Hole speech triggered a sharp reversal. Gold fell approximately 2.7% in a single session before finishing the month near $4,470.
Silver reached approximately $65, its highest level in 14 years, before retreating alongside gold and other hard assets.
An important cross-asset relationship emerged on Jackson Hole day. Gold, silver, gold-mining shares and Bitcoin all declined simultaneously as interest-rate expectations increased. The move suggested that investors were temporarily treating the entire hard-asset complex as one large directional trade on monetary policy.
Table 7: Commodities and Alternative Asset Performance (August 2026)
Asset
August Closing / Key Level
Monthly Change
Primary Driver
Gold
Approx. $4,470
Nearly +10%
Inflation, geopolitics and rate expectations
Silver
Peak near $65
Strong positive month
Hard-asset demand and inflation hedge flows
Brent Crude
$91.09
Approx. +3%
Iran conflict and Hormuz disruption
U.S. Dollar Index
Approx. 99.4
Slight decline
Mixed growth and rate expectations
Bitcoin
Approx. $78,500
More than +20%
ETF inflows, short squeeze and policy optimism
Ethereum
Approx. $2,450
Approx. +30%
Broad crypto-market recovery
10. Digital Assets: Bitcoin’s Best Month in More Than a Year
Bitcoin began August near $63,000, still approximately 27% lower for the year and trapped in a relatively narrow trading range.
The market changed dramatically during the second half of the month. On 20 August, Bitcoin broke above $72,000 in what became the largest cryptocurrency short squeeze since 2021. Approximately $3 billion of leveraged positions were liquidated, with roughly 92% of those positions reportedly being short positions.
The rally accelerated from there. Bitcoin gained approximately 22% in a single week, its strongest weekly advance in more than two years, and subsequently broke above $80,000 for the first time in over three months. The month’s peak was approximately $81,200.
Spot Bitcoin ETF inflows reached approximately $1.92 billion during one week, the largest weekly inflow in around ten months.
Drivers of the Bitcoin Rally
Several developments contributed to the move. The U.S. Treasury’s decision to increase long-term bond buybacks was interpreted by some investors as a positive liquidity signal. President Trump publicly encouraged Congress to pass the Clarity Act, which would provide a clearer regulatory framework distinguishing cryptocurrencies treated as securities from those classified as commodities.
Proposed regulatory changes from the Securities and Exchange Commission were also interpreted positively by digital-asset markets.
Warsh’s Jackson Hole speech temporarily interrupted the rally. Bitcoin fell below $77,000 and approximately half a billion dollars of leveraged positions were liquidated. However, Bitcoin subsequently recovered to finish the month near $78,500, representing a monthly gain of more than 20%.
Ethereum performed even better on a percentage basis. ETH began August around $1,870, climbed above $2,500 late in the month, and closed near $2,450. That represented an increase of approximately 30%.
11. September 2026: A Concentrated Calendar of Market Risk
August leaves investors facing a highly unusual setup. Equity indices remain near record territory, but the macroeconomic backdrop includes weakening employment, stubborn inflation, historically elevated long-term bond yields, persistent geopolitical risk and the possibility of simultaneous tightening by two major central banks.
Table 8: Key Market Events to Watch in September 2026
Date
Event
Primary Market Risk
4 September
U.S. Payrolls
Determines whether July’s job contraction was temporary or structural
Markets expect a high probability of a rate increase
18 September
Quadruple Witching
Potential increase in equity and derivatives volatility
The rapid changes in Federal Reserve expectations during August illustrate how uncertain the market environment has become. The probability of a September rate increase moved from approximately 57% to below 35%, before climbing back toward 60% by the end of the month.
This lack of conviction means September’s economic releases have the potential to produce unusually large moves across bonds, equities, commodities and currencies.
12. Summary of Market Drivers and Strategic Outlook
August 2026 was defined by a widening disconnect between financial markets and the underlying macroeconomic environment. U.S. equity indices continued to rise even as payrolls contracted, consumer indicators weakened, inflation remained above target and long-term interest rates moved to multi-year highs.
The artificial-intelligence investment cycle also entered a new phase. Nvidia continued to demonstrate extraordinary demand for AI infrastructure, but the strongest incremental market reactions shifted toward software and cybersecurity companies capable of showing measurable AI-related revenue. At the same time, companies such as AMD, Marvell and Cisco demonstrated that strong results alone were no longer sufficient when valuations already embedded aggressive growth expectations.
The consumer picture was less encouraging. Walmart, Target and Home Depot all provided evidence that higher prices and elevated fuel costs are influencing household behavior. Consumers are increasingly making trade-offs, while revenue growth in some categories reflects higher prices rather than higher transaction volumes.
Outside equities, the bond market remains the principal constraint. U.S., Japanese and European long-term borrowing costs are rising simultaneously, increasing the hurdle rate for every other financial asset. If those yields continue to rise, equity markets will eventually have to justify valuations against an increasingly attractive risk-free alternative.
Geopolitical risk also remains unresolved. Oil retains a substantial premium because of continued disruption through the Strait of Hormuz, while renewed direct military exchanges between the United States and Iran mean September begins with the possibility of additional escalation.
Digital assets were among August’s strongest performers. Bitcoin’s move above $80,000 and Ethereum’s approximately 30% monthly gain demonstrated renewed institutional appetite for cryptocurrencies, although both assets remain highly sensitive to liquidity and interest-rate expectations.
Heading into September, the most important question is therefore not whether investors can predict the exact Federal Reserve decision. The more important issue is whether markets can continue absorbing higher interest rates, weaker employment and geopolitical instability without a broader repricing of risk.
The appropriate response in such an environment is disciplined risk management rather than aggressive prediction. Position sizes should remain manageable, major macro events should be allowed to pass before adding substantial exposure, and price action should take priority over narratives.
The market will ultimately reveal whether August’s rally represented continued resilience or merely the final extension of a trend before a more difficult September. Our job is to observe that evidence, manage risk accordingly, and remain positioned to respond when the next direction becomes clear.
“Beginner covered-call writing: I don’t see what’s so risky here.” That was the title of a question on Reddit’s options forum, and it is a fair one. You own 100 shares, you sell someone the right to buy them from you at a higher price, and you collect a premium for it. If the shares never get there, you keep the cash and the shares. So where is the risk?
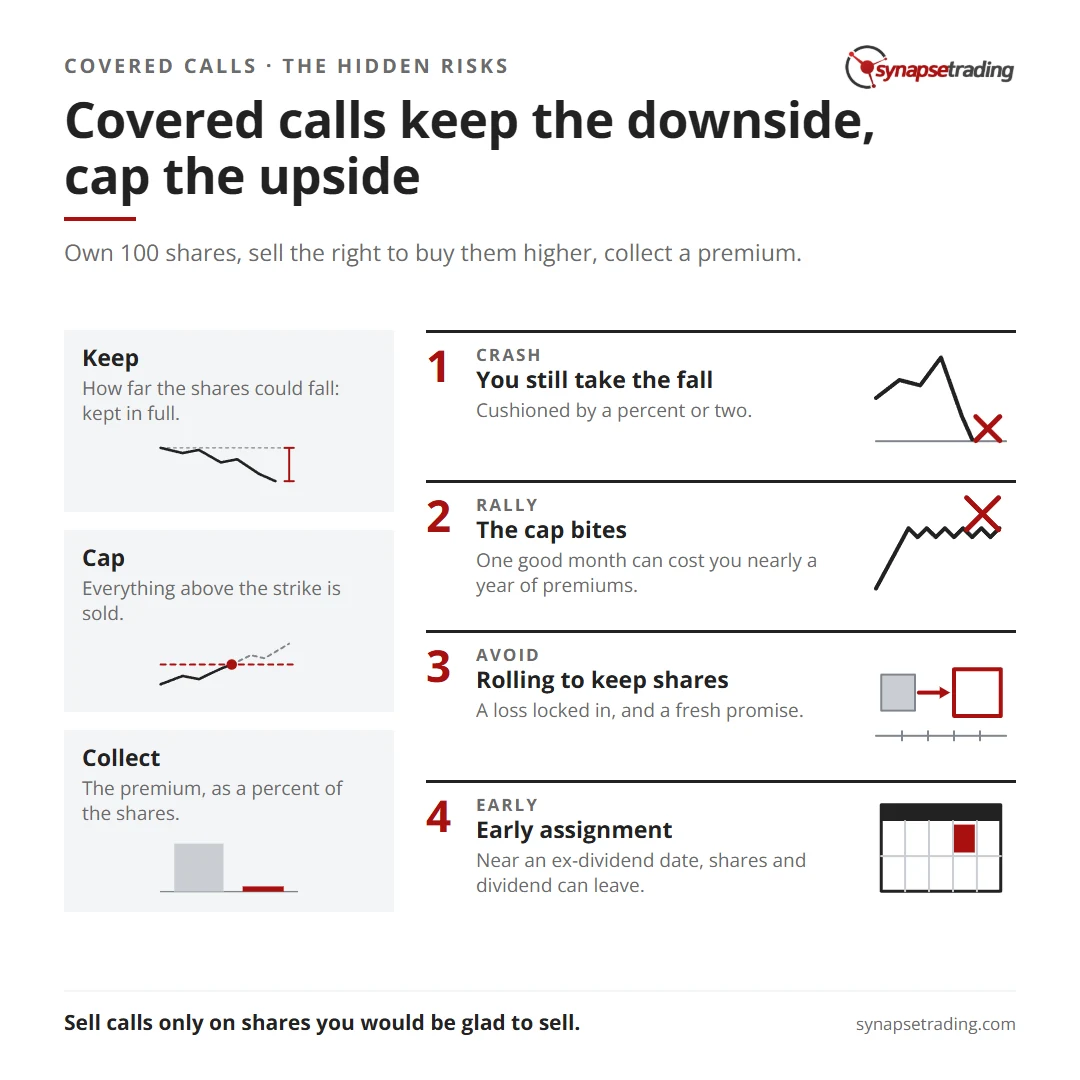
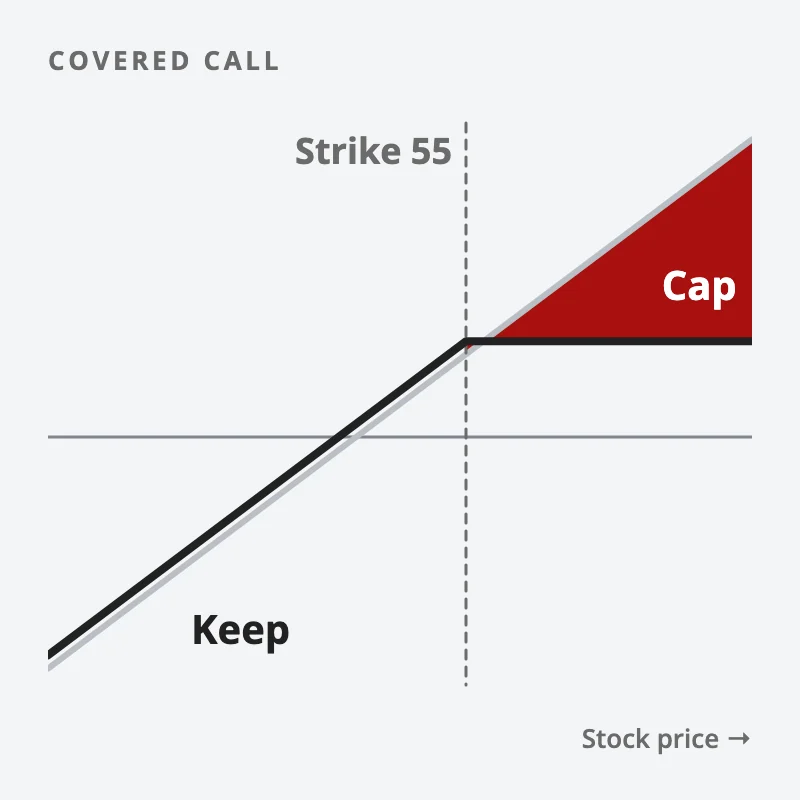
Here is the short answer. A covered call keeps almost all of the downside of the shares and caps the upside at the strike price. The premium is small next to either. In a crash, you still take the fall, cushioned by a percent or two. And on shares you want to keep for years, you have sold away the sharp rally that would have made your year, for roughly what one month of waiting pays.
Both risks are easy to miss, because a covered call wins in most ordinary months.
Why does a covered call look so safe?
Let me give it its due first.
Compared with owning the shares on their own, a covered call is a little less risky. The premium arrives on day one, and it is yours whatever the stock does next. If the stock drifts sideways for the month, the covered call simply wins. You collected something for holding shares that went nowhere.
That is why it feels like free money. A run of small, steady gains is easy to show, month after month, and the rare bad month is easy to scroll past. Each month looks like a success on its own.
But a strategy that wins most months can still lose you the year. To see how, it helps to put real numbers on one trade.
What happens to a covered call when the stock moves a lot?
Here is a hypothetical example with round numbers. You own 100 shares of a stock at USD 50. You sell one call with a strike of 55, expiring in a month, for USD 0.80 a share. One contract covers 100 shares, so you collect 1.6% of the shares’ value, today.
Now picture three different months.
Stock price at expiry
Shares alone
Shares plus covered call
What happened
USD 52, a quiet month
+4.0%
+5.6%
You keep the shares and the premium
USD 65, good news lands
+30.0%
+11.6%
Your shares are called away at 55
USD 40, a bad month
−20.0%
−18.4%
The premium cushions 1.6 points of the fall
Read the table from the bottom up.
In the bad month, you lose almost as much as someone who did nothing. The premium paid for 1.6 points of a 20-point drop, and that is the whole of the protection.
In the good month, the stock ran to 65 and your shares left at 55. You gave up USD 9.20 a share of gain (65 minus 55, less the 0.80 you were paid) to collect USD 0.80. At 0.80 a month, that is about 11 months of premium, handed over in a single month.
One good month can cost you nearly a year of premiums.
This is what the guide to options trading means when it says a covered call keeps every loss and gives away every big win. Neither half shows up in a calm month, which is exactly when most people try it for the first time.
What if I want to keep the shares when the call goes in the money?
This is where most of the regret shows up.
Say the stock is at 65 a few days before expiry, and these are shares you planned to hold for a decade. You have two ways to keep them. Both cost money.
The first is to buy back the call. With the stock at 65, the right to buy at 55 is worth at least USD 10 a share, so you pay 10 to close a trade that paid you 0.80. Your shares are still yours, now worth 65. Add it up and you are up 5.80 a share, the same as if they had been called away. The cap does not go anywhere. You just pay it in cash instead of in shares.
The second is to “roll” the call. You buy back the old one and sell a new one further out in time, at a higher strike, usually for a small credit. A roll is two trades: a loss you lock in today, and a fresh promise to sell tomorrow. If the stock keeps climbing, you can roll several times and stack up real losses on the calls while the shares rise on paper, which is how a trade meant to pay a little ends up costing a lot.
People do this because selling a winner they love feels worse than a loss they can hide inside a roll. The fear of missing the next leg up is doing the trading.
Can a covered call be assigned before expiry?
Yes. The usual trigger is a dividend.
US-listed stock options can be exercised on any business day, not only at expiry. The Options Industry Council puts it plainly: “All standardized equity options use American-style exercise.” When someone exercises, the clearing house assigns the notice at random to a broker with sellers on its books, and the broker then picks among its own customers, so you cannot know in advance whether it will be you.
The dividend is what makes early exercise worth it to the buyer. In the Council’s words, “A call holder is entitled to the dividend if the holder exercises the call prior to the ex-dividend date.” So when your call is deep in the money, with little time value left, and an ex-dividend date is close, the buyer has a reason to exercise the day before, and you find out when the shares are gone. They leave at the strike, and the dividend you were counting on leaves with them. What to do when that happens is in what happens when an option is assigned.
The Keep, Cap, Collect test
Before selling a call on shares you hold, write down three numbers.
Keep. How far could the shares fall in a bad month? That is the risk you keep in full.
Cap. How far could they rise in a great month? Everything above the strike is what you sell.
Collect. The premium, as a percentage of the shares.
In the example, Keep was the full 20% fall, Cap began at the strike, 10% above the price, and Collect was 1.6%. When Collect is tiny next to both Keep and Cap, the trade is paying you very little to carry two risks at once.
A covered call keeps almost all of the downside and caps the upside at the strike.
Then ask one more question. Would you be happy to sell these shares at the strike this month? If yes, the covered call does what it says, and you are being paid to place a sell order you wanted anyway. If no, the Cap is the risk that will hurt, because it lands on exactly the shares you care about most.
Personally, I think that is the honest way to frame a covered call. It is a decision to sell your shares at a set price, and a small payment for making the promise.
If you would rather start with the part we do teach, our free 15-Minute Swing Trader’s Checklist has the daily routine and the questions to ask before any trade. Get the free checklist →
Is a covered call worse than simply owning the shares?
It depends on the month. Nobody gets to pick the month.
Sideways and slowly rising markets favour the covered call. Strong rallies punish it, because that is where the cap bites. Crashes treat both about the same, since a percent or two of premium does little against a 20% fall.
So the covered call does not lower your risk in any way that matters in a bad year. It changes the shape of your returns: more small wins, smaller big wins, and the same big losses. Your position size is still 100 shares, with the full risk of 100 shares. The sizing rules in our money and risk management guide apply in full, premium or no premium.
Covered calls are also one half of the wheel strategy, which runs them in a loop with cash-secured puts, so the same two risks travel with it.
Which shares in your account would you be glad to sell at a higher price this month? And which would you regret selling? A covered call belongs only on the first list.
FAQ
Is selling covered calls risky?
Yes, in a way the premium hides. You keep nearly the full downside of the shares and give up everything above the strike, while the premium is usually a percent or two. In a crash you still take the fall, and in a big rally your shares are sold at the strike.
What is the maximum loss on a covered call?
The maximum loss is the price you paid for the shares minus the premium, if the stock goes to zero. In the example above, that is USD 50 minus 0.80, or USD 49.20 a share.
What happens when a covered call is assigned?
You sell 100 shares per contract at the strike price and keep the premium. If you wanted to keep the shares, you have to buy them back at the market price.
Can I lose the dividend on a covered call?
Yes. If the buyer exercises the call before the ex-dividend date, your shares are gone before the dividend is paid, and the buyer collects it instead of you.
Does Synapse Trading teach covered calls?
No, we do not teach options at the moment. We teach end-of-day swing trading in shares, forex and ETFs, and the chart-reading and sizing carry over to whatever product you use.
Go deeper
This post covers one corner of options. If you would rather start with what we do teach, the free 15-Minute Swing Trader’s Checklist has the daily routine, the questions to ask before every trade, and the five rules that keep you in the game.
About the author. Spencer Li is The 15-Minute Trader and the founder of Synapse Trading. He is a Certified Financial Technician (CFTe) with 15+ years of trading, run from 70+ countries. He holds a B.Acc and B.BM from SMU. Every trade he takes is public, dated, losses left in. He teaches rules-based swing trading in 15 minutes a day, one system for any market.
Educational content only, not personalised financial advice. Trading carries risk, including loss of capital. Past performance is not indicative of future results. Synapse Trading is not licensed or regulated by MAS.
https://synapsetrading.com/wp-content/uploads/2026/10/covered-call-risk-card.webp6301200Spencer Lihttps://synapsetrading.com/wp-content/uploads/2026/10/synapse-logo-horizontal-light.pngSpencer Li2026-09-02 20:44:012026-10-27 17:06:30What Is the Real Risk of Selling Covered Calls?