

Uranium ETF and Stocks: What the 2024 Rally Teaches About Trading a Supply Shock
Want the daily routine? Get the free 15-Minute Swing Trader’s Checklist. Get it free →
By Spencer Li, CFTe · Last updated: 26 October 2026
The best-known uranium ETF is the Global X Uranium ETF, ticker URA, which held 60 stocks on 23 October 2026, with Cameco alone making up 23.43% of the fund. Uranium stocks move mostly on supply news rather than on quarterly earnings. In February 2024, a single production warning from the world’s largest producer sent URA to its highest close since 2014, and one small Australian miner up more than 18% in a day.
I wrote about that rally when it happened. This is the same story, retold with what the market did next, because the week after it taught more than the week itself. The tickers below are named to explain how the sector moves, and none of them is a recommendation to buy.
What happened to uranium stocks in February 2024?
On 1 February 2024, Kazatomprom, the Kazakh state miner that calls itself “the world largest uranium producer”, published its guidance for the year. It expected to produce 21,000 to 22,500 tonnes of uranium, and for most of its mines that meant output about 20% below the levels set in its subsoil use agreements.
The number itself was not the shock. The shock was the gap between the number and the promise. Back in August 2022, the company had planned to lift 2024 production to 90% of those agreed levels, so the market had spent 18 months pricing in a supply increase that now was not coming. The reason given was quite mundane. Kazatomprom could not get enough sulphuric acid, the chemical it pumps underground to dissolve the uranium out of the rock, and construction at new deposits was running late.
URA rose 6.2% that day to close at 32.21, its highest close since March 2014. Cameco, the Canadian producer, rose 5.9% in New York. Then Sydney woke up, and the smaller names went much further.
| Stock | Where it trades | Move on 2 February 2024 |
|---|---|---|
| Paladin Energy | Sydney | up as much as 7.4%, closed up 6.6% |
| Boss Energy | Sydney | up 8.0% |
| Bannerman Energy | Sydney | up as much as 8.3%, closed up 5.1% |
| Deep Yellow | Sydney | up as much as 18.3%, closed up 12.8% |
Look at the bottom row. Deep Yellow, a developer with projects in Australia and Namibia, moved about twice as far as the ETF by the close, and three times as far at its high, and that difference in size is most of what you need to know about trading this sector.
Why does a production cut move uranium stocks so much?
Say you run a nuclear power plant. You cannot switch to another fuel when uranium gets expensive, and you cannot let the reactor run dry, so you keep buying whatever the price. Demand like that barely bends, and when demand barely bends, a small change in supply produces a large change in price. My post on what moves prices in the financial markets walks through that mechanism in more detail.
In early 2024, supply was being squeezed from two sides at once. On 26 July 2023, a coup in Niger closed what the French miner Orano called its “main supply and export corridor”, which left uranium from one of Africa’s producing countries with no easy way to the coast. Six months later came the Kazatomprom warning. The month-end spot price, which Cameco publishes as an average of the two main industry price reporters, reached 100.25 US dollars a pound at the end of January 2024. The last time it had closed a month above 100 was July 2007.
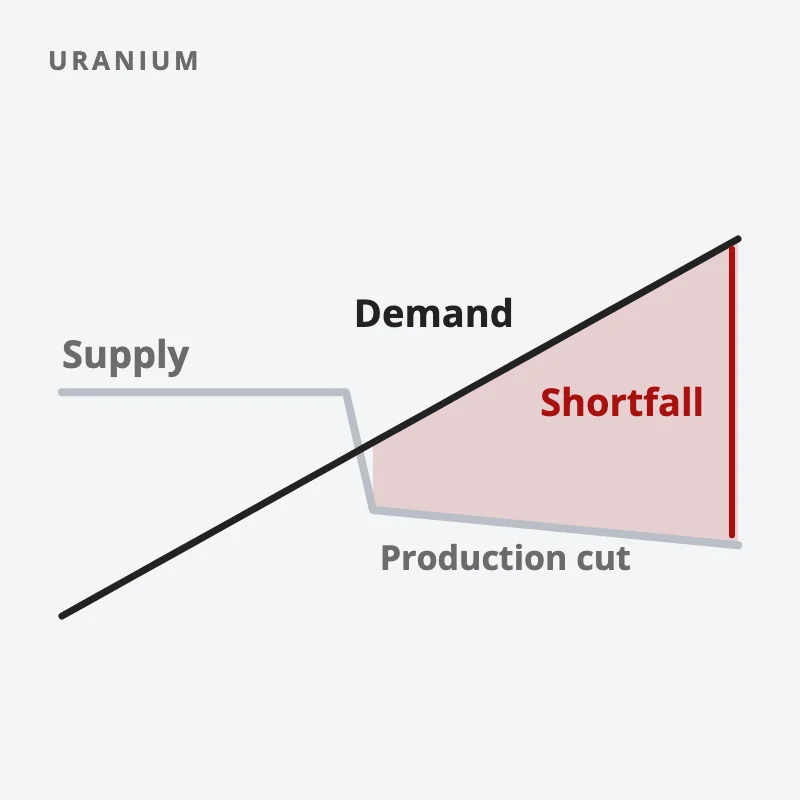
So the rally was not one tidy catalyst. It was two supply problems landing on a market where buyers had nowhere else to go, and that tends to be how uranium rallies start.
What is actually inside a uranium ETF?
Most people buy URA expecting a neat basket of uranium miners, and the issuer’s own holdings list is a little more surprising than that.
As at 23 October 2026, Global X lists URA at 60 holdings, with net assets of 4.79 billion US dollars and a total expense ratio of 0.69% a year. Cameco is 23.43% of the fund. The second-largest holding, at 7.96%, is the Sprott Physical Uranium Trust, which is a fund that holds physical uranium rather than a company that mines it. NexGen Energy is third at 6.26%. The fund tracks an index of uranium and nuclear components companies, so it also holds businesses that build reactor parts rather than dig anything up.
That changes what “diversified” means here. Nearly a quarter of your money rides on one Canadian company, and another slice tracks the metal price directly. A small developer like Deep Yellow, by comparison, is a much thinner slice of the basket, which is exactly why URA rose 6.2% while Deep Yellow briefly rose 18.3%.
The fund’s own record has a second surprise. Global X reports URA’s return at net asset value as +15.69% a year over the 10 years to 30 September 2026, and -2.98% a year since it launched in November 2010. Same fund, and two very different answers. The gap comes from timing. Four months after launch, in March 2011, the Fukushima accident happened, and URA lost about 29% that month. The theme took most of a decade to recover.
If you would rather follow a theme like this in a few minutes a day than watch Sydney open at night, my free 15-minute swing trader checklist is the routine I use myself.
Why do small uranium miners swing harder than the ETF?
The February 2024 story has a second half that the headlines skipped.
One week after the rally, on 9 February 2024, Boss Energy fell 12.7% in a single session, Bannerman fell 11.1% and Deep Yellow fell 9.9%. Most of the excitement of 2 February was gone within five trading days. Imagine buying Deep Yellow at the close on the good news, feeling the relief of finally being in, and then watching the same stock hand back most of the move a week later. That is the emotional pattern of a small miner, and it runs both ways.
The reason is the same reason they rose so fast. A developer that is still building its mine has little revenue, so its share price is mostly a bet on the future uranium price. When that bet looks better, the stock jumps. When the mood cools, nothing in the business holds the price up, and the fall is just as quick.
This is also why a handful of uranium stocks is less diversified than it looks. In my own trading plan, a group of stocks from the same theme counts as one bet, because on a day like 9 February they all fall together. Three uranium miners can feel like three trades, and the market treats them as one big one. Getting that wrong is how a single headline ends up wiping out a month of careful work, and my post on position sizing covers how to keep any single bet small enough to survive.
Why do commodity booms overshoot?
In 1938, an American agricultural economist named Mordecai Ezekiel published a paper called “The Cobweb Theorem” in the Quarterly Journal of Economics. He was looking at farm markets such as hogs, where farmers decide how much to produce based on today’s price, but the product only reaches market a season later.
The result is a loop. High prices encourage everyone to produce more, the extra supply arrives late and all at once, prices collapse, everyone cuts back, and the shortage that follows sends prices back up. Plotted on a supply and demand chart, the path spirals like a spider’s web, which is where the name comes from.
Uranium runs the same loop on a much slower clock, because a uranium mine takes years to plan, permit and build. Kazatomprom’s 2024 guidance shows how stubborn the supply side is even for the biggest producer in the world. It had a plan, it had the deposits, and it was held back by a shortage of acid.
The month-end spot price shows the loop in Cameco’s numbers. It went from 100.25 US dollars a pound in January 2024 down to 64.23 in March 2025, and back up to 89.63 by the end of September 2026. Over the same stretch, the long-term contract price utilities pay kept climbing, and at 96.50 in September 2026 it sat at the highest level in Cameco’s series, above the 95.00 it reached in 2007 and 2008. So the spot price swung while the contract price kept rising, which is roughly what the cobweb would predict for a market where buyers lock in supply years ahead.
Is it too late to buy a uranium ETF?
On 23 January 2026, a trader on Reddit’s r/ETFs said they were thinking about URA but were “unsure if I am too late”.
They had good reason to worry. URA closed at 57.00 that day and at 61.81 on 28 January. On 23 October 2026, Global X put its net asset value at 34.11, about 40% below the close on the day they asked. The uranium story did not change much over those nine months. The price paid for it did.
I cannot tell anyone whether a given week is too early or too late for a theme, and neither can anyone else with any honesty. What I can share is how I treat any theme like this one, uranium included.
- Story. A real supply story can still go nowhere for years, as URA’s record since 2010 shows. The story decides what goes on the watchlist, and never when to buy.
- Chart. Price decides the timing. A theme that is falling while its story sounds great is telling you something the news has not caught up with yet.
- Calendar. Supply news arrives on a schedule, through company guidance and quarterly updates. My own plan closes or reduces positions before major news, because a guidance day can move a small miner 10% before you can react.
That third habit is the easiest one to skip, because the fear of missing the next 18% day is strongest on exactly the morning the release could hand it back.
If you want a routine that keeps an eye on themes like uranium without guessing the timing, the free 15-minute swing trader checklist is the one I run every day.
FAQ
What is the best-known uranium ETF?
The Global X Uranium ETF, ticker URA, launched in November 2010. On 23 October 2026 it held 60 stocks and reported net assets of 4.79 billion US dollars, according to Global X.
What does URA hold?
On 23 October 2026, its largest holdings were Cameco at 23.43%, the Sprott Physical Uranium Trust at 7.96% and NexGen Energy at 6.26%. It holds uranium miners, a physical uranium fund and companies that make nuclear components.
What is the expense ratio of URA?
Global X lists a total expense ratio of 0.69% a year, as at 23 October 2026.
Why did uranium stocks rally in February 2024?
On 1 February 2024, Kazatomprom guided 2024 production about 20% below its subsoil use agreements, citing a shortage of sulphuric acid and construction delays. That came on top of the July 2023 coup in Niger, and URA closed at its highest level since 2014.
Are uranium miners riskier than a uranium ETF?
Usually, yes. In February 2024, Deep Yellow rose as much as 18.3% in a day when URA rose 6.2%, and a week later it fell 9.9% in a day. Smaller miners carry more single-company risk in both directions.
What is the uranium price today?
Cameco’s month-end average put spot uranium at 89.63 US dollars a pound on 30 September 2026, and the long-term contract price at 96.50. It publishes a new figure at the end of each month.
Have you ever held a theme stock through a headline like the February 2024 one, and did the second week feel anything like the first? Let me know in the comments.
If you want the bigger picture of how one theme fits into a full routine, my free trading guides collect the rest. And if the 9 February sell-off looked a lot like a coin toss to you, Is Trading Gambling? explains how to be the casino instead.
And if you want a routine that follows themes like uranium in 15 minutes a day, grab the free 15-minute swing trader checklist.
About the author. Spencer Li is The 15-Minute Trader and the founder of Synapse Trading. He is a Certified Financial Technician (CFTe) with 15+ years of trading, run from 70+ countries. He holds a B.Acc and B.BM from SMU. Every trade he takes is public, dated, losses left in. He teaches rules-based swing trading in 15 minutes a day, one system for any market.
Education, not financial advice. Synapse Trading is not licensed by MAS to advise on investment products. Trading carries risk of loss, and past performance is not indicative of future results.
Want the daily routine? Enter your email for the free 15-Minute Swing Trader's Checklist.
Free 5-page PDF, then occasional trading emails. Education only, not financial advice. Unsubscribe anytime. Kit stores your email in the US: see our privacy policy.
Want to learn the full method? The Trading Mastery Program teaches the 4 strategies I have traded since 2011. It suits beginners and experienced traders.
Rather follow the trades as they happen? Daily Trading Signals is our Telegram channel: my trade ideas with entry, stop and exit, and every trade is public.
Questions about this post? Ask in the free Telegram channel →
Educational content only, not personalised financial advice. Trading carries risk, including loss of capital. Past performance is not indicative of future results. Synapse Trading is not licensed or regulated by MAS.

