• Link to Facebook
  • Link to X
  • Link to Instagram
  • Link to Youtube
  • Link to LinkedIn
  • Link to Mail
Free PDF: The 15-Minute Swing Trader's Checklist, the daily routine of a trader since 2007
Synapse Trading
  • Mentoring
    • Trading Mastery Program
    • All mentoring options
  • Signals
    • Daily trading signals
    • Signals trade log
  • Results
    • Student results and testimonials
    • Public trade log, losses left in
  • Free guides
    • Start here
    • Trading foundations
    • Technical analysis
    • Strategies and systems
    • Risk and money
    • Trading psychology
    • Markets and products
    • Free trading guides
    • Tools and resources
    • Blog
  • About
    • My background
    • My trading journey
    • Media and interviews
    • Travel log
  • Contact
    • Contact me
    • Partnerships
  • Start free
  • Click to open the search input field Click to open the search input field Search
  • Menu Menu
Spencer Li

How to Find Stocks to Swing Trade: The Screener Settings That Do the First Cut

Stock Trading
Find stocks to swing trade - swing trading

Last updated: 15 October 2026 · By Spencer Li, CFTe


There are thousands of stocks you could trade, and you have maybe 15 minutes a day to look. So the first job is to throw most of them away, quickly and for good reasons, before you open a single chart.

The way to find stocks to swing trade is to let a screener make that first cut, then judge what is left by eye. A good screen asks 5 questions in order: is the market healthy, can I get in and out, is the stock trending, is it stronger than the market, and is it near a sensible entry. I call it the 5-gate screen. What passes is a short list to study, and the trade decision comes later.

Below are the exact settings I use, what each one does, and the part no screener can do for you.
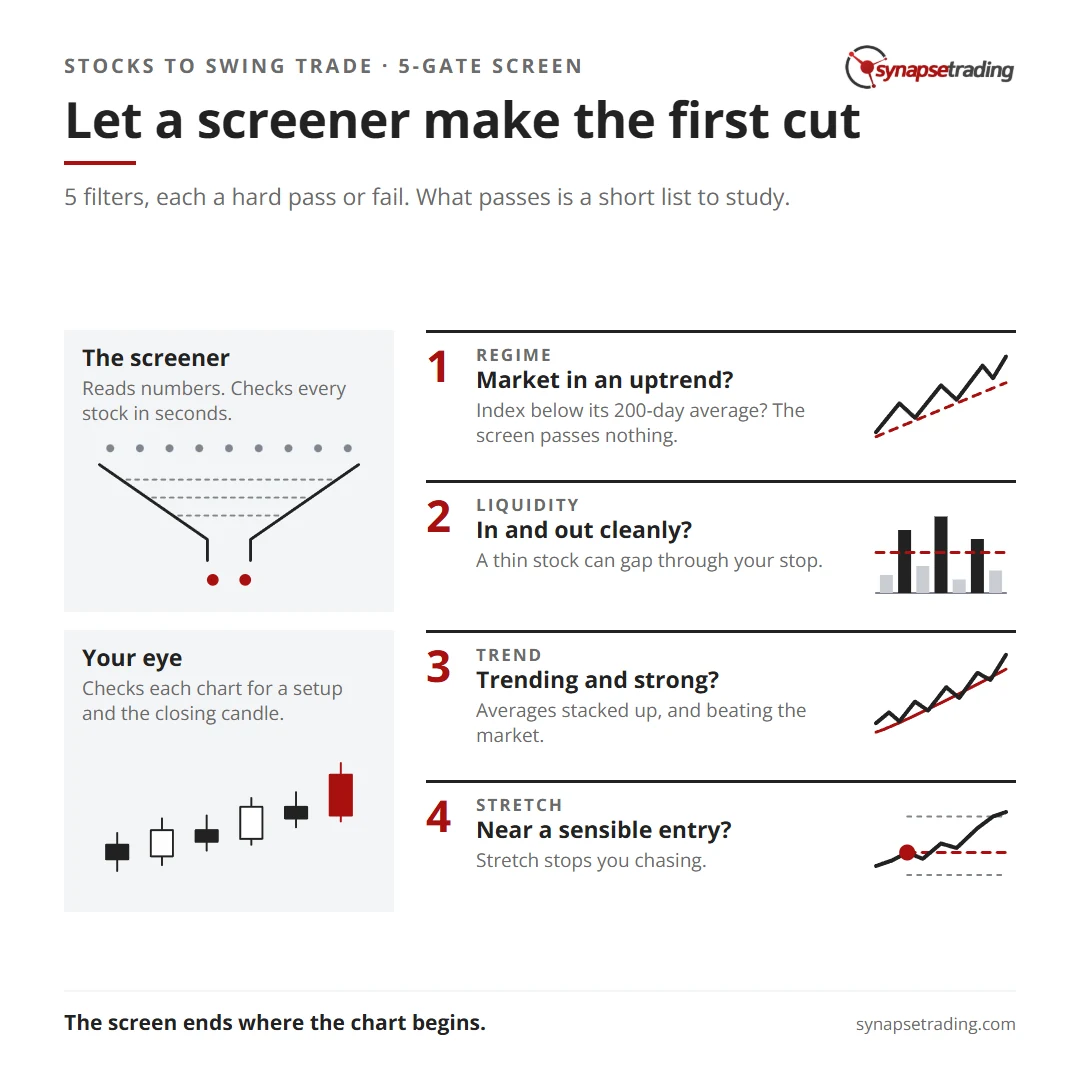
Let a screener make the first cut. Summary card for the post: How to Find Stocks to Swing Trade: The Screener Settings That Do the First Cut.

Why use a screener at all?

Because your attention is the scarcest thing in your routine. A screener checks every stock on your list against the same rules in seconds, and it never gets bored or skips one. That leaves your judgement for the 10 or 20 charts that deserve it.

A trader on r/swingtrading asked about this in September 2026: “Looking for a free screener – which can help me to find stocks trading within 5% of 52 weeks high”. It is a good instinct. A stock near its high is often a stock in demand. One reply made the right point, that the screener is a first pass and the trade decision comes after it.

What is the 5-gate screen?

5 filters, each a hard pass or fail. A stock must clear all of them. Here they are with the settings from my own screener.

GateThe questionMy setting
1. RegimeIs the market in an uptrend?The S&P 500 is above its 200-day simple moving average
2. LiquidityCan I get in and out cleanly?Average daily traded value over 20 days above USD 20 million (about SGD 26 million)
3. TrendIs the stock trending up?Price above its 200-day EMA, and the 20-day EMA above the 50-day, above the 200-day
4. StrengthIs it beating the market?In the top 25% of its 52-week range, and stronger against the S&P 500 than 63 trading days ago
5. StretchIs it near a sensible entry?Between 3 ATRs below and 2 ATRs above its 50-day average, RSI below 80

Two more checks ride along with gate 5. Today’s volume must be at least 1.5 times its 20-day average, and the stock must not have fallen more than 1% on its last day. On the day I captured these settings, 47 stocks passed from my US watchlist.
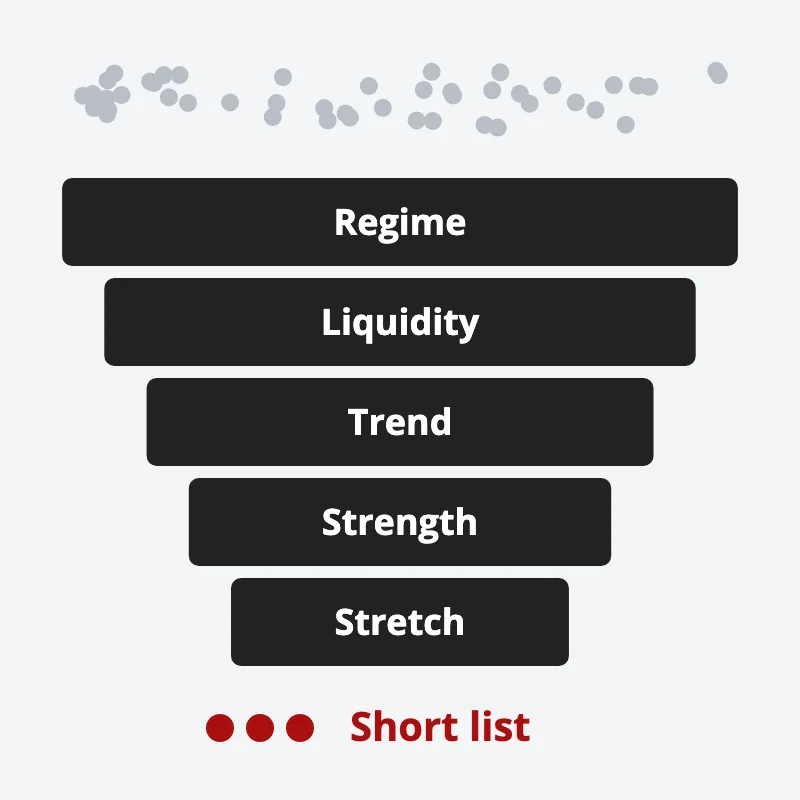
A funnel of five gates, regime, liquidity, trend, strength and stretch, turns many stocks into a short list
Five gates throw out most stocks, so only a short list reaches your charts.

Why does each gate earn its place?

Each one removes a different kind of bad trade.

Regime is the only gate that looks at the market as a whole. Most stocks fall when the market falls, so when the index is below its 200-day average, the screen passes nothing. An empty list tells you to wait.

Liquidity keeps you out of stocks you cannot exit at a fair price. A thin stock can gap through your stop and leave you waiting for a buyer. On SGX, far fewer stocks clear a USD 20 million bar, so if you trade there, set the floor to suit what you trade and keep your size a small slice of a normal day.

Trend asks for the moving averages stacked in order, short above medium above long. It is the simplest way to say “this stock has been going up, on every time frame I care about”.

Strength has 2 parts. The top 25% of the 52-week range keeps you near the highs. The relative strength check compares the stock’s price with the index’s, and passes only if that ratio is higher than it was about 3 months ago. If your screener has no ratio setting, a rough stand-in is 3-month performance above the index’s 3-month performance.

Stretch stops you chasing. It measures how far the price sits from its 50-day average, in units of ATR, the stock’s average daily range. My screen allows a deeper pullback, 3 ATRs below, than an extension, 2 ATRs above. The RSI ceiling of 80 drops stocks that have run too far, too fast.

ATR also sets a floor. My screen wants an ATR of at least 2% of the price, so the stock moves enough to be worth a swing trade. The link between that range and your risk is in risk vs volatility.

If you want a 15-minute daily routine that starts from a list like this, the free 15-Minute Swing Trader’s Checklist is at the end of this post.

How do you rank what passes?

By how fresh the pullback is. A list of 47 is still too many to study, so sort it.

I sort by the distance from the 50-day average, smallest first. A stock sitting right on its 50-day average, in a strong uptrend, is having a fresh pullback, and that is where I look first. A stock far above it has already moved.

A second sort is by relative strength, strongest first. When 2 stocks look equally good on a chart, I would take the one that has been beating the market by more.

What can a screener never check for you?

The chart itself. A screener reads numbers. It cannot see a pattern, judge whether a range is tight, or tell you whether today’s candle closed the way your setup needs.

So the screen ends where the chart begins. For each stock on the list, I open the daily chart and ask whether one of my setups is actually there. I look for a clean pullback to support or a tight base under resistance, and a candle that has closed in a way that confirms it. Most of the list fails this step, and that is fine.

The setups themselves are in the price action trading guide, with breakouts in how to avoid false breakouts and the candle rule in why you should decide on the closing candle.

What should you check after the screen and the chart?

The calendar. A stock can pass every gate and show a perfect setup with an earnings report 3 days away. A report can gap the price straight past your stop, so check the date before you size the trade. Holding stocks through earnings covers how to size for that gap.

Then size it from the stop. The rest of the stocks process, from choosing the market to managing the trade, is in the ultimate guide to stocks and CFDs trading.

Where do good trades come from?

From the first cut being strict. Every gate in the 5-gate screen removes a reason a trade could fail before you have spent any attention on it. The market is falling, the stock is too thin, the trend is broken, it is lagging, or it has already run. What is left is a short list worth 15 minutes of your day.

Which of the 5 gates is your current list missing?

FAQ

How do you find stocks to swing trade?

Run a screener with 5 gates (market regime, liquidity, trend, relative strength and stretch from the 50-day average), sort what passes by the freshest pullback, then check each chart for a setup and the closing candle.

What are good stock screener settings for swing trading?

One example: the index above its 200-day average, and 20-day average traded value above USD 20 million. Add the 20, 50 and 200-day EMAs stacked up, the stock in the top 25% of its 52-week range, and the price within 3 ATRs below to 2 ATRs above its 50-day average.

How many stocks should a screener return?

Few enough to check every chart in your routine. If the list is too long, sort by distance from the 50-day average and look at the closest first.

Can a screener tell you when to buy?

No. A screener filters numbers. It cannot judge a chart pattern or a candle close, so the entry decision stays with you.

Do these settings work for Singapore stocks?

The trend, strength and stretch gates do. The liquidity floor of USD 20 million is set for US stocks, so on SGX you would need to set a lower floor that suits your position size.

Go deeper

The free 15-Minute Swing Trader’s Checklist has the daily routine, the questions to ask before every trade, and the five rules that keep you in the game.


About the author. Spencer Li is The 15-Minute Trader and the founder of Synapse Trading. He is a Certified Financial Technician (CFTe) with 15+ years of trading, run from 70+ countries. He holds a B.Acc and B.BM from SMU. Every trade he takes is public, dated, losses left in. He teaches rules-based swing trading in 15 minutes a day, one system for any market.

Educational content only, not personalised financial advice. Trading carries risk, including loss of capital. Past performance is not indicative of future results. Synapse Trading is not licensed or regulated by MAS.
by Spencer Li
https://synapsetrading.com/wp-content/uploads/2026/10/how-to-find-stocks-to-swing-trade-card.webp 630 1200 Spencer Li https://synapsetrading.com/wp-content/uploads/2026/10/synapse-logo-horizontal-light.png Spencer Li2026-10-02 19:23:282026-10-26 16:51:11How to Find Stocks to Swing Trade: The Screener Settings That Do the First Cut
Spencer Li

Double Top and Double Bottom Patterns: How to Tell a Real One From an Early Guess

Technical Analysis & Price Action
Double tops and bottoms - chart patterns

Last updated: 14 October 2026 · By Spencer Li, CFTe


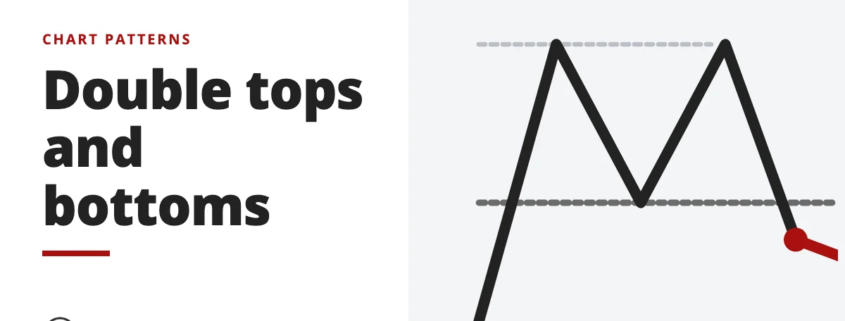
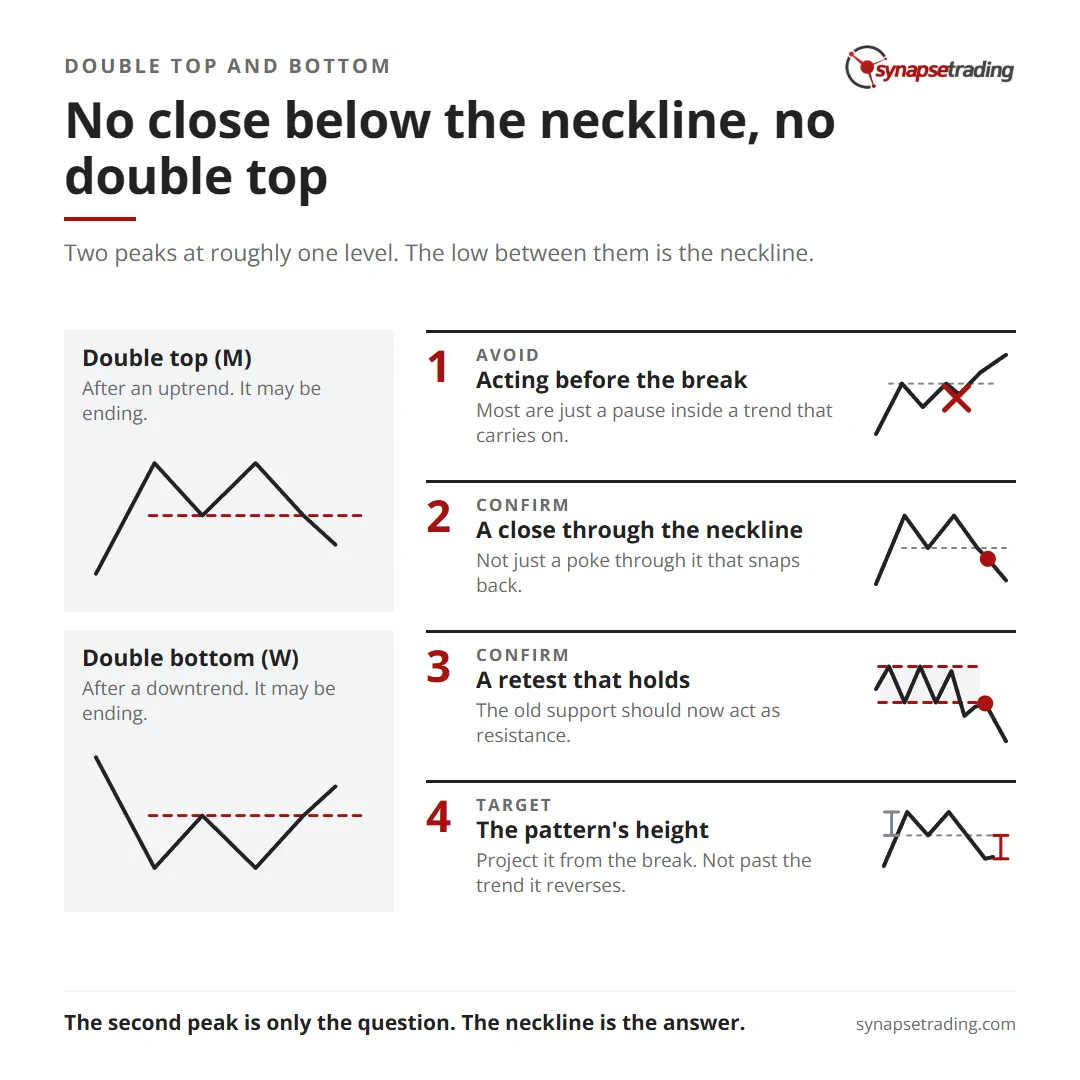
A double top is a bearish reversal pattern: the price rises to a high, pulls back, rallies to roughly the same high again, and fails. It looks like the letter M. A double bottom is the mirror image, a W, and it is a bullish reversal pattern.

Most beginners miss one detail. Two peaks at the same level do not make a double top. The pattern is only complete when the price closes below the low point between the 2 peaks, a level called the neckline. For a double bottom, it completes when the price closes above the high point between the 2 lows.

Until that happens, what you are looking at is an early guess, however convincing the 2 peaks look and however many people on social media are already calling it a top. The rest of this post is about telling the two apart.

No close below the neckline, no double top. Summary card for the post: Double Top and Double Bottom Patterns: How to Tell a Real One From an Early Guess.

What does a double top look like?

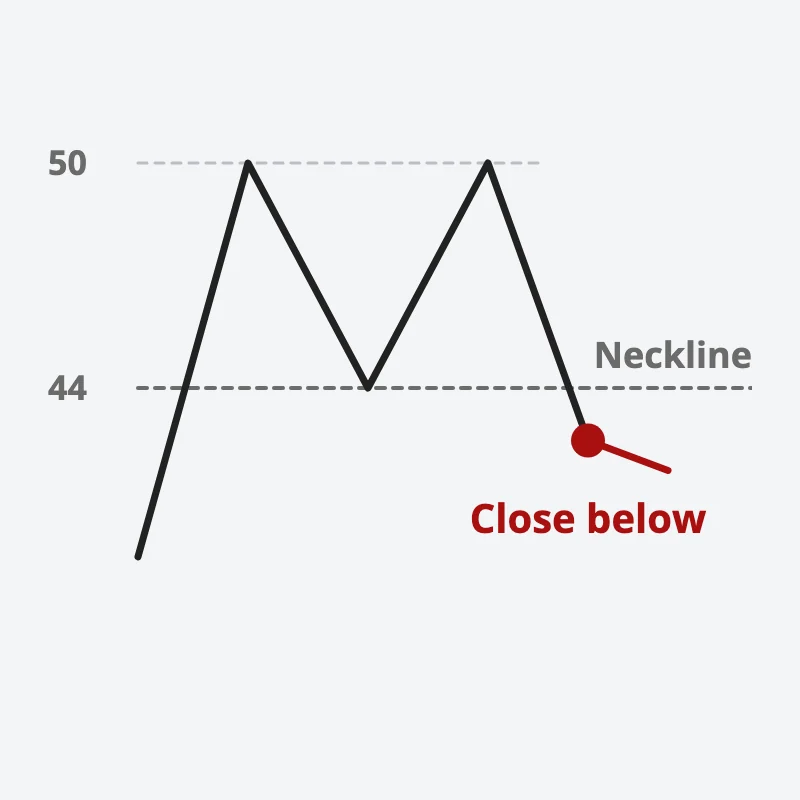
Picture a stock in a healthy uptrend. It climbs to 50, then pulls back to 44. Then it rallies again, all the way back to around 50, and stalls. Now the chart has 2 peaks and a valley, and the shape starts to look like an M.

The valley low at 44 is the neckline. If the price later closes below 44, the double top is complete. The buyers have tried twice to push through 50 and failed twice, and the low that held between the attempts has now given way.

An M-shaped double top with peaks at 50 and a neckline at 44; the pattern completes only when the price closes below 44
A double top is complete only when the price closes below the neckline.

A double bottom works the same way, upside down. A falling stock drops to a low, bounces, falls back to roughly the same low, and holds. It completes when the price closes above the peak of the bounce in between.

Double topDouble bottom
ShapeMW
Comes afteran uptrenda downtrend
Necklinethe low between the 2 peaksthe high between the 2 lows
Complete whenthe price closes below the necklinethe price closes above the neckline
Usual meaningthe uptrend may be endingthe downtrend may be ending

Why does a double top form?

The pattern is a story about 2 groups of people. On the first push to 50, the early buyers take profits and the rally stalls. As the price falls, the traders who bought near the top start to feel trapped and anxious.

Then the price climbs back towards 50, and those trapped buyers feel relief. Many of them promised themselves they would get out if they ever got their money back, and now they can. Alexander Elder describes this crowd as waiting with sell orders at the old high for their “second chance”. Their selling, plus fresh profit-taking, stops the second rally.

So the second peak is a test as much as a price level: it is the moment the market finds out whether the buyers have enough energy left to absorb everyone who wants out. If they do not, the price falls back, and when it breaks the neckline, the people who bought on the second rally are trapped too.

Why are so many double tops just early guesses?

Because 2 peaks at a similar level show up all the time, and most of them are just a pause inside a trend that carries on. Martin Pring, who wrote a whole book on price patterns, argues that true double tops are rare, and that many shapes that look like one turn into continuation patterns instead.

That is the trap. You see the second peak, you feel clever for spotting the M, and you act before the neckline breaks. Then the price pushes straight through the old high, the shorts who jumped in early scramble to buy back, and the “double top” you were so sure of becomes the launch pad for a breakout instead. The fear of missing the reversal is what makes this mistake so tempting, and so costly.

Edwards and Magee, whose 1948 book defined most of these patterns, add a second warning: “a Reversal Pattern has to have something to reverse.” A double top after a small rise has little to reverse, so even a completed pattern may lead to only a small move.

If you want a daily routine that keeps you from acting on early guesses, the free 15-Minute Swing Trader’s Checklist is at the end of this post.

How do you confirm a double top or double bottom?

I use 3 confirmations, in this order:

  1. A close through the neckline. A candle has to close beyond the neckline, not just poke through it and snap back. Until then, the pattern does not exist.
  2. Volume that tells the same story. On a double top, the second peak usually comes on lighter volume than the first, a sign the buyers are tiring. On a double bottom, the classic signature is heavy volume on the first low, lighter volume on the second, and expanding volume on the breakout.
  3. A retest that holds. After the break, the price often comes back to the neckline. For a double top, the old support should now act as resistance. If the price climbs back above the neckline and stays there, the pattern has failed.

In my own trading, reversals are a small part of what I do and they carry the highest bar of any setup I take. One line in my own trading playbook reads: “easier to make money from strong up-trends than to buy reversals”. And another rule in the same playbook covers exactly this pattern: if the neckline has not broken, I do not anticipate it.

What is the price target for a double top?

The usual method is to measure the height of the pattern, from the peaks down to the neckline, and project that distance from the point where the neckline breaks.

Back to our example. The peaks are at 50 and the neckline is at 44, so the pattern is 6 points tall. If the price closes below 44, the rough target is 44 minus 6, which is 38. For a double bottom, you add the height to the breakout point instead.

Do note the cap that Edwards and Magee attached to reversal targets. A reversal cannot be counted on to move further than the trend it is reversing. If the stock only climbed from 45 to 50 before forming the pattern, a target of 38 is probably asking too much. The smaller of the 2 numbers is the safer guide. For how pattern targets fit with stops and support levels, see where to put your stop loss and take profit.

How is a double top different from a head and shoulders?

They are close relatives. A head and shoulders has 3 peaks, with the middle one highest, while a double top has 2 peaks at roughly the same height. Three peaks at roughly the same height make a triple top. All of them work on the same idea: a level the buyers fail to break, then a neckline that gives way.

The head and shoulders pattern has its own post, and our post on continuation and reversal patterns explains how to tell which family a shape belongs to. A related reversal shape with sloping lines is the rising wedge, covered in rising and falling wedge patterns. The full family lives in the price chart patterns guide.

Personally, I think the double top teaches patience better than any other pattern. The M is easy to see and hard to wait for. Every instinct says the second peak is the moment, when in fact it is only the question.

That stock sitting at 50 for the second time is asking whether the buyers have anything left. The neckline is where you get the answer.

FAQ

What is a double top pattern?

It is a bearish reversal pattern shaped like an M. The price makes 2 peaks at roughly the same level with a valley between them, and the pattern completes when the price closes below the valley low, called the neckline.

What is a double bottom pattern?

It is the bullish mirror image, shaped like a W. The price makes 2 lows at roughly the same level, and the pattern completes when the price closes above the high between them.

Is a double top bullish or bearish?

Bearish. It suggests an uptrend may be ending. A double bottom is bullish and suggests a downtrend may be ending.

How do you confirm a double top?

Wait for a candle to close below the neckline, check that volume was lighter on the second peak, and watch whether a retest of the neckline holds as resistance.

How do you calculate the target of a double top?

Measure the height from the peaks to the neckline and project it down from the breakout point. Treat it as a rough guide, and remember that a reversal cannot be counted on to move further than the trend it reversed.

Go deeper

The free 15-Minute Swing Trader’s Checklist has the daily routine, the questions to ask before every trade, and the five rules that keep you in the game.


About the author. Spencer Li is The 15-Minute Trader and the founder of Synapse Trading. He is a Certified Financial Technician (CFTe) with 15+ years of trading, run from 70+ countries. He holds a B.Acc and B.BM from SMU. Every trade he takes is public, dated, losses left in. He teaches rules-based swing trading in 15 minutes a day, one system for any market.

Educational content only, not personalised financial advice. Trading carries risk, including loss of capital. Past performance is not indicative of future results. Synapse Trading is not licensed or regulated by MAS.
by Spencer Li
https://synapsetrading.com/wp-content/uploads/2026/10/double-top-double-bottom-card.webp 630 1200 Spencer Li https://synapsetrading.com/wp-content/uploads/2026/10/synapse-logo-horizontal-light.png Spencer Li2026-10-02 17:14:532026-10-26 16:51:13Double Top and Double Bottom Patterns: How to Tell a Real One From an Early Guess
Spencer Li

The Turtle Trading Rules: What They Were, and Do They Still Work?

Trading Strategies & Systems
The Turtle Trading rules - trading strategies

The full rules from 1983, worked through on one trade, and an honest look at what has changed since

Published: 30 September 2026 · By Spencer Li, CFTe


In 1983, commodities trader Richard Dennis made a bet with his partner William Eckhardt. Dennis believed trading could be taught, and Eckhardt was not so sure. So Dennis hired a group of beginners, trained them for about two weeks, gave them real money, and called them his Turtles.

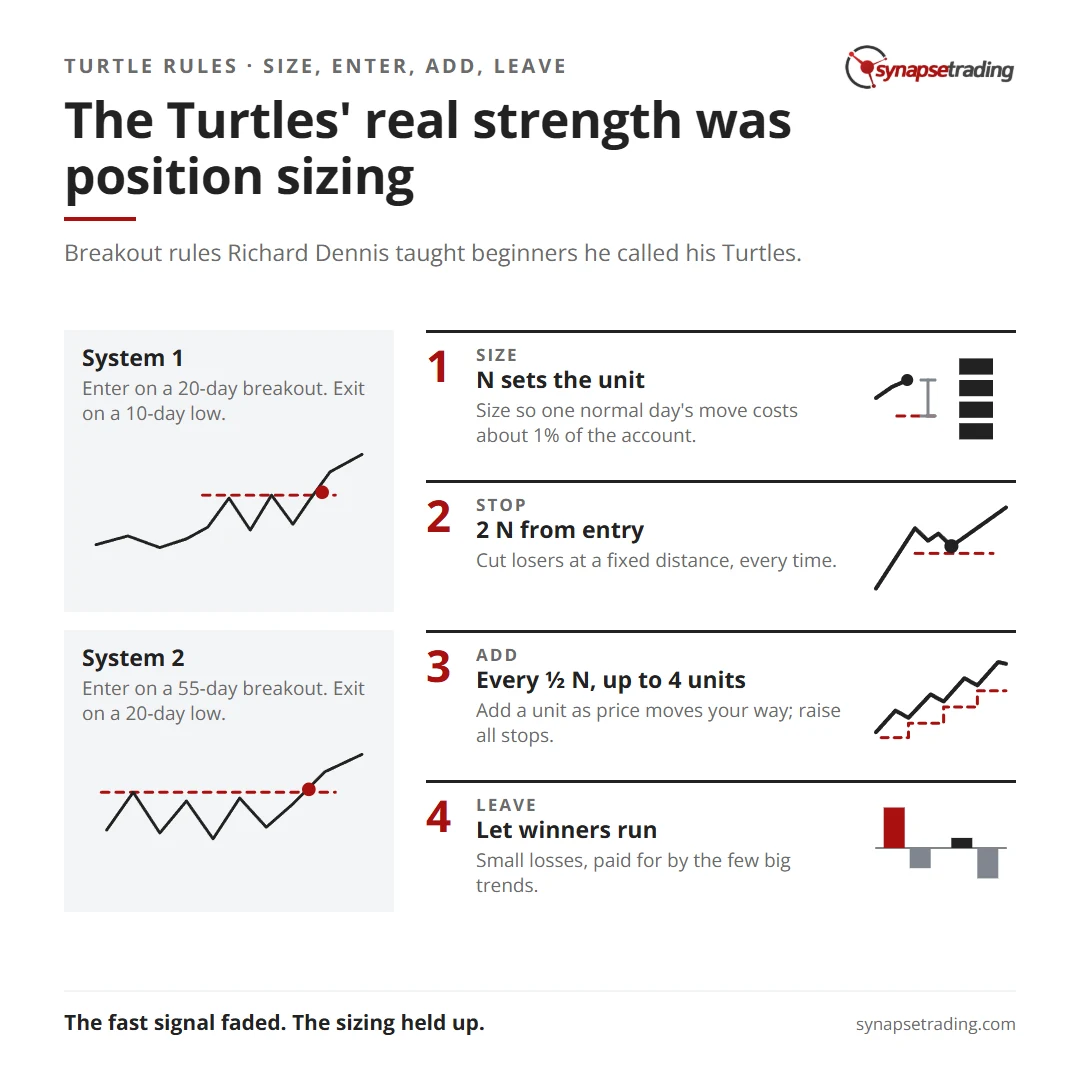
The rules they were taught are simple enough to fit on a few pages. The Turtles bought when a market broke above its highest price of the past 20 or 55 days, and sold short when it broke below the lowest. They sized every position by how much that market normally moved, so that one day’s typical move cost about 1% of the account. They cut losers at a fixed distance, added to winners in small steps, and exited only when price broke back through a 10 or 20-day low.

Do the rules still work? The slower version has held up far better than the fast one, and the original 20-day signal faded within a few years. Almost every writer who studied the system agrees its real strength was the position sizing. Here is the whole system in four parts: how they sized, entered, added and exited.

The Turtles' real strength was position sizing. Summary card for the post: The Turtle Trading Rules: What They Were, and Do They Still Work?.

Where do the turtle trading rules come from?

The rules most people quote come from a document called The Original Turtle Trading Rules, published in 2003 by Curtis Faith, one of the original Turtles. It is still free online, and it is the closest thing we have to a primary source.

The story itself has some fog around it. Eckhardt, asked about the bet in a 2011 interview, said: “Various eyewitnesses to this episode disagree.” He added a detail most retellings skip. More than half the course, he said, “revolved around developing the right attitude, guarding against debilitating emotions, how to think about risk.” And then: “Teaching the turtle system itself doesn’t take very long.”

Keep that in mind as you read the rules below, because by his account they took the least time to teach. If you want the man behind the experiment, our post with Richard Dennis’s trading tips covers his story and his best-known quotes.

Size: how did the Turtles size a position?

Everything starts with a number they called N. N is the average daily range of a market over the last 20 days, which most traders today know as the average true range, or ATR. Faith’s rules smooth it a little each day, but the idea is the same.

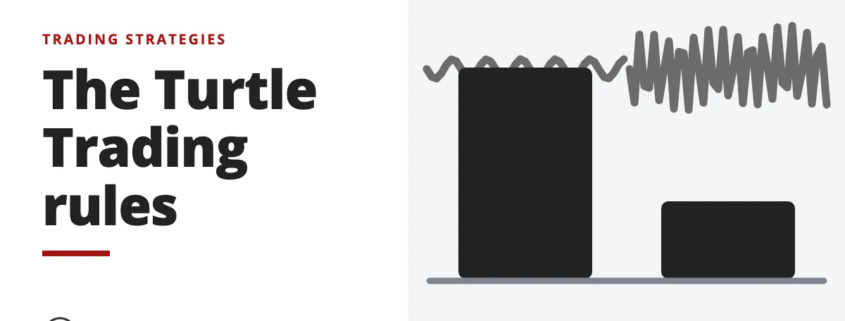
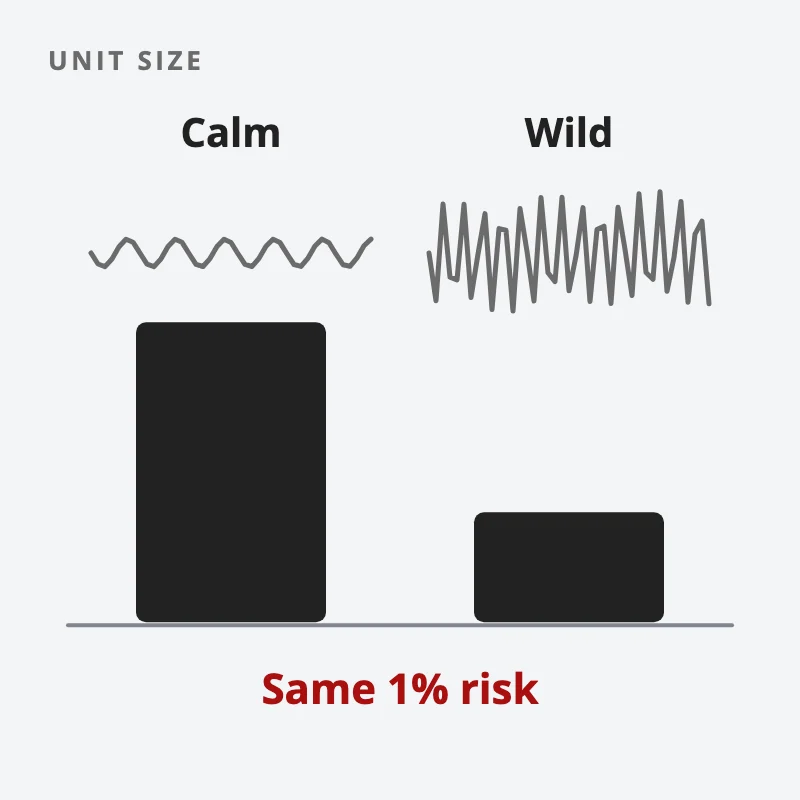
Then comes the unit. In Faith’s words: “Units were sized so that 1 N represented 1% of the account equity.” In plain terms, a unit is however many shares or contracts it takes for one normal day’s move to cost you 1% of your account. A calm market gets a bigger unit, and a wild one gets a smaller unit, so every position carries roughly the same risk.

A calm market gets a bigger unit and a wild market a smaller one, so each position carries the same 1% risk
Size each position so one normal day’s move costs about 1% of the account.

There were limits on how much the Turtles could hold at once:

  • 4 units in any single market
  • 6 units in closely correlated markets
  • 10 units in loosely correlated markets
  • 12 units in one direction, long or short

And there was a rule for bad runs. Each time the account fell 10%, the Turtles traded as if the account were 20% smaller. That rule shrinks your bets exactly when you are most likely to be wrong about your system. Our post on risk of ruin shows what that does over a long run.

Enter: what were the System 1 and System 2 entry rules?

The Turtles traded two systems, and the table below sets them side by side.

System 1 (shorter term)System 2 (longer term)
EntryPrice exceeds the 20-day high (long) or 20-day low (short)Price exceeds the 55-day high or 55-day low
Skip ruleSkip the signal if the last 20-day breakout would have been a winner, but take the 55-day breakout as a failsafeTake every breakout
Initial stop2 N from entry2 N from entry
AddingOne more unit every ½ N in your favour, up to 4 unitsSame
ExitPrice breaks the 10-day low (long) or 10-day high (short)Price breaks the 20-day low or 20-day high

The skip rule in System 1 confuses most people. Faith’s rules counted the last breakout as a loser if price “moved 2N against the position before a profitable 10-day exit occurred.” The idea was that a breakout right after a winning one was more likely to fail. But skipping risked missing a huge trend, which is why the 55-day breakout stayed as a backstop.

The Turtles entered the moment price traded through the level, without waiting for the close.

If you want a daily routine that keeps your own entries planned instead of rushed, our free 15-Minute Swing Trader’s Checklist walks through it. Get the free checklist →

Add: how did the Turtles add to winning trades?

They added one unit at a time as price moved their way, every half N, and moved the stops on all earlier units up so the whole position sat 2 N below the latest entry.

A trader on an algorithmic trading forum was coding the rules and wrote: “The part I am struggling with in understanding N and risk and position size.” It is the most common confusion, so here is one trade worked in full.

Say a hypothetical USD 100,000 account buys a stock breaking out at USD 100, and N is 2.50.

  • One unit: 1% of the account is USD 1,000, and 1,000 divided by 2.50 is 400 shares. That is USD 40,000 of stock, or 40% of the account.
  • The stop: 2 N is USD 5.00, so the stop sits at USD 95. If it is hit, 400 shares lose USD 5.00 each, which is 2% of the account.
  • The adds: further units go in at 101.25, 102.50 and 103.75, each half an N apart.
  • The new stop: with all four units on, every stop moves to 2 N below the last entry, which is 98.75.

Now the part that catches people out. If price falls straight back to 98.75, the four units lose 1.25, 2.50, 3.75 and 5.00 per share. Across 400 shares each, that is 0.5% + 1% + 1.5% + 2% of the account, or 5% in total, rather than 2%. That is the risk of a fully loaded position in one market.

And look at the size. Four units of this stock are worth 160% of the account. The Turtles traded futures, where that kind of exposure takes only a small margin deposit. On ordinary shares bought with cash, you simply cannot follow the rules at full size.

Leave: when did the Turtles exit?

Losers left at the 2 N stop, “each time, every time, without fail,” as Faith put it. Winners left only when price broke back through a 10-day low for System 1, or a 20-day low for System 2.

That exit is the hard part, and Faith says so directly: “Waiting for a 10 or 20 day new low can often mean watching 20%, 40% even 100% of significant profits evaporate.” Most breakouts fail, so most Turtle trades were small losses. The system only worked because the few big trends were held long enough to pay for all of them. Take profits early, and the arithmetic falls apart. Our post on trend following shows why this style feels wrong most of the time, even when it is working.

Do the turtle trading rules still work today?

The slow parts have aged far better than the fast parts.

The fast signal faded first. Van Tharp, writing in 1998, noted that the Turtles started with 20-day breakouts and moved to 40-day ones as the 20-day signal decayed. Perry Kaufman later tested a version of the rules on copper from 1980. The faster system, he found, “shows profits only for the first part of the 1980s, the period in which Dennis would have decided to form the Turtles.” The slower one “shows steady profits for the entire 38 years.”

Costs are the second problem. A trader asked online in late 2025, “Why do breakout strategies collapse after fees?” The honest answer is that a short breakout system trades often and loses often, so every commission and every bit of slippage comes out of a thin margin. That is why a false breakout hurts a 20-day system far more than a slow one.

And the market matters. The Turtles traded a wide basket of futures, from bonds to coffee, which can trend for months. A single stock or a stock index fund does not offer that variety.

What has held up is the sizing. Tharp was blunt. “The success of the Turtles’ trading had much more to do with their position-sizing algorithm, as is usually the case, than it did the fact that they traded a channel breakout system.”

For most traders, that is the lesson worth keeping from the experiment. Sizing every trade by volatility, limiting how much you hold, cutting your size after a losing run and letting winners run are habits that work across almost any system, including a much slower one.

So, if you tried to follow the Turtle rules tomorrow, which part would you break first? Would it be the 2 N stop, the adds, or watching half your profit disappear while you wait for the 20-day low? For more on building a system you can actually follow, see the guide to trading strategies.

FAQ

What are the turtle trading rules?

They are the rules Richard Dennis taught his Turtle traders in 1983. Buy 20 or 55-day breakouts, and size each position so a normal day’s move costs about 1% of the account. Stop out at 2 N, add every ½ N up to 4 units, and exit on a 10 or 20-day reverse breakout.

What is N in turtle trading?

N is the 20-day average true range of a market, a measure of how much it typically moves in a day. It sets both the position size and the stop distance.

Did the turtle traders make money?

Several of the original Turtles went on to long trading careers, and the experiment is widely told as a success. Eckhardt himself noted that eyewitness accounts of the original bet disagree.

Does the turtle trading strategy work on stocks?

The rules can be applied to stocks, but they were built for a broad basket of leveraged futures. On cash stocks, full Turtle size is often more than the account can hold, and a single stock offers less variety of trends.

Where can I read the original turtle trading rules?

Curtis Faith published The Original Turtle Trading Rules free in 2003. His 2007 book Way of the Turtle covers the same rules with more background.

Go deeper

The Turtles proved that rules can be taught, and that following them is the hard part. The free 15-Minute Swing Trader’s Checklist has the daily routine, the questions to ask before every trade, and the five rules that protect your account.


About the author. Spencer Li is The 15-Minute Trader and the founder of Synapse Trading. He is a Certified Financial Technician (CFTe) with 15+ years of trading, run from 70+ countries. He holds a B.Acc and B.BM from SMU. Every trade he takes is public, dated, losses left in. He teaches rules-based swing trading in 15 minutes a day, one system for any market.

Educational content only, not personalised financial advice. Trading carries risk, including loss of capital. Past performance is not indicative of future results. Synapse Trading is not licensed or regulated by MAS.
by Spencer Li
https://synapsetrading.com/wp-content/uploads/2026/10/turtle-trading-rules-card.webp 630 1200 Spencer Li https://synapsetrading.com/wp-content/uploads/2026/10/synapse-logo-horizontal-light.png Spencer Li2026-09-30 23:17:432026-10-27 17:06:23The Turtle Trading Rules: What They Were, and Do They Still Work?
Spencer Li

Breakout Trading: How to Tell a Real Breakout From a False One

Trading Strategies & Systems
Real or false breakout? - price action

Last updated: 16 October 2026 · By Spencer Li, CFTe


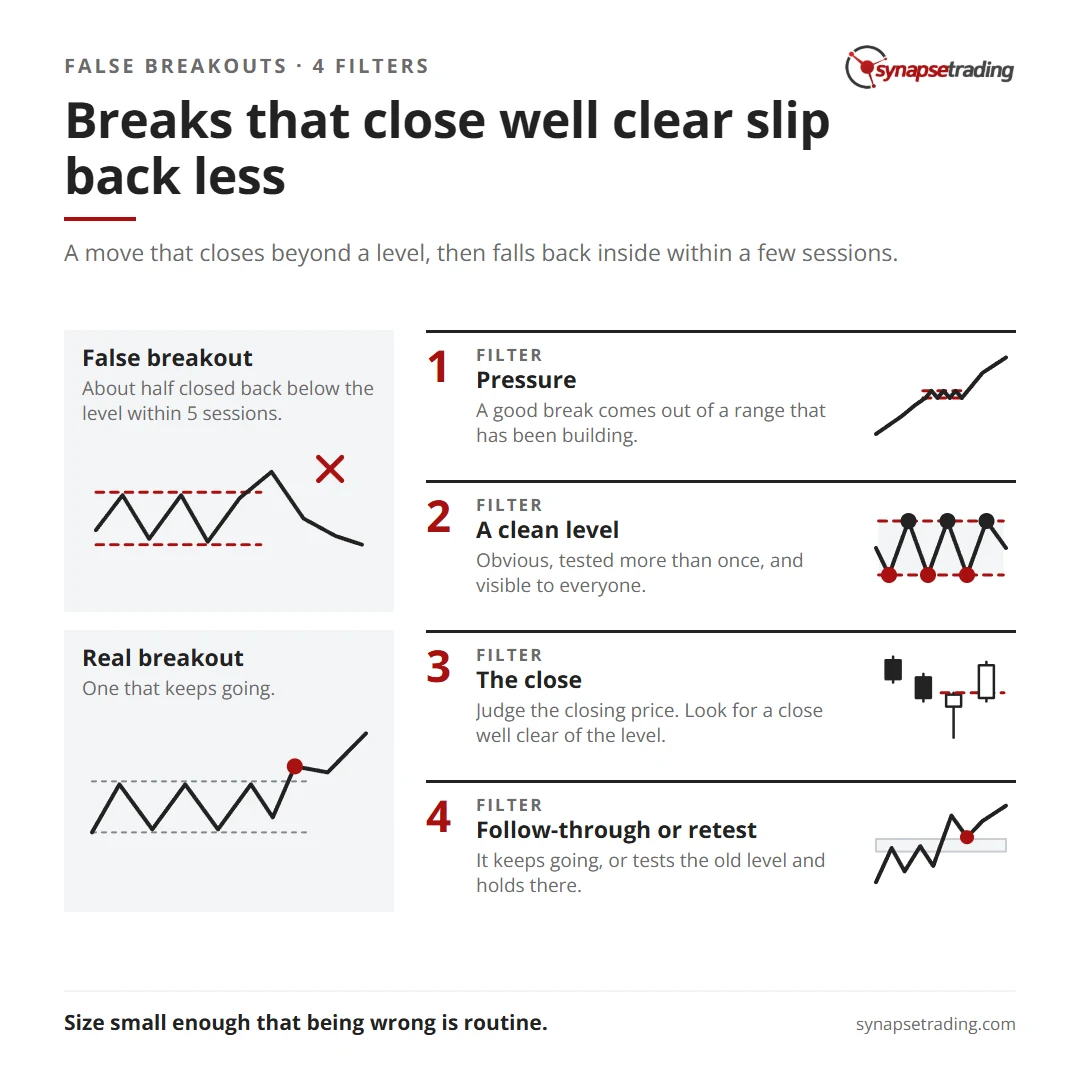
A false breakout is a move that closes beyond a support or resistance level and then falls back inside within a few sessions, trapping the traders who bought or sold the break. A real breakout is one that keeps going. You cannot tell them apart on the day, but you can stack the odds by checking 4 things before you trust a break.

False breakouts are not rare. In 26 years of daily data, about half of all breakouts to a new 20-day high closed back below the level within 5 sessions: 56% on the S&P 500 and 52% on gold. That is the baseline any breakout trader starts from.

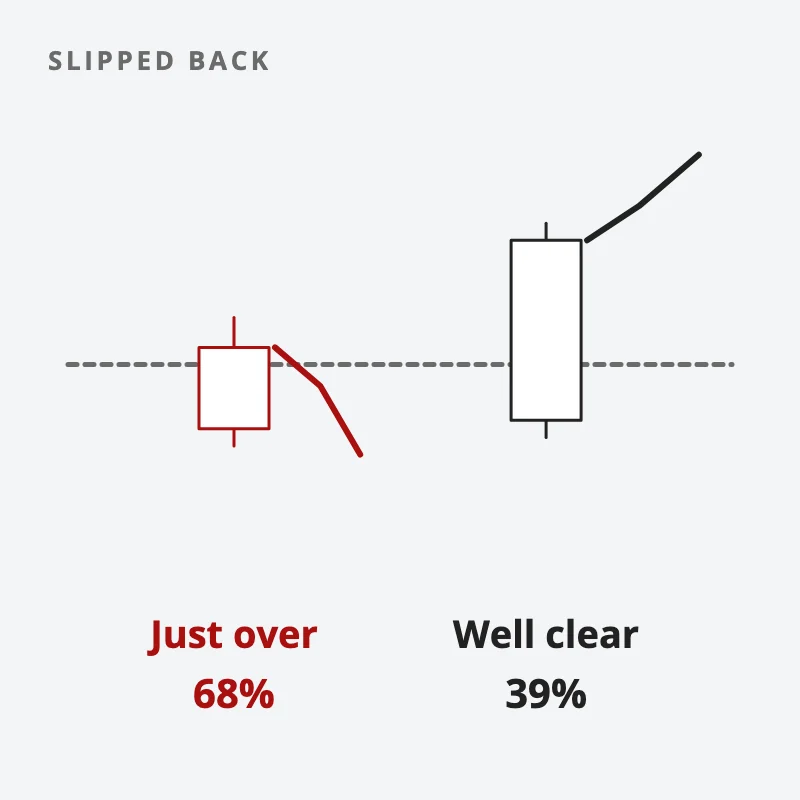
But the failures were not spread evenly. A break that closed only just above the level slipped back about 68% of the time. A break that closed well clear of it slipped back about 39% of the time. In this post, I’ll show you what the data says and the 4 filters I use to sort one from the other.

Breaks that close well clear slip back less. Summary card for the post: Breakout Trading: How to Tell a Real Breakout From a False One.

What is a false breakout?

Think of a door that looks open. You walk through, and it swings shut behind you.

A breakout happens when price moves through a level that has held for a while, usually the top or bottom of a range. Buyers pile in on the way up, and stop orders fire above the old high. If no new buying follows, price drifts back inside. The traders who bought the break are now holding a loss, and their selling pushes price lower still.

Some traders call it a fake-out or a bull trap. In our guide to trading strategies, the setup that trades breaks is called Break, and false breakouts are its main way of failing.

How often do breakouts fail?

I counted. I took the S&P 500 index and gold from 2000 to 2025 and marked every first daily close above the highest high of the previous 20 sessions. Then I checked whether price closed back below that level soon after.

Breakouts to a new 20-day high, 2000 to 2025S&P 500Gold
Breakouts counted501388
Closed back below the level within 5 sessionsabout 56%about 52%
Closed back below the level within 10 sessionsabout 68%about 63%

So roughly half of all breakouts slipped back inside within a week, which is the plain base rate before any skill is applied, and it is the number any breakout plan has to beat. If your plan is to buy every break and hope, you are starting from a coin flip.

Do note that “slipped back” does not always mean “failed for good”. Of the S&P 500 breaks that slipped back within a week, about 91% later closed above the breakout day’s close within 20 sessions. For gold it was about 80%. Many false breakouts are really shakeouts. The damage is mostly done to traders whose exit sat just under the level, who were shaken out at a loss before the move they were right about finally happened.

What separates a real breakout from a false one?

The clearest difference in the data was the close itself. I sorted the same breakouts by how far the breakout day closed above the level, measured in units of the market’s normal daily range (its Average True Range).

How far the breakout closed above the levelS&P 500, closed back below within 5 sessionsGold, closed back below within 5 sessions
Less than a quarter of a normal day’s rangeabout 68%about 69%
A quarter to half a day’s rangeabout 54%about 56%
Half a day’s range or moreabout 39%about 39%

The pattern held on both markets. A break that barely closes over the line is a poke with a slightly better close. A break that closes well clear of it shows that buyers were still in control at the end of the day. That is the same idea behind our post on why you should decide on the closing candle.

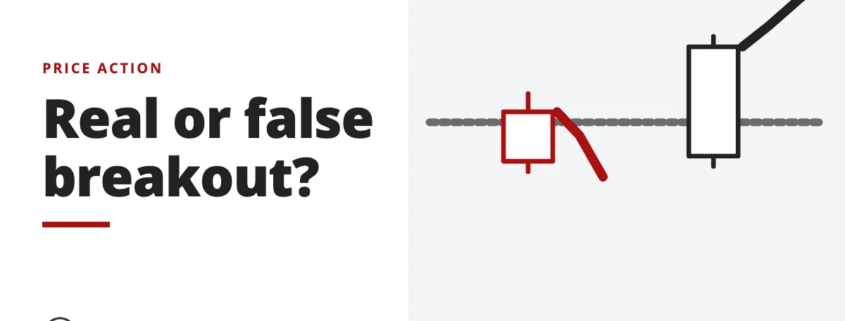
Two breakouts above a level: one closes just over it and slipped back 68% of the time, one closes well clear and slipped back 39% of the time
A break that closes well clear of the level slips back far less often.

What are the 4 breakout filters?

I call these the 4 breakout filters. None of them guarantees anything. Each one tilts the odds a little, and together they cut out most of the low-quality breaks.

  1. Pressure. A good break comes out of a range that has been building, often a tight one, like a rectangle or a triangle. In my count this helped clearly on the S&P 500, where breaks from the tightest third of ranges slipped back about 46% of the time against 62% for the widest. On gold it made no difference at all, so I treat it as a helper that improves a setup rather than a rule that decides one.
  2. A clean level. The level should be obvious, tested more than once, and visible to everyone. A break of a level nobody is watching brings in nobody new. Our post on support and resistance covers how to draw one.
  3. The close. Judge the break on the closing price, not the intraday high, and look for a close well clear of the level. This was the strongest filter in the data.
  4. Follow-through or a retest. A real break usually keeps going over the next session or two, or comes back to test the old level and holds there. That retest is the pattern in role reversal, where old resistance becomes new support.

Personally, I care most about the third and fourth. The first 2 tell me whether a break is worth watching. The last 2 tell me whether it is worth trusting.

If you want these filters as part of a short daily routine, they are in the free checklist at the end of this post.

How do you avoid getting trapped by false breakouts?

You cannot avoid them completely. You can make them cheaper.

  • Wait for the close. Most traps happen inside the day. A trader who only acts after the close never buys a poke that reverses before the close.
  • Size for the slip. If about half of breaks slip back at least once, your exit has to allow for that, and your position has to be small enough that being wrong is routine. Our post on where to put a stop loss covers the thinking.
  • Skip breaks into chop. Breakouts struggle in markets that keep reversing. When the whole market is choppy, trading less is often the best filter of all, which is the subject of how to trade a choppy or volatile market.

Some traders turn the problem around and trade the failure itself, buying or selling as price snaps back inside the range. That is a form of mean reversion, with its own risks.

Where do breakouts fit with other strategies?

A breakout is often the first step of a new trend, which is why trend following rules frequently enter on a break to a new high. Our post on the types of trading strategies sets Break next to Swing, Bounce and Turn: each one needs a different kind of market.

In a fast, news-driven market, breaks can run far very quickly, and they can also reverse just as quickly. Our older post on trading fast markets covers why staying out is often the better choice there.

A breakout is a door that looks open. The 4 filters will not tell you which doors stay open, but they will keep you away from most of the ones that are about to swing shut.

FAQ

What is a false breakout?

It is a move that closes beyond a support or resistance level and then falls back inside within a few sessions. Traders who bought or sold the break are trapped, and their exits often push price further the other way.

How common are false breakouts?

Common. Over 2000 to 2025, about 56% of breakouts to a new 20-day high on the S&P 500, and about 52% on gold, closed back below the level within 5 sessions.

How do you confirm a breakout?

Look at the close. Breaks that closed well clear of the level, by half a day’s normal range or more, slipped back about 39% of the time in 26 years of S&P 500 and gold data. Breaks that closed only just over it slipped back about 68% of the time.

Does volume confirm a breakout?

Rising volume is often used as a sign of real buying behind the break, and many traders check it. I did not test it in this count, so I would treat it as one input among several rather than a confirmation on its own.

Should I buy a breakout or wait for a retest?

Both are common. Buying the break catches the moves that never look back. Waiting for a retest gives a clearer level to be wrong at, but you will miss the breaks that do not come back.

Go deeper

The free 15-Minute Swing Trader’s Checklist has the daily routine, the questions to ask before every trade, and the five rules that keep you in the game.


About the author. Spencer Li is The 15-Minute Trader and the founder of Synapse Trading. He is a Certified Financial Technician (CFTe) with 15+ years of trading, run from 70+ countries. He holds a B.Acc and B.BM from SMU. Every trade he takes is public, dated, losses left in. He teaches rules-based swing trading in 15 minutes a day, one system for any market.

Educational content only, not personalised financial advice. Trading carries risk, including loss of capital. Past performance is not indicative of future results. Synapse Trading is not licensed or regulated by MAS.
by Spencer Li
https://synapsetrading.com/wp-content/uploads/2026/10/false-breakouts-card.webp 630 1200 Spencer Li https://synapsetrading.com/wp-content/uploads/2026/10/synapse-logo-horizontal-light.png Spencer Li2026-09-29 08:06:012026-10-26 16:51:17Breakout Trading: How to Tell a Real Breakout From a False One
Spencer Li

Should You Wait for the Candle to Close? Why the Close Is the Price That Counts

Technical Analysis & Price Action
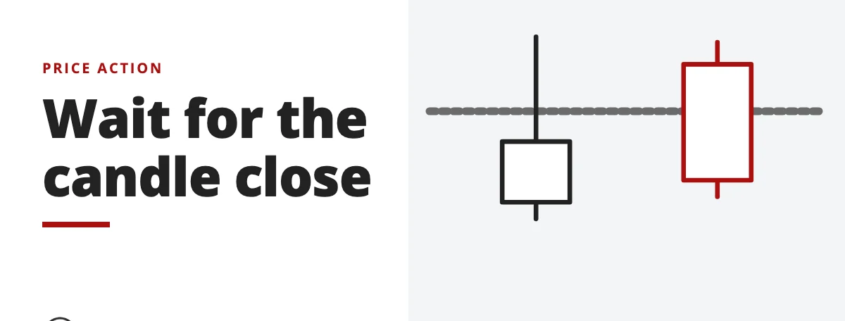
Wait for the candle close - price action

Last updated: 18 October 2026 · By Spencer Li, CFTe


Yes. For most swing traders, waiting for the candle to close is the better habit. The close is the price the market settled on after a full period of buying and selling, while a mid-candle price is only where the fight stood at that moment.

Here is the evidence I found. On the S&P 500, from 2000 to 2025, there were 1,386 days when price traded above its highest point of the previous 20 days. About 42% of those days closed back below that level. On gold it was about 34%. A trader who acted at the moment of the break was wrong-footed roughly 1 time in 3 to 2 times in 5, and the close would have told him so the same evening.

Waiting has a cost too. You give up a little price, and occasionally a move. In this post, I’ll show you both sides, with the numbers.

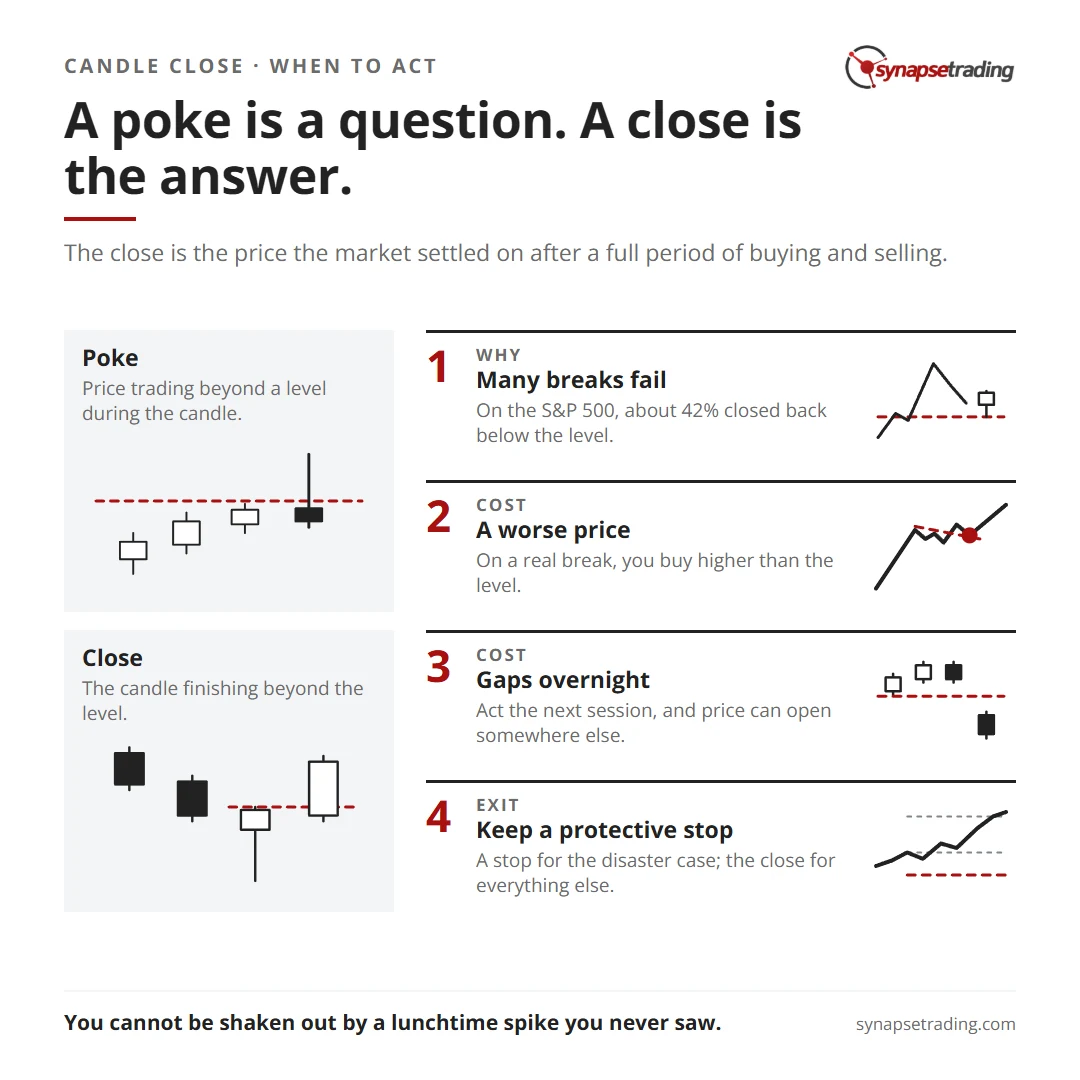
A poke is a question. A close is the answer. Summary card for the post: Should You Wait for the Candle to Close? Why the Close Is the Price That Counts.

Why does the close matter more than the high?

Picture a stock pushing through a ceiling at lunchtime. The screen turns green, the breakout looks clean, and a few people buy. By the close, sellers have pushed it back down, and the candle finishes below the ceiling with a long upper wick.

The high of that candle was real. Someone did trade there. But the close is where the whole day’s argument between buyers and sellers finally settled, after the news, the lunchtime excitement and the late selling had all been absorbed, and on that day the sellers won.

That is why our price action trading guide puts it as Layer 4, the candle that commits you, and its one rule is to decide on closed candles. Our post on how to read a price bar shows how the open, high, low and close fit together inside one candle.

How often does a break fail by the close?

I wanted to see how much of this is folklore, so I tested it. I took 2 markets with long daily histories, the S&P 500 index and gold, and used one simple level: the highest high of the previous 20 sessions. Then I asked 2 questions about every day that traded above that level.

  1. Did the day close back at or below the level?
  2. On the days that did close above, how much higher than the level was the close?
Market, 2000 to 2025Days that traded above the 20-day highClosed back at or below itMedian close above the level, when it held
S&P 500 index1,386about 42%about 0.3%
Gold1,001about 34%about 0.5%

Read the 2 columns together, because they are the whole trade-off.

The third column is what waiting saves you. On the index, more than 4 in 10 of those breaks were gone by the close. Anyone who bought the moment price poked through was holding a position the market had already rejected.

The last column is what waiting costs you. When the break was real, the close was usually only a little above the level, about 0.3% on the index and 0.5% on gold. That is roughly a third to a half of a normal day’s range. So the price you give up for patience is small next to the share of fake breaks it filters out.

Do note the limits. This is 2 markets, 1 level and daily candles, and a different level would give different numbers. What I would expect to hold across settings is the shape: a large share of intraday breaks fail by the close, and the real ones usually close only a little beyond the level.

Poke or close: what are you actually looking at?

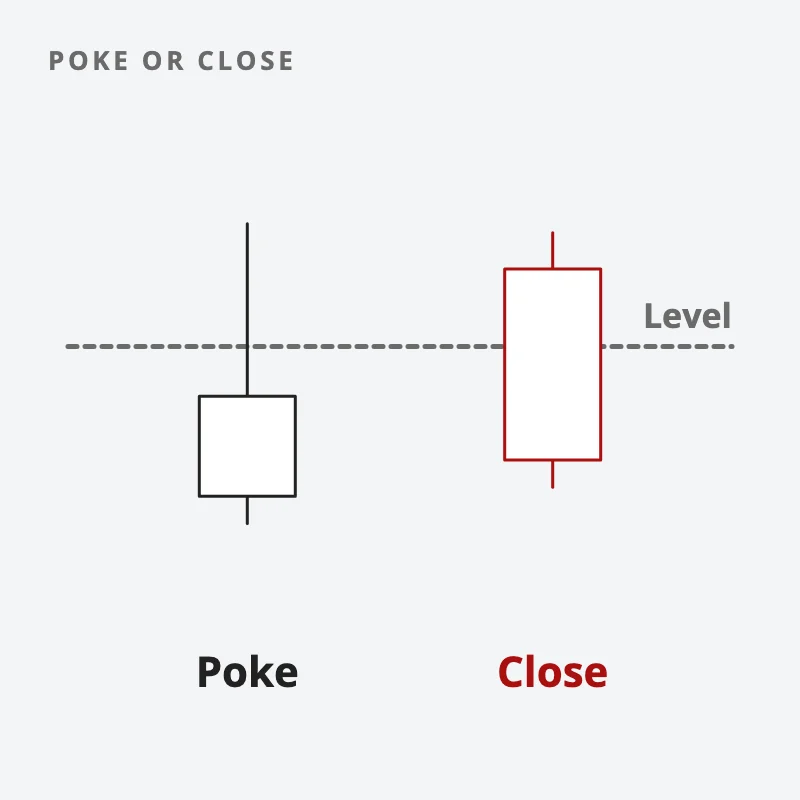
I find it helps to give the 2 events different names, so you never confuse them. A poke is price trading beyond a level during the candle. A close is the candle finishing beyond it.

A poke is a question. A close is the market’s answer.

Two candles at a level: one pokes above it with a wick but closes back below, the other closes above the level
A poke through a level is only a question; the close is the market’s answer.

A common painful trade is a poke treated as a close. The trader buys the poke above resistance, the candle closes back inside, and the next morning he is holding a failed breakout with no plan. Their stop-entry orders make it worse, because a buy-stop just above a level fills on the poke, before anyone knows how the day will end.

If you want a routine for reading the close, the 15 minutes I spend after it are in the free checklist at the end of this post.

When does waiting for the close cost you?

There are 3 honest costs, and you should know them before you adopt the rule.

  1. A worse price. On a real break, you buy higher than the level. In the test above, that gap was usually a fraction of a day’s range.
  2. The occasional runaway. Some breakouts close far above the level, and some keep going the next morning without looking back. You will miss a few of those, and that will hurt.
  3. Gaps overnight. If you decide at the close and act the next session, price can open somewhere else entirely. That risk comes with holding through the night, and it is part of swing trading.

Is it ever right to act before the close? For some styles, yes. Day traders work on 5-minute or 15-minute candles, and each of those closes many times a day. The principle is the same, only the candle is shorter. Our comparison of swing trading versus intraday trading covers which rhythm fits which life.

Does the closing candle rule apply to exits too?

It applies to judgement. If your reading of a trade was “this level should hold”, the close is the fairest test of whether it did. A wick through the level at lunchtime that closes back above it has not proven you wrong.

But be careful with this. A close-based decision is a judgement made once a day, and a market can fall a long way before the close. Many traders keep a protective stop in the market for the disaster case, and use the close for everything else. How you set that stop is its own subject, covered in where to put your stop loss and take profit.

Why does this suit people with jobs?

On a daily chart, the candle closes once a day, so you can read it in the evening, with the whole day’s information already inside the candle and no screen to stare at while you are supposed to be working.

Personally, I read mine after the close, in about 15 minutes, and most days the answer is to do nothing. The close takes the most stressful part of trading, the intraday flicker, and removes it from the decision. You cannot be shaken out by a lunchtime spike you never saw.

It also stacks with the other layers. A close above a broken level is the “hold” in role reversal. A close below the last higher low is the first warning in market structure. And the close is the first filter for false breakouts. Candlestick patterns depend on it too, because a pattern that has not closed is not yet a pattern, one of the points in the wrong way to trade candlestick patterns.

Go back to the lunchtime breakout. The buyer who waited until the evening saw the long upper wick, closed the chart, and went to dinner with nothing to fix.

FAQ

Should you wait for the candle to close before entering a trade?

For swing traders, usually yes. In a test on 26 years of daily data, about 42% of moves above a 20-day high on the S&P 500 closed back below it the same day. Waiting for the close filtered those out at a small cost in price.

What is a candle close confirmation?

It means acting only after a candle has finished beyond a level, rather than when price first trades through it. The close shows where buyers and sellers settled after the whole period.

What does it cost to wait for the close?

A slightly worse price on real breaks, and the occasional move that runs away without you. In the test above, the close on a real break sat a median of about 0.3% above the level on the S&P 500 and about 0.5% on gold.

Does waiting for the close work on lower timeframes?

The principle is the same on any timeframe, since every candle has a close. Shorter candles close more often, so you get more signals and more noise, and you need to be at the screen.

What is a wick through support or resistance?

It is a part of the candle that traded beyond the level and was pushed back before the close. A wick through a level with a close back inside often means the break was rejected.

Go deeper

The free 15-Minute Swing Trader’s Checklist has the daily routine, the questions to ask before every trade, and the five rules that keep you in the game.


About the author. Spencer Li is The 15-Minute Trader and the founder of Synapse Trading. He is a Certified Financial Technician (CFTe) with 15+ years of trading, run from 70+ countries. He holds a B.Acc and B.BM from SMU. Every trade he takes is public, dated, losses left in. He teaches rules-based swing trading in 15 minutes a day, one system for any market.

Educational content only, not personalised financial advice. Trading carries risk, including loss of capital. Past performance is not indicative of future results. Synapse Trading is not licensed or regulated by MAS.
by Spencer Li
https://synapsetrading.com/wp-content/uploads/2026/10/wait-for-candle-close-card.webp 630 1200 Spencer Li https://synapsetrading.com/wp-content/uploads/2026/10/synapse-logo-horizontal-light.png Spencer Li2026-09-28 13:44:532026-10-26 16:51:19Should You Wait for the Candle to Close? Why the Close Is the Price That Counts
Page 3 of 106‹12345›»

Free checklist

The 15-Minute Swing Trader’s Checklist

The daily and weekly routine I use to find, manage and review trades in about 15 minutes a day, trading since 2007.

Get the free checklist

Topics

  • Trading foundations
  • Technical analysis
  • Strategies and systems
  • Risk and money
  • Trading psychology
  • Markets and products

Synapse Trading

Swing trading for busy professionals, in 15 minutes a day.

Start free

Learn

  • Start here
  • Free trading guides
  • Blog
  • Tools and resources

Programs

  • Trading Mastery Program
  • Daily trading signals
  • Student results
  • Public trade log

Company

  • About
  • Contact me
  • Partnerships
  • Disclaimer
  • Privacy policy
  • Terms & Conditions

Synapse Trading Pte Ltd
Registration No. 201316168H
WhatsApp +65-8897-1204
info@synapsetrading.com

Contact Us

Synapse Trading Pte Ltd
Registration No. 201316168H

Whatsapp: +65-8897-1204
Telegram: @iamrecneps
Email: info@synapsetrading.com

Links

Disclaimer
Privacy policy
Terms & Conditions
Contact us
Partnerships

© 2012-2026 Synapse Trading | All rights reserved. Educational content only, not personalised financial advice. Trading carries risk, including loss of capital. Past performance is not indicative of future results. Synapse Trading is not licensed or regulated by MAS.
  • Link to Facebook
  • Link to X
  • Link to Instagram
  • Link to Youtube
  • Link to LinkedIn
  • Link to Mail
Scroll to top Scroll to top Scroll to top