Last quarter, markets grappled with the unintended consequences of pandemic-related decisions, including high inflation and an unanticipated banking crisis. This crisis resulted from aggressive lending, a two-tiered stress test system, and a sharp rise in interest rates impacting bond prices.
Inflation remains persistently high, and the likelihood of a recession has increased. Despite these concerns, the stock market ended Q1 2023 up approximately 6%. The market is currently factoring in a mild recession, a lessening of inflation, and the expectation that the banking crisis will be managed and contained.
However, rising international tensions present a wild card that could quickly shift the market’s outlook.
In the upcoming week, investors should watch inflation, the banking crisis, and any developments related to international tensions, while remaining patient as long-term investors.
For more real-time updates and trading opportunities, check out our “Daily Trading Signals” Telegram channel!

[Photo: Antalya, Turkey – See my full travel photo log!]
For our weekly market wrap, we go through some of the trade calls and analysis from last week, which gives us valuable insights for the week ahead.
We cover 3 main markets with a total of 200+ counters, so we will never run out of trading opportunities:
- Forex, CFDs, commodities, bonds
- US stocks, ETFs, global stock indices
- Cryptocurrencies, crypto indices
By covering a broad range of markets, we can focus our attention (and capital) on whichever market currently gives the best returns.
Table of Contents
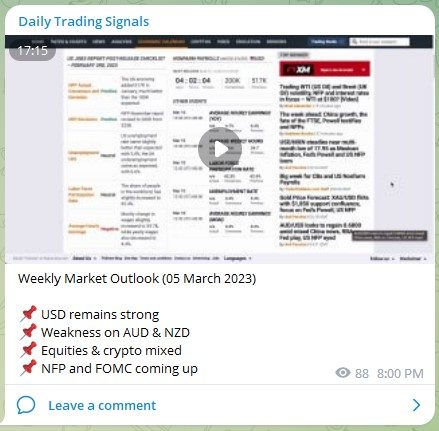
Weekly Market Outlook Video
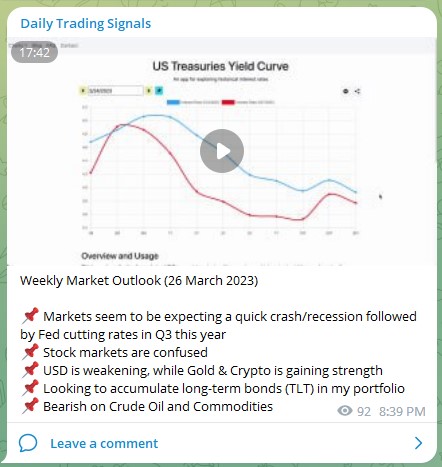
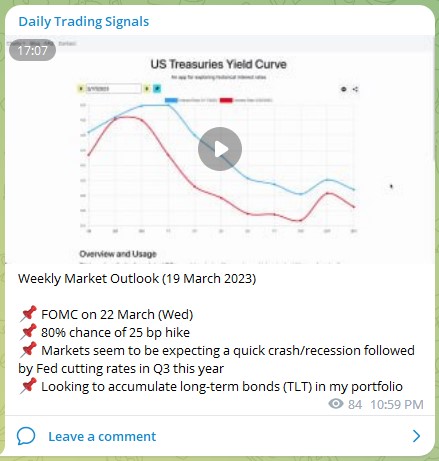
Weekly Market Outlook (26 March 2023)
📌 Markets seem to be expecting a quick crash/recession followed by Fed cutting rates in Q3 this year
📌 Stock markets are confused
📌 USD is weakening, while Gold & Crypto is gaining strength
📌 Looking to accumulate long-term bonds (TLT) in my portfolio
📌 Bearish on Crude Oil and Commodities
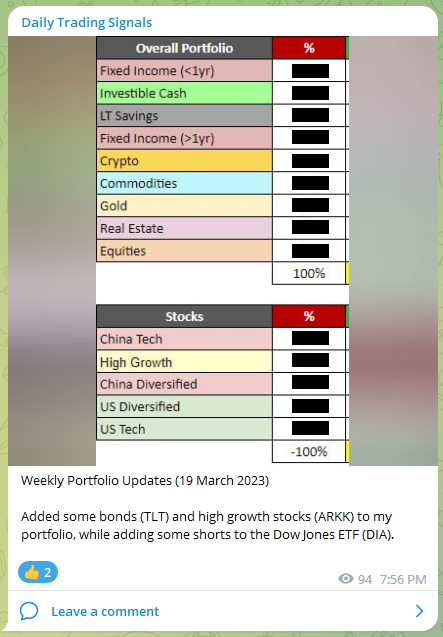
Portfolio Highlights

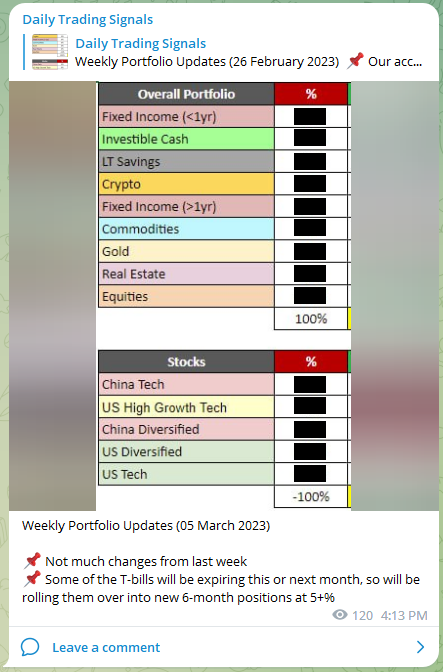
Weekly Portfolio Updates (26 March 2023)
Added more bonds (TLT) to my portfolio.
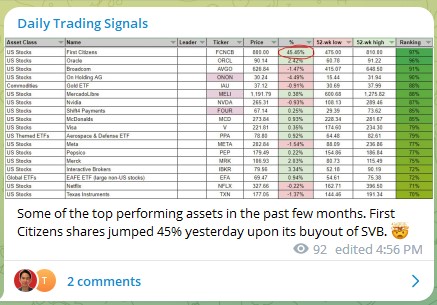
Some of the top performing assets in the past few months. First Citizens shares jumped 45% yesterday upon its buyout of SVB. 🤯
Forex & Commodities Market Highlights
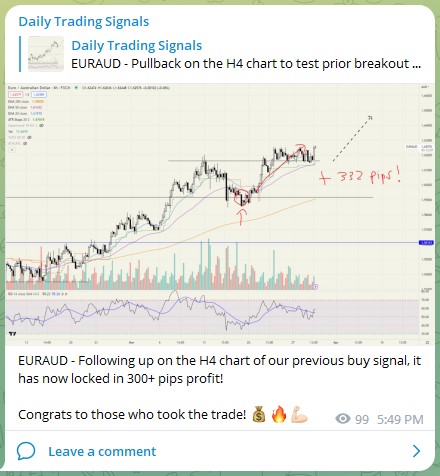
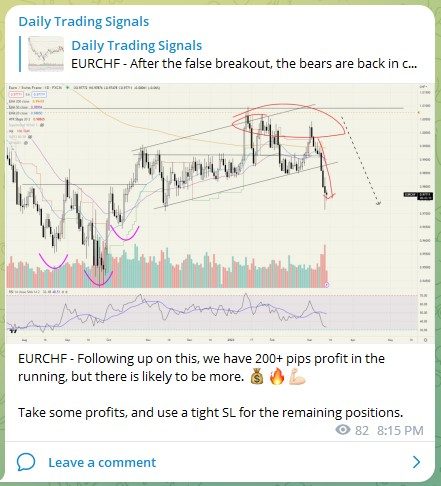
EURAUD – Following up on the H4 chart of our previous buy signal, it has now locked in 300+ pips profit!
Congrats to those who took the trade! 💰🔥💪🏻
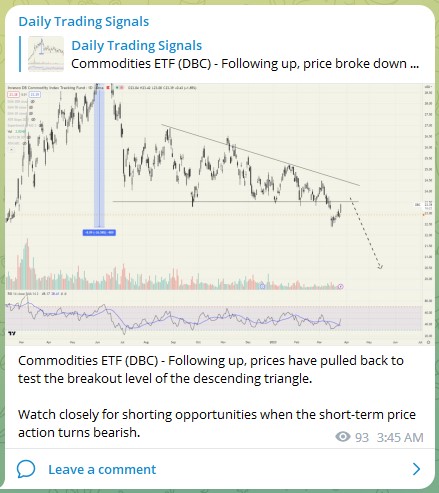
Commodities ETF (DBC) – Following up, prices have pulled back to test the breakout level of the descending triangle.
Watch closely for shorting opportunities when the short-term price action turns bearish.
Stock & Bond Market Highlights

S&P 500 (US500) – Prices have been creeping up slowly, but volume has been drying up.

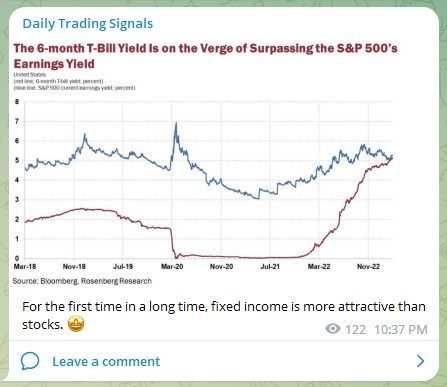
US 20-yr Treasury Bond ETF (TLT) – If the Fed is not going to raise interest rates much more, then it is very unlikely for this to break new lows.
In fact, the market is expecting the Fed to start cutting rates in Q3 or Q4 this year, which would mean higher bond prices.
My plan is to gradually accumulate this and hold it till the end of the year.
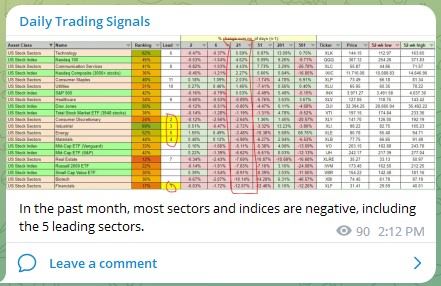
In the past month, most sectors and indices are negative, including the 5 leading sectors.
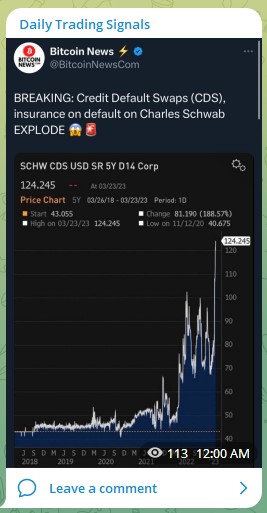
Breaking: Credit Default Swaps (CDS), insurance on default on Chrales Schwab EXPLODE.
1/ 🧵 #Inflation or #recession: what's the main concern for central banks? Will the Fed cut or raise rates? Is it too late to change course now? pic.twitter.com/IqmSskG1ig
— Spencer Li (Synapse Trading) (@SynapseTrading) March 27, 2023
1/ 🧵 A record amount of commercial mortgages expiring in 2023 could test the financial health of small and regional banks.
Will this be the next domino after the banking crisis? #fomc #trading #investing
— Spencer Li (Synapse Trading) (@SynapseTrading) March 26, 2023
Crypto Market Highlights

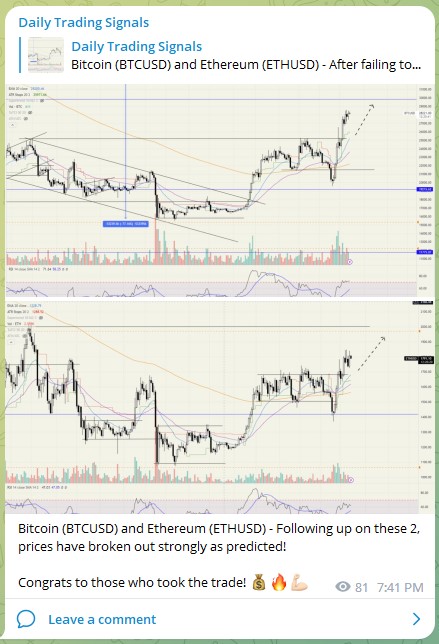
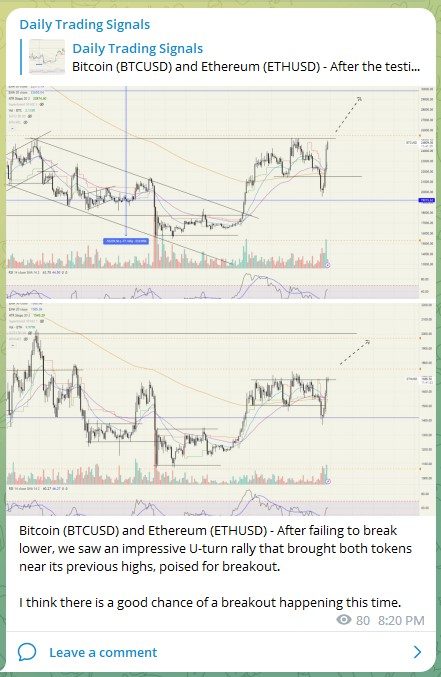
Ethereum (ETHUSD) – Prices finding some support here.
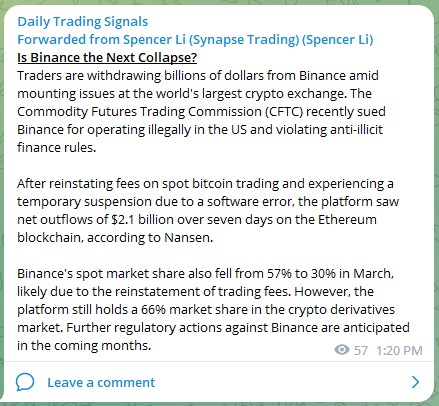
Is Binance the Next Collapse?