• Link to Facebook
  • Link to X
  • Link to Instagram
  • Link to Youtube
  • Link to LinkedIn
  • Link to Mail
Synapse Trading
  • Home
  • About
    • My Background
    • My Trading Journey
    • My Travel Log
    • Media & Interviews
  • Mentoring
    • Trading Mastery Program
    • Results & Testimonials
  • Signals
    • Telegram (Free to join!)
    • Daily Trading Signals
    • Daily Trading Signals (Results)
  • Resources
    • Free Trading Guides
    • Tools & Resources
    • Blog & Infographics
  • Contact
    • Contact Us
    • Partnership Opportunities
  • Click to open the search input field Click to open the search input field Search
  • Menu Menu
Spencer Li

Explaining the Debt Ceiling: What Happens in A Default?

Economics & News Trading
Thumbnail Explaining the Debt Ceiling

What Is the Debt Ceiling, and What Happens If the US Defaults?

Last updated: 3 July 2026 · By Spencer Li, CFTe


The debt ceiling is the legal cap on how much the US Treasury can borrow to pay for spending Congress has already approved. When borrowing nears the cap, Congress has to vote to raise or suspend it, or the government runs out of room to pay its bills. If the ceiling is breached and the US defaults, the Treasury would have to prioritise some payments over others, interest rates would likely spike, the bond market and stock market could panic, and credit agencies could downgrade US debt. The good news: an actual default has never happened, because Congress has raised the ceiling more than 70 times since 1960, usually after some political brinkmanship and a last-minute deal. The risk that gets priced into markets is rarely the default itself. It is the uncertainty in the weeks before the deal.

Here is what the debt ceiling is, why the US debt got so big, what a real default would do, and whether the ceiling should exist at all.

What is the debt ceiling and why does it matter?

The debt ceiling is the maximum amount the US Treasury is legally allowed to borrow to meet obligations the government has already committed to.

The mechanics are simpler than the headlines suggest. The government raises money through taxes and other revenue. When spending runs ahead of revenue, you get a gap. That gap is bridged by borrowing, which adds to the national debt. But the borrowing is not unlimited. Congress sets a legislative cap on it, and that cap is the debt ceiling.

When the debt nears the cap, Congress has to step in and either suspend or raise it, which gives the Treasury permission to keep borrowing. That back-and-forth between spending, borrowing, and a legislative vote is the whole debt ceiling drama in one sentence.

Do note that, the ceiling does not authorise new spending. It authorises borrowing to pay for spending Congress already voted for. That distinction is the source of most of the confusion in the news cycle.

Where did the debt ceiling come from?

The debt ceiling is not a recent invention. It dates back to 1917, when Congress created it to set an upper limit on how much federal debt the US government could pile up.

It has not stayed put. As the economy grew and the government’s financial commitments grew with it, the ceiling has been raised many times. Congress has lifted the bar more than seventy times since 1960, and each hike signalled a fresh need for borrowed funds. By the early 2020s, both the national debt and the ceiling sat above $31 trillion.

Why is the US debt so high?

The US national debt is the product of several forces stacking on top of each other over decades: tax cuts that lowered revenue, sustained overspending, expensive crises, and large mandatory programmes. Between 2009 and 2023, the national debt nearly tripled.

Here are the main drivers:

  • Tax cuts that reduced revenue. Major tax cuts, from the Reagan-era cuts in the 1980s through the cuts under the Trump administration, lowered federal revenue. They were aimed at stimulating growth, but the side effect was less money coming in.
  • Government overspending. Long military campaigns, such as the wars in Iraq and Afghanistan, carried huge immediate costs plus long-term obligations like veterans’ healthcare and disability benefits.
  • Crisis spending. The 2008 recession forced enormous spending to rescue failing institutions. The Covid-19 pandemic forced massive stimulus to support businesses and individuals. Both strained the budget further.
  • Mandatory programmes. Social Security, Medicare, and Medicaid are a large, growing share of the budget, driven up by an ageing population and rising healthcare costs.
  • Defence. The US spends more on its military than any other country, which is a substantial slice of total expenditure.

No single cause explains the debt. It is the sum of all of these, compounding over time.

What happens if the debt ceiling is breached?

If the US fails to raise the ceiling in time and defaults on its obligations, the consequences are severe and spread well beyond Washington. Here is what would likely unfold.

The government has to prioritise payments. With the law mandating that programmes like Social Security and Medicaid continue, the Treasury would be forced to decide what gets paid and what gets delayed, potentially suspending programmes people rely on.

Interest rates spike. The bond market reacts before any formal default, with yields on short-term debt moving as default risk rises. That can feed through to higher mortgage rates and borrowing costs for households and businesses. Even a brief default could leave the government paying more to borrow afterwards.

Markets panic. A breach could trigger turmoil reminiscent of the 2008 stock market crash. As bondholders sell and rates whip around, the volatility can destabilise markets, made worse by the fact that the US has never actually defaulted, so nobody knows exactly how it plays out.

A run on money market funds. As seen in 2008, a default could spark a run on money market accounts. If a large fund halts redemptions, the panic deepens and may need government intervention to stabilise.

Political instability. Around election seasons, the debt ceiling becomes a partisan weapon, with each side accusing the other of mismanagement. Everyone agrees a default is bad, but how far each side will bend in negotiations is never certain until the deal lands.

Lasting damage to US standing. A default could prompt credit agencies to permanently downgrade US debt, weakening America’s global standing and even challenging the US dollar’s status as the world’s reserve currency. The probability of an actual default has historically been estimated as low, but the potential damage is what makes it a serious concern, especially heading into a slowdown.

What options does the government have to avoid default?

When the Treasury hits the ceiling, it can deploy a set of “extraordinary measures” (accounting manoeuvres that free up borrowing room) to put off an immediate default. These include suspending the issuance of certain types of debt and redeeming existing investments inside civil service retirement funds.

These measures are a buffer, not a fix. They buy time for Congress to negotiate, like a financial fire drill. But they are limited in size and duration. They can only defer the default. If Congress does not raise or suspend the ceiling in time, the buffer runs out.

Do other countries have a debt ceiling?

Mostly, no. The US version is unusual. A few countries have a statutory borrowing limit, but they set it so high it is never a constraint, or they removed it entirely after it caused too much trouble. Here is how three approaches compare.

CountryHas a debt limit?How it worksCauses political crises?
United StatesYesHard cap that must be raised or suspended by Congress when debt approaches itYes, recurring brinkmanship and near-defaults
DenmarkYes (in name)Statutory limit set deliberately far above actual borrowing needs (around 950 billion DKK, roughly $150 billion USD as of 2021)No, the cap is so high it is never binding
AustraliaNo (abolished 2013)Had a US-style limit, scrapped it after political crises in the early 2010s; now governed by normal budget processesNo, removing it ended the standoffs

Denmark keeps a limit but sets it so far above its needs that it never becomes a flashpoint. Australia had a US-style cap, hit the same brinkmanship the US sees, decided the limit was causing more harm than good, and abolished it in 2013. Since then, Australia’s borrowing has been governed by ordinary budget processes and parliamentary checks rather than a fixed cap. The lesson from both: a debt limit can work as a theoretical safeguard, but only if it is designed so it does not become a source of political contention.

Should the debt ceiling be revoked?

There are two honest sides to this.

In favour of keeping it: the ceiling gives Congress a recurring checkpoint to evaluate the nation’s financial health. Supporters argue this process, contentious as it is, encourages fiscal responsibility and stops unchecked borrowing.

Against keeping it: critics say the ceiling is a relic that fits poorly with a modern economy. They argue it causes needless economic disruption and has become a tool for political brinkmanship rather than genuine fiscal discipline. The recurring crises expose the US to self-inflicted financial wounds and dent its credibility.

A growing number of economists favour reform, ranging from linking the ceiling directly to spending levels (so a separate vote is not needed) to abolishing it outright, which would bring the US in line with most developed countries.

Personally, I do not have a vote in Congress, and as a trader I do not need one. My job is not to be right about whether the ceiling should exist. It is to be positioned for either outcome and to not get shaken out by the noise in between.

How should a trader handle a debt ceiling standoff?

Treat it as a known, scheduled source of volatility, not a reason to predict the headline.

Every debt ceiling fight follows roughly the same arc: a deadline looms, the rhetoric escalates, markets get jumpy, and then a deal arrives close to the wire. The default itself has never happened. That does not mean it never will, but it does mean the tradeable event is almost always the uncertainty before the deal, not the catastrophe everyone fears.

A news feed will scream “DEFAULT” at you on a loop. It will not tell you whether the move is already priced in, how to size a position when volatility is elevated, or whether to simply stand aside until the setup is clean. That judgment is the first of the Five Edges a machine cannot trade for you. The headline is the easy part. Knowing what to do with it is the edge.

So when the next standoff hits, the question is not “will they default?” The question is “what does my system tell me to do right now, and am I sized so a fake panic cannot hurt me?”

FAQ

What is the debt ceiling in simple terms?
It is the legal limit on how much the US Treasury can borrow to pay for spending Congress has already approved. When borrowing nears the limit, Congress must vote to raise or suspend it, or the Treasury runs out of room to pay the government’s bills.

Has the US ever actually defaulted on its debt?
No. The US has never defaulted because of the debt ceiling. Congress has raised or suspended the ceiling more than seventy times since 1960, usually after political brinkmanship and a last-minute deal.

What would happen to the stock market if the US defaulted?
A default could trigger a market panic similar to 2008: bondholders selling, interest rates spiking, possible runs on money market funds, and a credit downgrade of US debt. Even the threat of default tends to raise volatility before any deal is reached.

Does the debt ceiling control how much the government spends?
No. The debt ceiling does not authorise new spending. It only authorises borrowing to pay for spending Congress has already voted for. That is why a fight over the ceiling is about paying existing bills, not approving new ones.

Do other countries have a debt ceiling like the US?
Most do not. Denmark keeps a statutory limit but sets it so high it is never binding, and Australia abolished its limit in 2013 after it caused repeated political crises. The US hard-cap model that forces recurring votes is unusual among developed nations.


So, two questions worth sitting with. First, given the damage a real default would do, should the debt ceiling mechanism be reconsidered? Second, if it is kept, how do we stop the political fights around it from harming the economy it is meant to protect? Let me know in the comments.

If you want the bigger picture on how macro headlines move markets, read the pillar: Macro and Market Cycles: A Trader’s Guide.

Want a calmer way to trade the noise? Grab the free 15-Minute Swing Trading Starter Kit. It is the exact routine I use to scan once a day and trade any market in 15 minutes, headlines or no headlines.


About the author. Spencer Li is the founder of Synapse Trading and a Certified Financial Technician (CFTe) with 15 years of trading across stocks, forex, crypto, commodities, and bonds. His trade log is public, 404 trades, losses left in. He teaches low-risk swing trading in 15 minutes a day, one system for any market.

Education, not financial advice. Synapse Trading is not licensed by MAS to advise on investment products. Trading carries risk of loss; past performance is not indicative of future results.


Related

Macro and Market Cycles (pillar) · How interest rates move markets · Trading market crashes and panics

0 Comments/by Spencer Li
https://synapsetrading.com/wp-content/uploads/2023/05/Thumbnail-Explaining-the-Debt-Ceiling.png 720 1280 Spencer Li https://synapsetrading.com/wp-content/uploads/2019/10/logo.jpg Spencer Li2023-05-21 22:33:432026-07-06 01:52:10Explaining the Debt Ceiling: What Happens in A Default?
Spencer Li

Weekly Market Wrap: More Rate Hikes Coming Up Soon?

Market Analysis
Thumbnail banner weekly market wrap x3

Thumbnail banner weekly market wrap x3


For subscribers of our “Daily Trading Signals”, we now also include a “Weekly Market Report”, where we provide a weekly deep-dive on the market, including fundamentals, technicals, economics, and portfolio management:

Click here for last week’s market report (15 May 2023)
Click here to subscribe for the latest market report (22 May 2023)
Click here to see the archives of all our past market reports


Market Recap & Upcoming Week

Last week was characterized by numerous significant events, both domestically and globally. Morgan Stanley announced its plans to downsize its Asia-Pacific investment banking workforce by roughly 7%, a decision driven by changing market conditions and a broader cost-cutting initiative. The decision underscored the widespread dip in global deal-making activity, with corporate buyout activity hitting a ten-year low in Q1 2023.

Despite a modest increase in consumer spending, large companies like Home Depot reported sales declines, further shaking market confidence. The looming debt ceiling deadline and the possibility of the US defaulting on its bills continued to trigger market unease.

On the other hand, positive signals also marked the week. The announcement by House Speaker Kevin McCarthy about a possible debt-ceiling deal vote led to a surge in stocks, and the resilience of the labor market was highlighted as weekly initial jobless claims fell and major tech companies saw stock highs.

In Japan, foreign investors found the country’s market appealing, leading the Nikkei 225 stock average to a 33-year high. Despite Japan’s economic challenges, its political stability, government policies, and market reforms have attracted investors.

However, the week concluded on a somewhat tense note with stalled debt ceiling talks and the Federal Reserve Chair suggesting a potential pause in interest rate hikes. Despite the uncertainties, the major indexes still managed to end the week positively.

The coming week holds numerous intriguing developments for market watchers. We are anticipating a flurry of earnings reports from major players across various sectors, which will likely shed light on the broader economic landscape.

The retail sector remains in sharp focus with prominent firms such as Lowe’s, AutoZone, Dick’s Sporting Goods, BJ Wholesale Club, Urban Outfitters, Costco, Dollar Tree, Best Buy, and The Gap all slated to report. Moreover, from the technology and banking sectors, investors will keenly look at the performance disclosures from Zoom Video Communications, Nvidia, and TD Bank respectively.

Mid-week, attention will undoubtedly shift to the Federal Reserve’s release of the minutes from its latest FOMC meeting. Policymakers had decided to raise interest rates by 25 basis points at this meeting, and the minutes will provide more context about their decision-making process.

On Friday, we will see the Bureau of Economic Analysis (BEA) issuing its Personal Consumption Expenditures (PCE) Price Index for April, which is the Fed’s preferred measure of inflation. This, along with the University of Michigan’s report on consumer sentiment, will provide vital cues about the state of the economy.

Further, new data on the housing market, including figures on new and pending home sales for April, will offer insights into the health of this critical sector.

Daily Trading Signals (Highlights)

We cover 3 main markets with a total of 200+ counters, so we will never run out of trading opportunities:

  • Forex, CFDs, commodities, bonds
  • US stocks, ETFs, global stock indices
  • Cryptocurrencies, crypto indices

By covering a broad range of markets, we can focus our attention (and capital) on whichever market currently gives the best returns.

Subscribe for real-time alerts and weekly reports:
👉🏻 https://synapsetrading.com/daily-trading-signals


Trading Signals REET 170523

Global REITs ETF (REET) – Forming a potential H&S reversal, with a bear flag breakdown at the right shoulder.


Trading Signals US100 190523

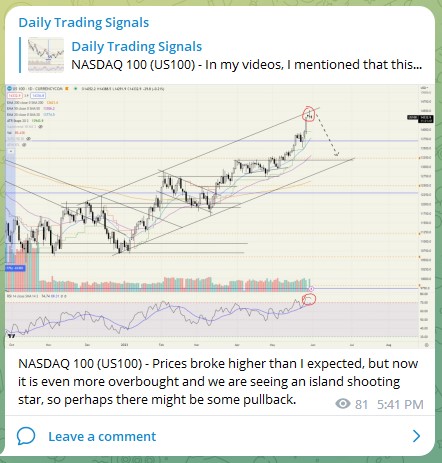
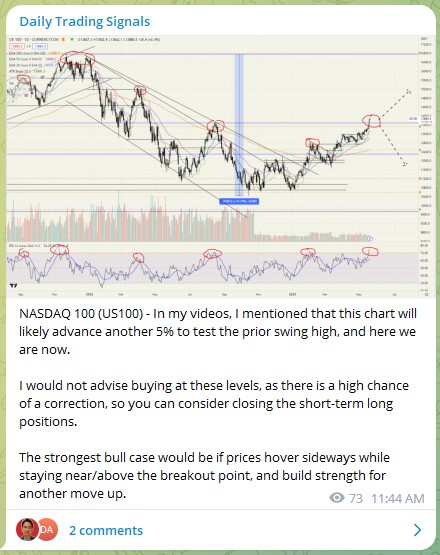
NASDAQ 100 (US100) – In my videos, I mentioned that this chart will likely advance another 5% to test the prior swing high, and here we are now.

I would not advise buying at these levels, as there is a high chance of a correction, so you can consider closing the short-term long positions.

The strongest bull case would be if prices hover sideways while staying near/above the breakout point, and build strength for another move up.


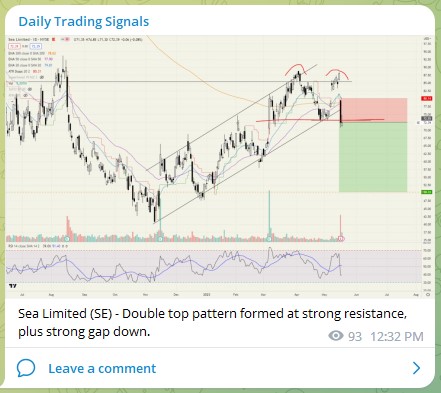
Trading Signals SE 180523

Sea Limited (SE) – Double top pattern formed at strong resistance, plus strong gap down.


Trading Signals USDSGD 190523

USDSGD – The last few days we saw great strength in the US dollar, and we are halfway to the top of the range now.


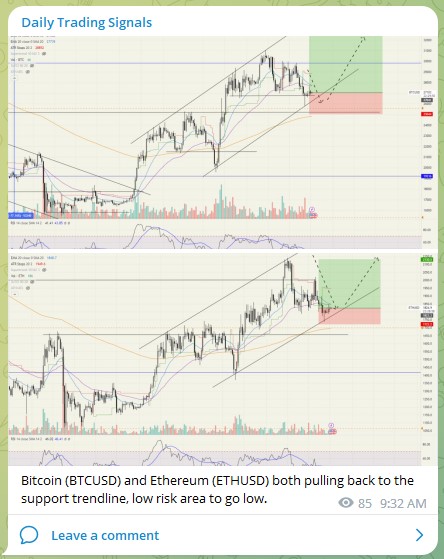
Trading Signals BTCUSD 170523

Bitcoin (BTCUSD) and Ethereum (ETHUSD) both pulling back to the support trendline, low risk area to go low.

0 Comments/by Spencer Li
https://synapsetrading.com/wp-content/uploads/2023/05/Thumbnail-banner-weekly-market-wrap-x3.png 630 1200 Spencer Li https://synapsetrading.com/wp-content/uploads/2019/10/logo.jpg Spencer Li2023-05-21 00:53:242023-07-29 23:11:53Weekly Market Wrap: More Rate Hikes Coming Up Soon?
Spencer Li

Weekly Market Wrap: Strong Q1 Earnings, But Persistent Inflation

Market Analysis
Thumbnail banner weekly market wrap x3

Thumbnail banner weekly market wrap x3


For subscribers of our “Daily Trading Signals”, we now also include a “Weekly Market Report”, where we provide a weekly deep-dive on the market, including fundamentals, technicals, economics, and portfolio management:

Click here for last week’s market report (8 May 2023)
Click here to subscribe for the latest market report (15 May 2023)
Click here to see the archives of all our past market reports


Market Recap & Upcoming Week

Last week, the Big Tech stocks, represented by the TAMAMA acronym, continued their strong performance with impressive year-to-date returns, underpinned by resilient results and a strategy of continual expansion and diversification.

On the other hand, there was a surprising underperformance of China’s stock market despite the nation’s strong economic rebound. The MSCI China index lagged behind the S&P 500, with an average profit growth of only 1% for listed Chinese companies. Concerns arose over the sustainability of the current consumption bounce and a weak job market for younger workers in the country.

Meanwhile, global inflation concerns persisted, with slow signs of cooling. The Federal Reserve held back on raising interest rates, due to banking system stresses and uncertainties around the debt ceiling. However, the markets noted some positive signs, including a slowdown in supercore inflation and a reversal in durable goods prices, primarily driven by a spike in used vehicle prices.

The challenge remains to navigate a path back to a situation where the Effective Federal Funds Rate exceeds inflation, with Wall Street calling for rate cuts to counteract the perceived dissonance between short-term rates and lower long-term Treasury yields.

As we move into the next week, the spotlight will fall on the last significant wave of this earnings season. Reports from retail giants like Walmart, Target, Home Depot, and Alibaba will provide insights into the consumer sector, potentially setting the tone for market sentiment.

The U.S. Census Bureau’s report on April retail sales, due on Tuesday, will offer critical information on the health of consumer spending, which has been a significant driver of economic recovery. Simultaneously, the housing market will be under scrutiny as data on building permits, housing starts, existing home sales, and the NAHB’s Housing Market Index for May is released.

On a global scale, economic indicators from Japan and the eurozone will attract attention with new GDP readings expected.

An inflation reading from Canada could give insights into the country’s economic health amid global inflation concerns.

A key event to watch will be the Group of Seven (G7) summit, commencing on Friday in Hiroshima, Japan. As the world leaders gather to discuss and form policy on pressing global issues, their decisions may have significant implications for global markets and international relations. Therefore, investors and observers should keep a keen eye on the outcomes of this summit.

Daily Trading Signals (Highlights)

We cover 3 main markets with a total of 200+ counters, so we will never run out of trading opportunities:

  • Forex, CFDs, commodities, bonds
  • US stocks, ETFs, global stock indices
  • Cryptocurrencies, crypto indices

By covering a broad range of markets, we can focus our attention (and capital) on whichever market currently gives the best returns.

Subscribe for real-time alerts and weekly reports:
👉🏻 https://synapsetrading.com/daily-trading-signals


Trading Signals CHFJPY 120523

CHFJPY – Another potential range trade


Trading Signals EURGBP 090523

EURGBP – Breaking down from the descending triangle.


Trading Signals GBPNZD 120523

GBPNZD – Range trading for this pair, wait for a pullback for a better entry price.


Trading Signals XAUUSD 090523

Gold (XAUUSD) – On the long-term weekly chart of Gold, if prices manage to break out of the range, there is a lot of upside.

0 Comments/by Spencer Li
https://synapsetrading.com/wp-content/uploads/2023/05/Thumbnail-banner-weekly-market-wrap-x3.png 630 1200 Spencer Li https://synapsetrading.com/wp-content/uploads/2019/10/logo.jpg Spencer Li2023-05-13 01:22:262023-07-29 23:11:02Weekly Market Wrap: Strong Q1 Earnings, But Persistent Inflation
Spencer Li

Pepecoin: The Meme Coin Craze That’s Making Waves in the Crypto World

Blockchain & Crypto
Thumbnail Pepecoin The Meme Coin Craze Thats Making Waves in the Crypto World

What Are Meme Coins, and Is Pepecoin (PEPE) a Good Investment?

Last updated: 3 July 2026 · By Spencer Li, CFTe


A meme coin is a cryptocurrency built around an internet joke or mascot, with little or no underlying utility, that trades almost entirely on community hype and social-media momentum. Pepecoin (PEPE), based on the Pepe the Frog meme, is one of the best-known examples. Is it a good investment? Honestly, no, not in the sense most people mean by “investment.” Pepecoin has no cash flow, no product, and no intrinsic value to anchor a price. It rose more than 1,500% in 14 days in 2023, then dropped over 42% from its all-time high almost immediately. That is a trading vehicle, not a store of value. You can trade a meme coin if you size it as pure speculation and accept you may lose all of it. You should not park money you need in one. The rest of this post explains what meme coins actually are, what drove Pepecoin’s rise and crash, and how to think about the risk before you touch one.

What are meme coins?

Meme coins are cryptocurrencies built around comical, animated imagery and enthusiastic online trading communities. They are high-risk by design. Most have little or no intrinsic value (no product, no revenue, no real-world use), so they function as trading instruments, not utility currencies.

You will have seen the regulars: Dogecoin, Shiba Inu, Baby Doge, Dogelon Mars, and now Pepecoin. Major cryptocurrencies like Bitcoin and Ethereum are not meme coins; they have actual networks and use cases behind them.

The thing that defines meme coins is volatility. Only a handful, such as Dogecoin and Shiba Inu, even carry the daily trading volume (over $1 million) to move size in and out without slippage wrecking you. The rest are thin, and thin markets are where you get hurt.

What is Pepecoin (PEPE)?

Pepecoin is a meme-based cryptocurrency that draws on the Pepe the Frog meme. Note this clearly: it uses the character’s likeness, but there is no official connection to Matt Furie, the cartoonist who created Pepe the Frog. That alone tells you something about the foundations.

A few facts on the coin itself:

  • Maximum supply: 420,690,000,000,000 coins (yes, that many; the number itself is a meme).
  • Rank: it climbed into the top 50 largest cryptocurrencies, and at its peak sat at #45 by overall valuation.
  • Market cap: crossed $1 billion.
  • The catalyst: trading volume jumped 425% on the Friday it was listed in Binance’s “innovation zone.”

Here is my concern, and it is the one that matters most. Whales (a few holders sitting on enormous quantities of the coin) own a large share of the supply. Concentrated ownership like that makes the market easy to manipulate and leaves it open to a rug pull (where insiders dump their holdings and crater the price for everyone else). When a handful of wallets can decide your exit price, you are not really in control of the trade.

Why did Pepecoin’s price suddenly jump?

A few things lined up at once.

First, the so-called “crypto winter” was ending, and risk appetite was coming back. When the broad market thaws, meme coins are usually the first thing to run, because they are the purest expression of speculative mood.

Second, the Binance “innovation zone” listing gave it a layer of mainstream validation. A listing on a major exchange is not an endorsement of value, but it makes a coin far easier to buy, and easier-to-buy plus rising-mood is rocket fuel for a meme coin.

Put together, Pepecoin’s value rose roughly 500% in two weeks, and the headline figure was a 1,503.9% surge within just 14 days. That is the power of social media and community-driven enthusiasm, and it is also exactly why these moves are so dangerous. Nothing changed about the coin’s fundamentals (there were none). Only the crowd’s mood changed.

The crash: a $600,000 lesson

The flip side showed up fast. Shortly after hitting its all-time high on May 6th, Pepecoin dropped more than 42%.

One crypto whale had bought 962.3 billion Pepe tokens just days before the plunge, and was left sitting on an unrealized loss of roughly $600,000. That is the part to sit with. Even a “smart money” buyer with size got caught, because in a market this driven by momentum, the timing of the crowd matters more than the quality of the asset.

To be fair, even after the drop, Pepecoin held a market cap above $1 billion and stayed the 45th largest cryptocurrency. So meme coins can keep real market presence despite the risk. But “it survived the crash” and “it was a good investment” are not the same statement.

Meme coin vs. a real asset: the honest comparison

Here is how a meme coin like Pepecoin stacks up against the kind of asset you would actually invest in.

Meme coin (e.g. Pepecoin)Established crypto (e.g. Bitcoin/Ethereum)Traditional investment (e.g. an index fund)
Intrinsic valueNoneNetwork and use caseCash flows, earnings, assets
Main price driverSocial-media hype, community moodAdoption, network use, macroFundamentals plus sentiment
VolatilityExtreme (1,500% up, 42% down in days)HighModerate
Ownership concentrationOften heavy whale concentrationMore distributedRegulated, disclosed
Rug-pull / manipulation riskHighLowVery low
Honest labelSpeculationInvestment with high riskInvestment

The point of the table is not that meme coins are evil. It is that they belong in the “speculation” column, and you should treat the money you put in like money you are prepared to lose entirely.

Is Pepecoin a good investment?

With any investment, especially in crypto, there are no guarantees. Pepecoin has seen impressive growth, but meme coins have historically struggled to hold their value. Some people characterize them, fairly, as pump-and-dump schemes. Add the concentrated ownership and the insider-trading risk, and the case for “investment” gets thin.

So my honest answer: meme coins like Pepecoin and Dogecoin are an extremely risky speculation, not an investment, because they lack fundamentals and carry extreme price volatility. If you choose to trade one anyway, do it with money you can afford to lose, size it tiny, and have an exit plan before you enter, not after the crowd turns.

Where the human edge comes in

A screener will tell you Pepecoin is up 1,500% in a second. It will not tell you to stay out. Spotting the runner is the easy, now-free part. The judgment to recognise that a thing with no fundamentals, heavy whale concentration, and a parabolic chart is a trade to size tiny or skip entirely, and the discipline to set your exit before you are emotionally in the position, is the part no tool supplies for you. That judgment is the first of the Five Edges an algorithm cannot trade for you.

FAQ

What is a meme coin?
A meme coin is a cryptocurrency built around an internet joke, mascot, or community (like a frog or a dog) rather than a product or technology. It usually has little or no intrinsic value and trades mostly on social-media hype. Examples include Dogecoin, Shiba Inu, and Pepecoin.

What is Pepecoin (PEPE)?
Pepecoin is a meme-based cryptocurrency inspired by the Pepe the Frog meme, with a maximum supply of 420,690,000,000,000 coins. It has no official connection to Pepe’s original creator, Matt Furie, and at its peak ranked among the top 50 cryptocurrencies with a market cap over $1 billion.

Is Pepecoin a good investment?
Pepecoin has no fundamentals, cash flow, or intrinsic value, so it is better described as a speculation than an investment. It rose over 1,500% in 14 days and then fell more than 42% from its all-time high soon after, which shows the extreme volatility involved. Only risk money you can afford to lose entirely.

Why did Pepecoin’s price rise so fast?
Three things combined: the end of the 2023 “crypto winter” revived risk appetite, a listing in Binance’s “innovation zone” gave it mainstream access and validation, and social-media community hype did the rest. None of it reflected any change in fundamentals.

What is a rug pull, and is Pepecoin at risk of one?
A rug pull is when insiders or large holders suddenly dump their coins and collapse the price for everyone else. Pepecoin carries elevated risk here because a small number of whales hold large quantities of the supply, which makes the market easier to manipulate.


So, before you buy a meme coin: are you prepared for the volatility and the risk, and given the concentrated ownership, how will you make sure you are deciding with your head and not the crowd’s hype? Let me know in the comments.

If you want the bigger picture on how this asset class actually works, read the pillar: The Ultimate Guide to Blockchain and Cryptocurrencies.

Want a system that keeps you out of trades like this? Grab the free 15-Minute Swing Trading Starter Kit. It is the exact routine I use to scan once a day and trade any market in 15 minutes, with the risk rules that stop a hype trade from blowing up an account.


About the author. Spencer Li is the founder of Synapse Trading and a Certified Financial Technician (CFTe) with 15 years of trading across stocks, forex, crypto, commodities, and bonds. His trade log is public, 404 trades, losses left in. He teaches low-risk swing trading in 15 minutes a day, one system for any market.

Education, not financial advice. Synapse Trading is not licensed by MAS to advise on investment products. Trading carries risk of loss; past performance is not indicative of future results.


Related

The Ultimate Guide to Blockchain and Cryptocurrencies (pillar) · What is Bitcoin and how does it work? · How to spot a pump-and-dump scheme · Risk management for traders

0 Comments/by Spencer Li
https://synapsetrading.com/wp-content/uploads/2023/05/Thumbnail-Pepecoin-The-Meme-Coin-Craze-Thats-Making-Waves-in-the-Crypto-World.png 720 1280 Spencer Li https://synapsetrading.com/wp-content/uploads/2019/10/logo.jpg Spencer Li2023-05-09 05:28:382026-07-06 02:47:51Pepecoin: The Meme Coin Craze That’s Making Waves in the Crypto World
Spencer Li

Weekly Market Wrap: Profit Taking on Crude Oil Shorts!

Market Analysis
earnings season

earnings season

For subscribers of our “Daily Trading Signals”, we now also include a “Weekly Market Report”, where we provide a weekly deep-dive on the market, including fundamentals, technicals, economics, and portfolio management:

Click here for last week’s market report (1 May 2023)
Click here to subscribe for the latest market report (8 May 2023)
Click here to see the archives of all our past market reports


Market Recap & Upcoming Week

Last week, stock markets ended on a high note due to a strong jobs report and impressive first-quarter results from Apple. The S&P 500, Dow Jones, and Nasdaq Composite all rose significantly, with 253,000 jobs added in April and unemployment dropping to 3.4%.

Although the labor market recovery is ongoing, with downward revisions to previous months and mixed results, investors seemed optimistic that a recession is not imminent.

The Federal Reserve’s weekly balance sheet showed the biggest plunge in 14 years, reflecting the impact of the banking crisis and quantitative tightening. In Europe, the ECB raised policy rates by 25 basis points in response to the worst inflation in four decades, with plans to accelerate its Quantitative Tightening program.

Despite assurances of a stable banking system, regional bank stocks declined as investors expressed concern about the impact of regional banking problems on the broader economy.

Oil prices tumbled due to concerns that higher interest rates might slow the economy and curb energy demand, while corporate profit margins dropped less than expected despite inflation and aggressive interest-rate hikes.

The Federal Reserve raised policy rates amid these economic uncertainties, and the Eurozone grappled with record-high inflation in the services sector, prompting the ECB to maintain rate hikes as it approached its policy meeting.

This week, investors should look out for earnings reports from several major companies, including PayPal, Airbnb, The Walt Disney Company, Electronic Arts, Toyota, and Honda.

These reports could provide insights into the performance of various sectors and the impact of current economic conditions.

Additionally, important economic data will be released with the Consumer Price Index (CPI) and Producer Price Index (PPI) for April, which may reveal more about the ongoing inflationary trends.

Another key event to watch is the Bank of England’s (BoE) policymaker meeting on interest rates scheduled for Thursday. This meeting could offer clues regarding the central bank’s monetary policy stance amid rising inflation concerns.

Lastly, the U.K.’s gross domestic product (GDP) reading on Friday will provide further information on the country’s economic performance, potentially influencing markets and investor sentiment.

Daily Trading Signals (Highlights)

We cover 3 main markets with a total of 200+ counters, so we will never run out of trading opportunities:

  • Forex, CFDs, commodities, bonds
  • US stocks, ETFs, global stock indices
  • Cryptocurrencies, crypto indices

By covering a broad range of markets, we can focus our attention (and capital) on whichever market currently gives the best returns.

Subscribe for real-time alerts and weekly reports:
👉🏻 https://synapsetrading.com/daily-trading-signals

USDCHF 080523

USDCHF – First TP hit for 230+ pips profit! 💰🔥💪🏻

Trend is still very bearish, so it is a good idea to hold onto half the short positions to see if it can go lower.


WTICOUSD 080523

Crude Oil (WTICOUSD) – Finally hit our TP giving a +16.5% profit in less than 2 weeks! Congrats to those who took this trade! 💰🔥💪🏻


trading Signals CADJPY 040523

CADJPY – Following up, the breakout turned out to be a false breakout, as prices quickly fell back into the range.

If this long bearish bar closes near the lows, we can consider re-entering the short trade.


trading Signals XAUUSD 040523

Gold (XAUUSD) – If you have any long positions, this might be a good time to take some profits, since it is very near the the major resistance level.


trading Signals NZDCHF 040523

NZDCHF – Going for another leg of profits, after pulling back to test the breakout and 20-EMA.

0 Comments/by Spencer Li
https://synapsetrading.com/wp-content/uploads/2023/05/earnings-season.jpg 428 760 Spencer Li https://synapsetrading.com/wp-content/uploads/2019/10/logo.jpg Spencer Li2023-05-08 00:03:142023-07-29 23:10:28Weekly Market Wrap: Profit Taking on Crude Oil Shorts!
Page 41 of 184«‹3940414243›»

Free Trading Guides

Free Trading Guides

Blog Categories

  • Beginner's Guide
  • Blockchain & Crypto
  • Book Summaries
  • Candlestick Patterns
  • Economics & News Trading
  • Investing & Portfolio Management
  • Living Your Best Life
  • Market Analysis
  • News & Events
  • Price Chart Patterns
  • Promotions
  • Risk & Money Management
  • Stock Trading
  • Testimonials
  • Tools & Resources
  • Trading Psychology
  • Trading Strategies
  • Trading Tips
  • Travel & Lifestyle

Free Trading Guides

Free Trading Guides

Contact Us

Synapse Trading Pte Ltd
Registration No. 201316168H

Whatsapp: +65-8897-1204
Telegram: @iamrecneps
Email: info@synapsetrading.com

Links

Disclaimer
Privacy policy
Terms & Conditions
Contact us
Partnerships

© 2012-2024 Synapse Trading | All rights reserved | - powered by Enfold WordPress Theme
  • Link to Facebook
  • Link to X
  • Link to Instagram
  • Link to Youtube
  • Link to LinkedIn
  • Link to Mail
Scroll to top Scroll to top Scroll to top