Indicators, candlestick patterns, chart patterns and price-action method. Cluster created 2026-08-24 per the Blog cleanup pack category map (old 15 -> new 10).
There are 2 categories of price patterns, mainly continuation patterns and reversal patterns.
Continuation patterns, are their name suggests, usually leads to a continuation of the prior price trend.
You are likely to see them in the middle of a trend, when the price is taking a pause, and forms a consolidation to build up the strength for the next leg of movement.
Reversal patterns, on the other hand, usually leads to a reversal or change in the existing trend.
You are likely to see them after a prolonged trend (which has a high chance of coming to an end), when the price is exhausted in one direction and is getting ready to change direction.
Do note that it is much harder to change the direction of an existing trend, hence reversal patterns tend to be larger, and take longer to form and complete.
Here is a slide which gives an overview on all the patterns and how they are classified.
Next, let’s dive straight in, and study the different types of price patterns!
Just a quick refresher, there are 2 main types of chart patterns – continuation chart patterns and reversal chart patterns.
Continuation patterns continue the existing trend,
The type of pattern that is formed generally depends on how far the trend has progressed.
If the trend is in the early stages, it tends to be stronger, so you only get small consolidation patterns, such as the bull flag, bear flag, or pennants.
If the trend is in the later stage, you start to see larger patterns, such as the rectangles and triangles (ascending triangle, descending triangle, symmetrical triangle).
The patterns highlighted in blue, such as the rectangle and symmetrical triangle, are considered neutral patterns, meaning they do not have a directional bias, and prices can break out of either side once the pattern is completed.
On the other hand, the patterns highlighted in red have a bearish bias (descending triangle, bear flag), while those highlighted in green have a bullish bias (ascending triangle, bull flag).
HOW TO TACKLE EACH CONTINUATION PATTERN
The main idea behind continuation patterns is that after the pattern is completed, the trend is expected to continue.
Hence, the best strategy involves finding continuation patterns in the middle of strong trends, and waiting for the opportunity to enter the trade once the trend resumes.
THE TREND AFFECTS THE TYPE OF PATTERNS
As we mentioned earlier in the introduction to continuation patterns, the type of pattern that is formed generally depends on how far the trend has progressed.
If the trend is in the early stages, it tends to be stronger, so you only get small consolidation patterns, while as the trend gets weaker, you start to see larger patterns.
Finally, as the trend enters the late stage, we will start to see even more trend uncertainty and volatility, which eventually leads to a reversal.
Some patterns, such as the head and shoulders pattern, will reverse and existing trend, whereas others like the cup and handle pattern kickstarts a new trend from a ranging market.
The patterns highlighted in red have a bearish bias (double top, head and shoulders, expanding triangle, rising wedge), while those highlighted in green have a bullish bias (double bottom, inverted head and shoulders, cup and handle, falling wedge).
Reversal patterns usually result in a change in the direction of the trend (bullish pattern reverses downtrend, or bearish pattern reverses uptrend), so if you see a contradicting pattern (bullish reversal pattern in an uptrend, or bearish reversal pattern in a downtrend), then the pattern you see is more likely to be a continuation pattern rather than a reversal pattern.
HOW TO TACKLE EACH REVERSAL PATTERN
The main idea behind reversal patterns is that after the pattern is completed, the trend is end, and change direction. Hence, the best strategy involves finding reversal patterns in the late stage of trends (which are exhausted), and waiting for the opportunity to enter once the current trend ends and a new one begins.
Price patterns, or chart patterns as some people call them, are shapes and formations formed by price movements on the price chart.
By understanding the underlying psychology of how and why they form, it gives traders a deeper understanding of the intentions of various market players (buyers and sellers), and how their battle plays out on the chart.
From a more practical standpoint, it allows you to predict which side will likely win the battle (completion of the pattern), and prepare to take action (learning how to anticipate as the pattern is forming) when the odds are stacked in your favour.
How Do Price Patterns Form & Why are they Important?
As the market moves between the 3 main trends – uptrend, downtrend and sideways, prices have to transit from one trend to another, and these transitions are what leads to the price and chart patterns being formed.
So by studying the patterns, and also understanding the context in which they are formed, it will enable us to make useful predictions as to the most likely outcome of prices once the pattern is completed.
In other words, it gives us high probability predictions of future outcomes, which we can use to tilt the trading odds in our favour.
It is also useful to understand swing counts, and how you can use them to identify the current trend of the market.
These will work hand-in-hand when breaking down and understanding chart patterns as well.
https://synapsetrading.com/wp-content/uploads/2021/07/What-are-Price-Chart-Patterns-How-do-they-Form.png7201280Spencer Lihttps://synapsetrading.com/wp-content/uploads/2019/10/logo.jpgSpencer Li2021-07-17 20:41:542022-12-21 02:34:36What are Price Chart Patterns & How do they Form?
The rectangle pattern represents a consolidation of prices, where buyers and sellers are equally matched, so there is movement both up and down, but confined within a range.
This makes the rectangle pattern a very versatile price pattern for trading breakouts.
There are 2 main varieties of rectangles – namely the wide range and narrow range rectangles, each with different trading strategies.
In this post, I will show you how to take advantage of the rectangle pattern to trade breakouts, how to avoid false breakouts, and the best trading strategies for this price pattern.
A rectangle pattern, as its name suggests, is a rectangular consolidation range in which prices move about.
Buying and selling forces are balanced, so prices could technically break out of either direction, but there is a higher probability of prices breaking out in the same direction as the prior trend, hence it is classified as a continuation price pattern, because it continues the movement in the same direction.
There are 2 main varieties:
The narrow range rectangle pattern
The wide range rectangle pattern
The main difference is the height of the pattern, and this has major implications.
The wider the range (taller rectangle), the more volatility there is, and the more likely to lead to a trend reversal.
The more narrow the range (shorter rectangle), the more likely that prices will continue in the same direction as the trend upon breakout.
Rectangle Pattern Psychology
In a narrow range rectangle, the trend is taking a pause, and buyers and sellers are building up their positions for the next big move, which means that there is likely to be a strong move and another leg of the trend after breakout.
In a wide range rectangle, buyers and sellers are not sure of direction, and are just trading within the range. During this range, there are likely to be more false breakouts than real breakouts.
The main idea is to position ourselves strategically and enter the market just as a big move is likely to happen.
Rectangle Pattern Trading Strategies
There are 4 main trading strategies, 2 for the narrow range rectangle, and 2 for the wide range rectangle.
Narrow Range: Accumulation + Breakout
Narrow Range: Trend Pullback + Breakout
Wide Range: Buy Low, Sell High
Wide Range: Breakout + Pullback
Now, let’s go through each strategy in greater detail.
Trading Strategy #1: Accumulation + Breakout
Our first strategy is used for narrow range rectangles, where we wait for an accumulation followed by a breakout of prices.
Although a narrow range typical leads to a trend continuation, it is also possible that a trend reversal takes places, especially if the range is very long (in terms of time duration).
A long range can “neutralise” the strength of the prior trend, as the longer the consolidation takes place, the more the people from the existing trend will start to doubt the strength of the trend.
In this example, we see that volume decreases as the rectangle pattern (accumulation phase) starts forming, and then sharply increases once a breakout is about to happen.
As a trader, we can look to enter when the breakout happens, or wait for the first pullback after the breakout to enter the market. This will get us onto the new trend right from the start.
Trading Strategy #2: Trend Pullback + Breakout
Our second trading strategy for the rectangle price pattern is to look a small rectangle which forms in the middle of a trend, and wait for an opportunity to enter when the trend resumes.
As mentioned earlier, the longer the consolidation, the less likely the trend will continue, so the faster the breakout happens, the higher the probability of a successful trade.
In this example, we can see the rectangle pattern form in the middle of an existing uptrend, and shortly after, prices break upwards to resume the uptrend.
As a trader, we can look to enter at the breakout, or the first pullback after the breakout. This will provide a low risk entry point to ride on the next leg of the trend.
Trading Strategy #3: Buy Low, Sell High
Our next rectangle price pattern trading strategy is for the wide range rectangle.
In a wide range, breakouts have a much lower success rate, and false breakouts are more common than actual breakouts, so it makes sense to buy low and sell high within the range, and sometimes that even means fading (trading against) breakouts and expecting them to fail.
For this strategy to work, the range needs to be clearly defined, and it also needs to be wide enough, so that there is enough “meat” on the trade, meaning there needs to be enough room for the trade to move from one end of the range to the opposite end.
In this example, the green and red arrows show the buying and selling opportunities on the chart, where you can take buy positions near the bottom of the range, and flip to sell positions at the top of the range.
You can also use dynamic scaling at different parts of the range, such as accumulating multiple buy positions as prices are in the lower end of the range, and as price move to the upper end of the range, start selling off the buy positions and start accumulating sell positions.
Do note that eventually, after numerous false breakouts, one of the breakouts is going to be real, so when that happens make sure you cut the position and get out fast.
Trading Strategy #4: Breakout + Pullback
Our last strategy for the rectangle price pattern is a breakout from the wide range.
As mentioned previously, successful breakouts are rare in a wide range, so to avoid any false breakouts, we should only enter breakouts from a wide range after a pullback, meaning we do not enter immediately upon the breakout itself.
In the example above, we see price breaking down from the bottom of the range, and the first clue would be how strong the breakout is, and how far it continues moving after the breakout.
For trading, we would look to enter only during the pullback, which gives us a high probability and low risk entry point.
Note that this large range eventually leads to a reversal (change of trend direction).
Profit Target for Rectangle Pattern
Once a rectangle pattern is completed, one of the most useful things about it is its ability to provide a price projection, which can be used to estimate a minimum profit target for your trade.
This can be done by taking the maximum height of the rectangle, and projecting that distance from the breakout point.
In the chart above, the maximum height of the rectangle is indicated by the blue rectangular box, which is then used as a price projection at the breakout point.
The black horizontal arrow indicates the price level which serves as the minimum profit target for the rectangle pattern breakout.
If the rectangle is small, you can even use multiple rectangle projections for multiple profit targets.
This price projection technique can be used in conjunction with other methods, such as support and resistance levels, and if there is any confluence, gives an added layer of confirmation.
Tips from the Trading Desk
Trade with the larger trend
The wider the range, the greater the uncertainty, and the bigger the risk
When in doubt, wait for a pullback after breakout
The longer the pattern takes to form, the bigger the potential move after breakout
The wider the range, the higher the chance of a change in trend
I mentioned this near the start of the guide, that it can serve as a useful gauge of how likely a rectangle consolidation is going to lead to a trend continuation or a trend reversal.
As you can see in the diagram, when the range/consolidation is narrow, there is a higher chance of the prior trend continuing, whereas if the range is wide, there is a higher chance of a reversal occurring.
The reason for this is that in a narrow range, the buyers/sellers who are riding on the existing trend are mostly still holding onto their positions, with only a minority taking profits (and waiting to enter again), so there is not much pressure to change the trend.
In a wide range, buyers/sellers will attempt to trade within the range, so they will sell near the top and buy near the bottom, creating a more balanced bullish/bearish pressure, meaning there is an equal chance that the trend can swing either way.
If you look at continuation chart patterns like the flag and pennant, they tend to have a narrow range, whereas in reversal patterns like head and shoulders and double top/bottom, they tend to have a wide range.
Taking this into account, the best approach is to trade with the trend if the rectangle pattern is narrow, and trade both sides when the rectangle pattern is wide.
Now that I have shared the various trading strategies for the rectangle price pattern, which is your favourite strategy?
The triangle price pattern is a type of continuation price pattern, where prices get compressed and converge over time, until price breaks out in either direction.
There are 3 different types of triangle patterns – the symmetrical triangle, the ascending triangle, and the descending triangle, each with different trading strategies.
In this post, I will show you how to take advantage of the triangle pattern to trade breakouts, how to avoid false breakouts, and the best trading strategies for this price pattern.
What are Triangle Price Patterns?
A triangle pattern, as its name suggests, is a triangular consolidation range in which prices moves about.
The triangle pattern generally represents a medium-term consolidation of prices, and is usually found in the mid/late stages of a trend.
Since it is a medium-term pattern, the triangle pattern usually consists of 50-100 bars, and most of the time results in prices breaking out in either direction as prices get compressed.
As prices get squeezed towards the tip of the triangle, prices will be forced to break out of the pattern, and the direction is takes will depend on the type of triangle.
There are 3 main varieties of triangles – namely the ascending triangle, the descending triangle, and the symmetrical triangle, and we will be going through each one in more detail later on.
Triangle Pattern Psychology
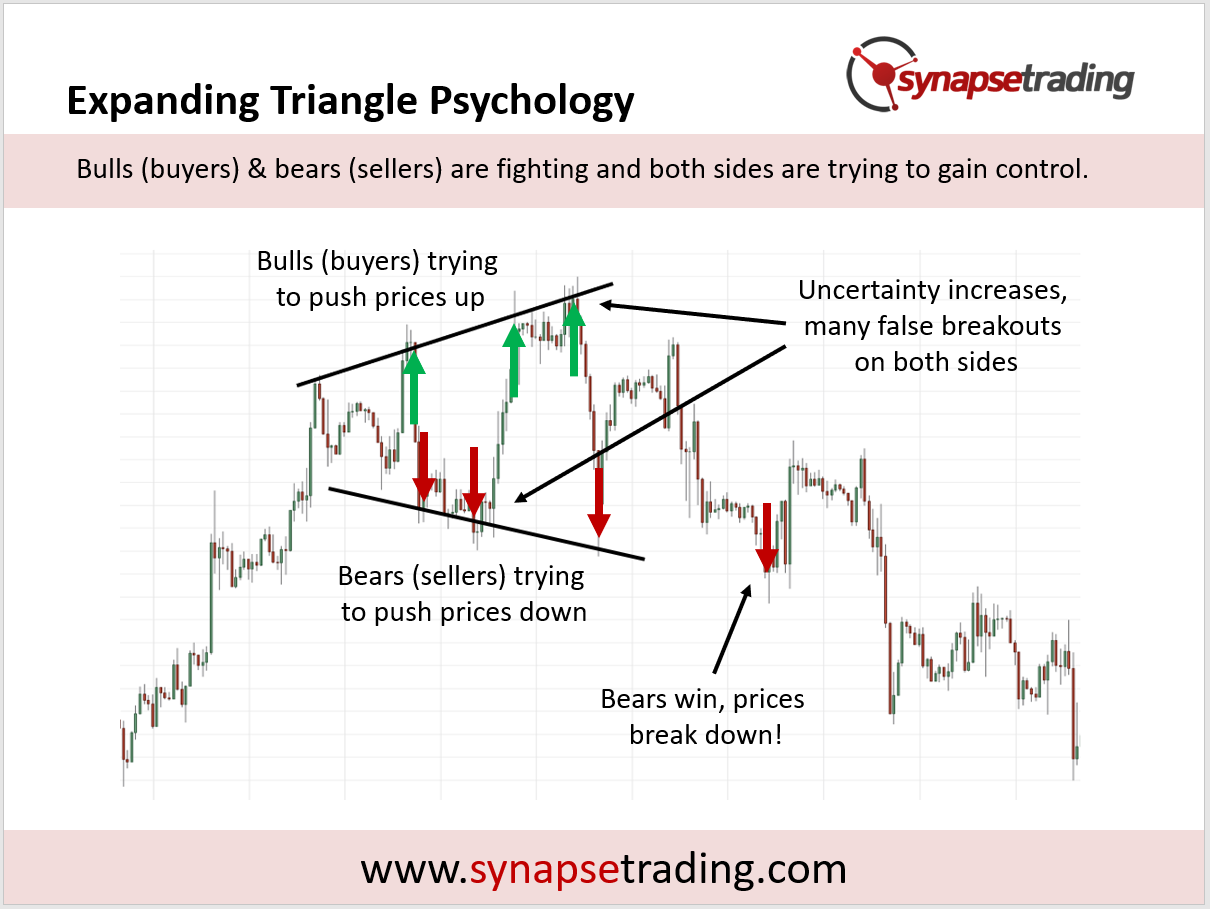
In the triangle pattern, bulls (buyers) & bears (sellers) are fighting and both sides are trying to gain control. Bulls want higher highs and higher lows, while bears want lower highs and lower lows.
As the fight intensifies, uncertainty increases and volume decreases, as the range of prices start narrowing, so both bulls and bears choose to wait on the sidelines until the direction becomes clear before jumping in again.
That is why once a breakout occurs, price and volume tends to spike, as all the buyers or sellers waiting on the sidelines start making their move.
How to Tackle Each Type of Triangle Pattern
As we have seen, all triangles consist of 2 sloping lines which converge, but the main difference lies in the gradient for each pairs of lines.
Symmetrical triangle – both lines are sloping inwards (top line slopes down and bottom line slopes up)
Ascending triangle – top line is flat, while bottom lines slopes up
Descending triangle – bottom line is flat, while top line slopes down
The slope of these lines have a great significance, which I will cover in greater detail by going through each triangle pattern.
a) Symmetrical Triangle Price Pattern
The symmetrical triangle with its converging lines show that both sides (buyers and sellers) are equally matched, which makes it hard to predict which side the breakout is going to happen.
Since it is a continuation pattern, the odds will tend to favour direction of the existing trend, but it is still much harder to trade compared to the next 2 triangle patterns.
b) Ascending Triangle Price Pattern
The ascending triangle, with its bottom line sloping up, shows a bullish bias, as this indicates a series of higher lows.
Recap: A series of higher lows and higher highs is an uptrend.
The flat line on top, which now serves as resistance, becomes a clear level for price to attack and break, and if it succeeds, will lead to higher highs.
Hence, there is a higher probability of an upside breakout for the ascending triangle, especially if it forms in the middle of an existing long-term uptrend.
c) Descending Triangle Price Pattern
The descending triangle, with its top line sloping down, shows a bearish bias, as this indicates a series of lower highs.
Recap: A series of lower highs and lower lows is a downtrend.
The flat line at the bottom, which now serves as support, becomes a clear level for price to attack and break, and if it succeeds, will lead to lower lows.
Hence, there is a higher probability of a downside breakout for the descending triangle, especially if it forms in the middle of an existing long-term downtrend.
Triangle Pattern Trading Strategies
There are 2 main strategies, which focus on the directional triangles (ascending triangle and descending triangle), and the difference lies in how early to enter the breakout when it happens.
Breakout Entry: Enter immediately
Pullback Entry: Wait for a pullback after the breakout
Something to take note of, breakouts usually occur when prices are around 2/3 to 3/4 of the pattern length, and if prices go past the 3/4 mark, there is a possibility that prices may just continue to meander sideways without breaking out. This would mean a failed pattern.
Now, let’s go through each strategy in greater detail.
Trading Strategy #1: Breakout Entry
Our first strategy for the triangle price pattern is to enter on the breakout of an ascending triangle or descending triangle pattern.
As mentioned previously, a triangle is a compression of prices while buyers and sellers wait on the sidelines for a breakout. For this setup, we will be looking to enter just as the breakout happens.
In the example above, we see a prior uptrend, so we know the odds for an upside breakout are higher.
As the ascending triangle forms, we see a series of higher lows (and similar highs) forming, showing a gradual build-up of bullish pressure. We also see prices pushing against the resistance level formed by the similar highs.
Finally, the resistance gives way, and prices through.
For trading, we would look to enter near the point of breakout, keeping an eye for strong price action and volume to support the breakout. We can also use the breakout bar(s) to place a stoploss.
Note that this strategy works just as well with a descending triangle, you’ll just have to flip the pattern around for a downside breakout.
This strategy works best if the prior trend (before forming the triangle pattern) is strong, and has a higher chance of success if the triangle is smaller, in terms of height and duration.
Trading Strategy #2: Pullback Entry
Our next strategy for the triangle price pattern is to enter on a pullback after the initial breakout.
As covered in the previous setup, one of the ways to trade an ascending triangle or descending triangle is to enter the moment price breaks out of pattern.
However, sometimes the odds of a successful breakout might be lower, for example if the triangle pattern is large (more uncertainty), or the pattern goes against the prior trend (bullish ascending triangle in a downtrend, or bearish descending triangle in an uptrend).
In the example above, we see a prior uptrend, followed by a bearish descending triangle. This sets up up a little contradiction, which suggests that the breakout might not be as strong or as clear-cut.
Therefore, when the breakout happens, instead of entering the trade immediately, we wait to see if there is a pullback to test the support-turned-resistance level (which was the flat line of the descending triangle).
For trading, we would look to enter once the pullback is completed, and prices start to head back down. The end of the pullback would also be a good place to put your stoploss.
Note that this strategy works just as well with an ascending triangle, you’ll just have to flip the pattern around for an upside breakout.
Which Triangle Pattern to Avoid?
You might have noticed that I left out the symmetrical triangle in both the strategies mentioned earlier.
The reason is that I find the symmetrical triangle the least reliable pattern of the 3 triangle patterns.
This is because it is hard to confirm a successful breakout of this pattern, and even harder to determine a good entry point.
In the example above, prices have broken out to the upside of the symmetrical triangle pattern.
However, because of the nature of the pattern, there will still be another high (or low, if it broke to the downside) which prices have to surpass, and it becomes a resistance level.
As a result, even after the breakout, we are not sure if prices have starting trending, or whether prices are still within a wider range.
We can only be sure after prices have broken the new resistance level and continues climbing, in which case the original symmetrical triangle breakout did not really have much significance or trading opportunity.
Hence, I would prefer to focus on those patterns which have a more predictable outcome.
Profit Target for the Triangle Pattern
Once a triangle pattern is completed, one of the most useful things about it is its ability to provide a price projection, which can be used to estimate a minimum profit target for your trade.
This can be done by taking the maximum height of the triangle, and projecting that distance from the breakout point.
In the chart above, the maximum height of the triangle is indicated by the blue rectangular box, which is then used as a price projection at the breakout point.
The black horizontal arrow indicates the price level which serves as the minimum profit target for the triangle pattern breakout.
This price projection technique can be used in conjunction with other methods, such as support and resistance levels, and if there is any confluence, gives an added layer of confirmation.
Tips from the Trading Desk
Trade with the larger trend, as breakouts are more likely to happen in the same direction as the prior trend
Watch out for triangles that are themselves a part of a larger price pattern
Look out for major support and resistance levels
As you can see from the chart above, this is an example of trend trading using the triangle pattern, because the triangle formed is actually a consolidation pattern within the major trend, so this whole triangle is actually a pullback opportunity to enter the underlying trend.
Although we generally do not like trading symmetrical triangles, the odds in this case are better than 50-50 because there us a higher chance of an upside breakout due to the context (triangle pattern pullback in major uptrend).
Besides strong trends, triangle patterns can also form near the edges of support or resistance levels, when prices are trying to push through that price level, so you might see them near the necklines of other patterns, such as the double top/bottom, or head and shoulders pattern.
In a sense, the triangle pattern becomes part of these larger patterns depending on the context.
Now that I have shared all about the triangle pattern, what is your favourite triangle pattern strategy for trading?
The head and shoulders and inverse head and shoulders are a type of common reversal pattern found at the end of major trends.
The bearish version is called the head and shoulders pattern, while the bullish version is called the inverse head and shoulders pattern.
In this post, I will show you how to take advantage of the head and shoulders pattern to identify major market reversals, and the best trading strategies for this price pattern.
What is a Head and Shoulders Pattern?
The head and shoulders and inverse head and shoulders are another type of common reversal patterns found at the end of major trends.
When prices are unable to surpass the prior swing high (the head) and forms a lower high (the shoulder) instead, this forms the bearish head and shoulders reversal pattern.
When prices are unable to surpass the prior swing low (the head) and forms a higher low (the shoulder) instead, this forms the bullish inverse head and shoulders reversal pattern.
Head and Shoulders Pattern Psychology
Here is a quick recap of the 2 types of patterns:
Head and shoulders pattern – bearish reversal
Inverse head and shoulders pattern – bullish reversal
Head and Shoulders Pattern Psychology (Bearish Reversal)
In the head and shoulders pattern, bulls (buyers) are originally in control of the market, and the market is in an uptrend.
At some point in time, bears (sellers) try to take control, pushing down prices, which creates the “left shoulder” of the pattern.
Bulls resume control and push prices to new highs, which forms the “head” of the pattern.
Bears try to fight for control again, pushing prices back down to the level of its first push.
Bulls try one last time to resume control by pushing prices up, but it is unable to make new highs. This forms the “right shoulder” of the pattern.
Finally, bears take full control and push prices further down.
Bears are now in control of the market, and the market is in a downtrend.
Inverse Head and Shoulders Pattern Psychology (Bullish Reversal)
In the inverse head and shoulders pattern, bears (sellers) are originally in control of the market, and the market is in a downtrend.
At some point in time, bulls (buyers) try to take control, pushing up prices, which creates the “left shoulder” of the pattern.
Bears resume control and push prices to new lows, which forms the “head” of the pattern.
Bulls try to fight for control again, pushing prices back up to the level of its first push.
Bears try one last time to resume control by pushing prices down, but it is unable to make new lows. This forms the “right shoulder” of the pattern.
Finally, bulls take full control and push prices further up.
Bulls are now in control of the market, and the market is in an uptrend.
Head and Shoulders Pattern Trading Strategies
There are 3 main strategies, which focus on the taking advantage of the change in trend, and the difference lies in how early to enter the reversal when it happens.
Early Entry: Enter immediately
Pre-Breakout Entry: Enter immediately
Pullback Entry: Wait for a pullback after the breakout
Since the head and shoulders is a reversal pattern, we can expect to see its swing counts change as the pattern unfolds.
For the bearish reversal of the head and shoulders pattern, we see the swing counts change from a series of higher highs and higher lows, to one of lower highs and lower lows.
For the bullish reversal of the inverse head and shoulders pattern, we see the swing counts change from a series of lower highs and lower lows, to one of higher highs and higher lows.
For all 3 strategies, they involve entering a position at various stages during this transition of swing counts.
Now, let’s go through each strategy in greater detail.
Trading Strategy #1: Early Entry
Our first strategy for the head and shoulders price pattern is to enter early as the 2nd shoulder (right shoulder) is forming, by using the 1st shoulder (left shoulder) as a guide.
As mentioned previously, the head and shoulders pattern is a reversal pattern, and we can expect to see swing counts change as the pattern unfolds.
The early entry takes advantage of this by shorting on the first LH (bearish H&S reversal), or going long on the first HL (bullish inverse H&S reversal). You can scroll up to the previous infographic (entries in head & shoulders pattern) to observe where the colour changes.
In the examples above, we see a prior trend, followed by the head and shoulders pattern which attempts to change the direction of the trend.
The first sign of the change of trend comes from the 2nd shoulder (right shoulder), because it is not able to reach the same level or exceed the head, which shows that the existing trend is weakening.
Most of the time, the 2nd shoulder (right shoulder) will form at roughly the same level as the 1st shoulder (left shoulder). This means that we can pre-empt the potential turning point of prices, and use that for our early entry.
For trading, we would look to enter near the point of the 2nd shoulder, keeping an eye for reversal candlestick bars/price action and volume which signals that momentum is weakening and it cannot go past the shoulder level.
We can then look to place our stoploss (SL) somewhere between the shoulder and the head levels.
This strategy works best if the price movement to resume the current trend is weak, and looks to be struggling just to touch the shoulder level, which suggests that it will most likely not be able to go past.
Trading Strategy #2: Breakout Entry
Our second strategy for the head and shoulders price pattern is to enter on the breakout/breakdown of the neckline.
As mentioned previously, the head and shoulders pattern is a reversal pattern, and we can expect to see swing counts change as the pattern unfolds, meaning a LH & LL if we want to short, and a HL & HH if we want to go long.
In the previous strategy (early entry), the entry was given on the first LH (shorting a bearish H&S reversal), or the first HL (going long on a bullish inverse H&S reversal).
In this strategy (breakout entry), the entry is given on the LL (shorting a bearish H&S reversal), or the HH (going long on a bullish inverse H&S reversal). Breaking the neckline automatically gives rise to a LL and HH respectively.
In the examples above, we can see the neckline (blue horizontal line) which denotes this crucial price level. Sometimes, if there is no clear neckline, this might result in a zone, or multiple necklines.
For trading, we would look to enter just as the breakout occurs at the neckline, keeping an eye for strong price action and volume which signals conviction in the breakout.
We can then look to place our stoploss (SL) somewhere between the neckline and the 2nd shoulder (right shoulder).
This strategy works best if there is a clear neckline which price is trying to break, followed by strong price momentum on the breakout.
If the price action is choppy/volatile, or if the neckline is not clear, then it would be better to wait for a pullback and use Strategy #3 (pullback entry) instead.
Trading Strategy #3: Pullback Entry
Our third strategy for the head and shoulders price pattern is to wait for the break of the neckline to occur (Strategy #2), then enter on the 1st pullback after that happens.
As mentioned previously, the head and shoulders pattern is a reversal pattern, and we can expect to see swing counts change as the pattern unfolds.
In the previous strategies, we shorted on a LH (Strategy #1) and LL (Strategy #2); or went long on a HL (Strategy #1) and HH (Strategy #2).
In Strategy #3, we will be shorting on the next LH (LH > LL > LH), or going long on the next HL (HL > HH > HL).
Therefore, since the new trend is slightly more established, the chance of success is higher, but the reward-to-risk ratio (RRR) will not be as good as the prior strategies. As we mentioned many times before, every trade is a trade-off between the hit rate and the RRR.
In the examples above, we can see where the 1st pullback occurs (yellow highlight), depending on which neckline you treat as the breakout.
Most of the time, the pullback will retrace to touch the neckline, but if the breakout momentum is strong, the pullback may not come all the way back to the neckline.
For trading, we would look to enter near the point of the pullback (usually near the neckline), keeping an eye for reversal candlestick bars/price action and volume which signals that momentum is weakening and it cannot go past the neckline.
We can then look to place our stoploss (SL) somewhere between the neckline and the 2nd shoulder (right shoulder).
If you have already entered a position during the breakout, this strategy can be an opportunity for you to add on more positions.
Profit Target for the Head and Shoulders Pattern
Once a head and shoulders pattern is completed, one of the most useful things about it is its ability to provide a price projection, which can be used to estimate a minimum profit target for your trade.
This can be done by taking the maximum height of the pattern (distance from the head to the neckline), and projecting that distance from the breakout point.
If the neckline is not clear or there are multiple necklines, it is advisable to go with the most conservative option, and use a smaller projection.
In the chart above, the maximum height of the head and shoulders pattern is indicated by the blue rectangular box, which is then used as a price projection at the breakout point.
The horizontal arrow indicates the price level which serves as the minimum profit target for the head and shoulders pattern breakout.
This price projection technique can be used in conjunction with other methods, such as support and resistance levels, and if there is any confluence, gives an added layer of confirmation.
Tips from the Trading Desk
Make sure the trend is in the late stage – the longer the trend has been running, the more exhausted it is likely to be.
Use the completed pattern for price projection – shoulders tend to be roughly the same height.
The size of the pattern should be proportional to the trend it is trying to reverse.
As you can see from the chart above, this is an example of a strong trending market (3 green rectangle boxes), which ended in a head and shoulders bearish reversal (1 red rectangular box).
This means that for the whole move up, if we only measure the vertical distance (height), the trend accounts for 75%, and the reversal pattern accounts for 25%. This is within the healthy range, meaning the pattern size is proportional to the whole trend.
Typically, a reversal pattern works best when its height is about 25% to 33% (1/4 to 1/3) of the whole move.
If the pattern size is less than 25%, the pattern is too small to reverse the trend, which means that it might likely lead to a consolidation before the trend resumes, or the reversal pattern is still in the midst of forming, and might evolve to something bigger.
If the pattern is large than 33%, the pattern is too large to be classified as a head and shoulders pattern, and it could just be large swings within a wide range.
I have not come across any authors talk about price pattern proportionality in any books, but I see a lot of new traders making this mistake when trying to identify price patterns. And this applies to other price patterns as well.
Now that I have shared the various trading strategies for the head and shoulders price pattern, which is your favourite strategy?