
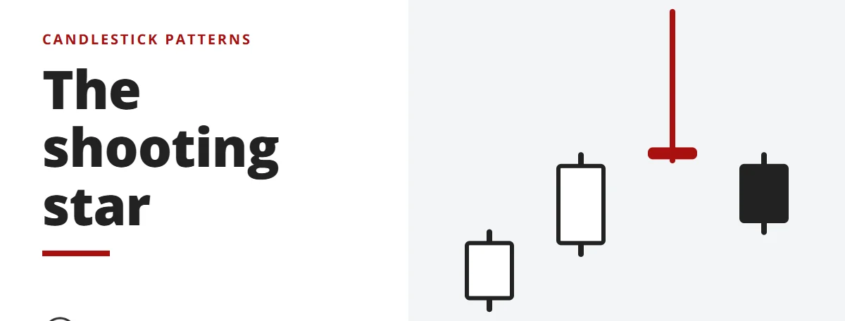
The shooting star is a bearish reversal candle with a long upper shadow and a small body, seen after an uptrend. See what it signals and how to trade it.

Indicators, candlestick patterns, chart patterns and price-action method.
Indicators, candlestick patterns, chart patterns and price-action method.
The shooting star is a bearish reversal candle with a long upper shadow and a small body, seen after an uptrend. See what it signals and how to trade it.
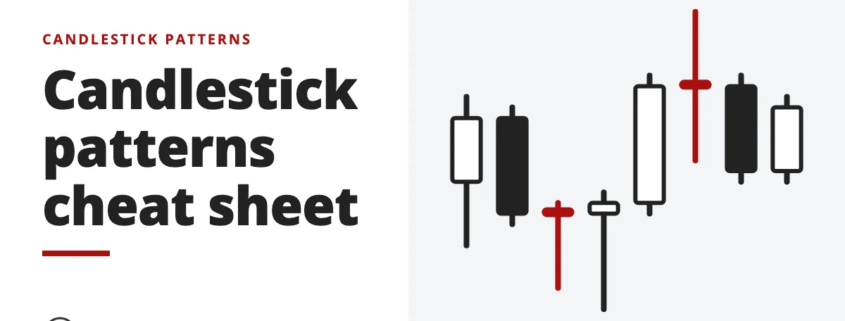
A full cheat sheet of Japanese candlestick patterns, split into bullish and bearish, with what each one suggests about where price may go next.
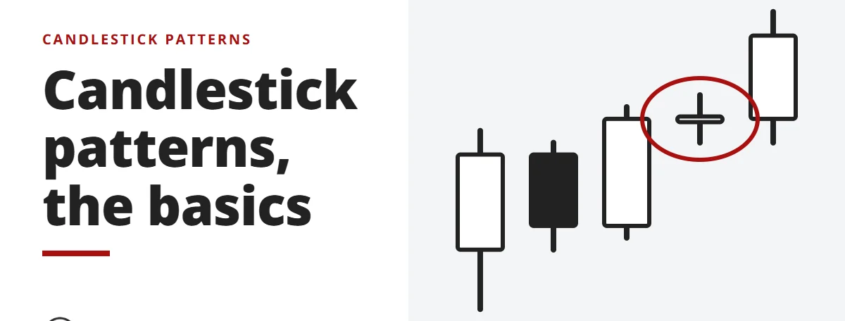
A candlestick pattern is one to three candles that show how the fight between buyers and sellers went. How to read them, and why location decides.
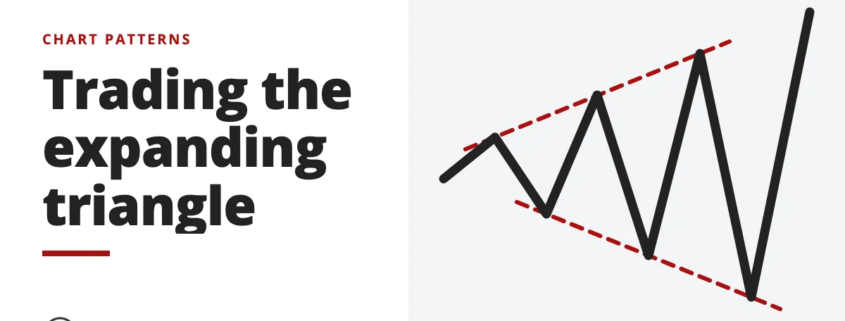
The expanding triangle forms when buyers and sellers fight for control in a volatile market until one side gives up. Learn how to spot and trade it.
Why a triangle on the hourly chart can be a pennant on the daily, which timeframe carries more weight, and how to read a pattern with the bigger picture.