• Link to Facebook
  • Link to X
  • Link to Instagram
  • Link to Youtube
  • Link to LinkedIn
  • Link to Mail
Free PDF: The 15-Minute Swing Trader's Checklist, the daily routine of a trader since 2007
Synapse Trading
  • Mentoring
    • Trading Mastery Program
    • All mentoring options
  • Signals
    • Daily trading signals
    • Signals trade log
  • Results
    • Student results and testimonials
    • Public trade log, losses left in
  • Free guides
    • Start here
    • Trading foundations
    • Technical analysis
    • Strategies and systems
    • Risk and money
    • Trading psychology
    • Markets and products
    • Free trading guides
    • Tools and resources
    • Blog
  • About
    • My background
    • My trading journey
    • Media and interviews
    • Travel log
  • Contact
    • Contact me
    • Partnerships
  • Start free
  • Click to open the search input field Click to open the search input field Search
  • Menu Menu

Indicators, candlestick patterns, chart patterns and price-action method.

Spencer Li

Rectangle Pattern Trading Strategy: 4 Ways to Trade the Breakout and Avoid the Fakeouts

Technical Analysis & Price Action
Trading the rectangle breakout - chart patterns

By Spencer Li, CFTe · Last updated: 21 September 2026

A rectangle pattern is a sideways range where price keeps bouncing between a flat resistance line above and a flat support line below, because buyers and sellers are roughly matched for a while. It is usually a continuation pattern, so the breakout more often goes the same way as the trend before it.

How you trade it depends on its height. A narrow rectangle tends to break out cleanly with the trend, so you trade the breakout. A wide one throws off false breakouts, so you buy near the bottom, sell near the top, and only trade a breakout once it has pulled back.

That gives four strategies, two for each kind. Below are all four, plus the profit target.

What does a rectangle pattern look like on a chart?

In my weekly outlook on 5 March 2026, I drew a red box around the S&P 500. The war headlines that week were loud enough to make anyone nervous, yet the index had spent the whole time moving inside the same tight range, as if nobody had told it.

That box is a rectangle. Draw one horizontal line across the highs and another across the lows, and if price has touched each line at least twice and turned back, you have one. My own breakout rule asks for a level tested two or more times, because one touch could be luck, while two usually means somebody is defending that price.
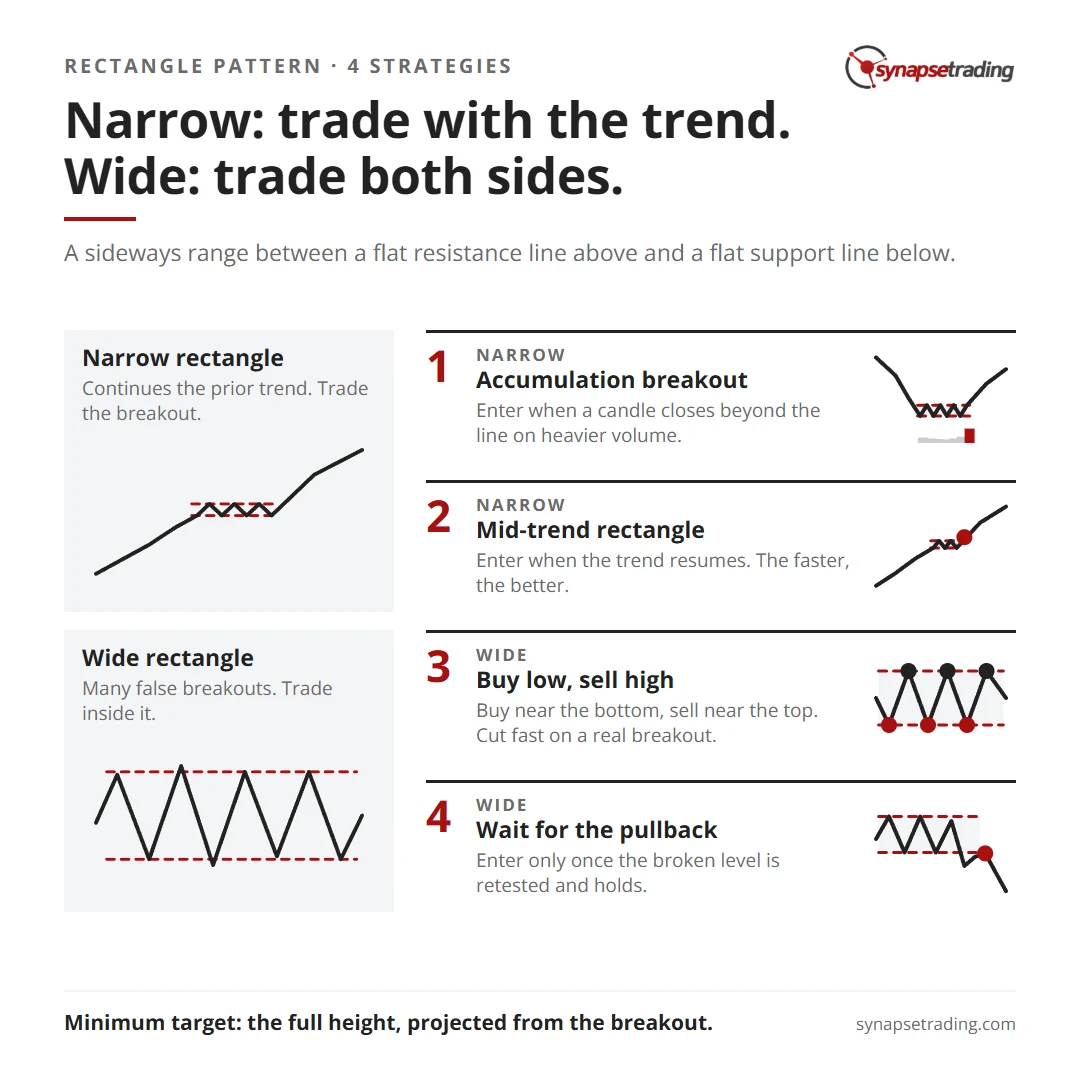
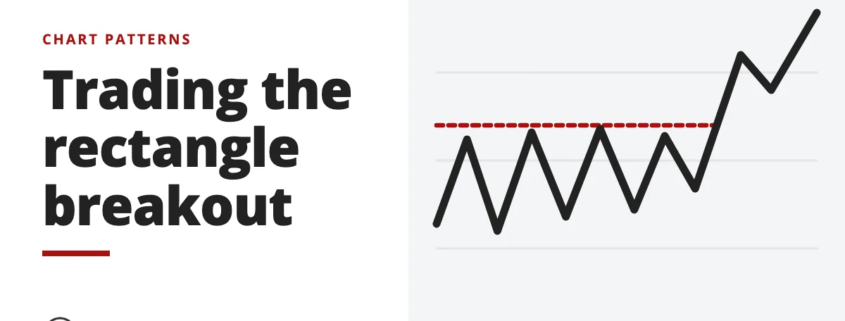
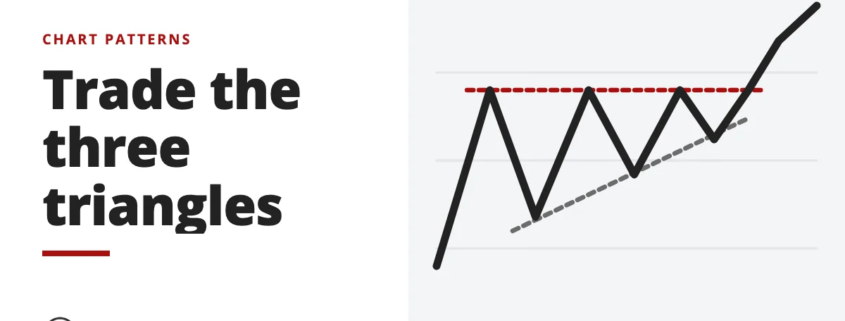
Rectangle pattern cheat sheet: narrow rectangles, trade with the trend; wide rectangles, trade both sides. Four strategies and the minimum target.

Inside the box, buying and selling are balanced, but the odds lean towards the prior trend.
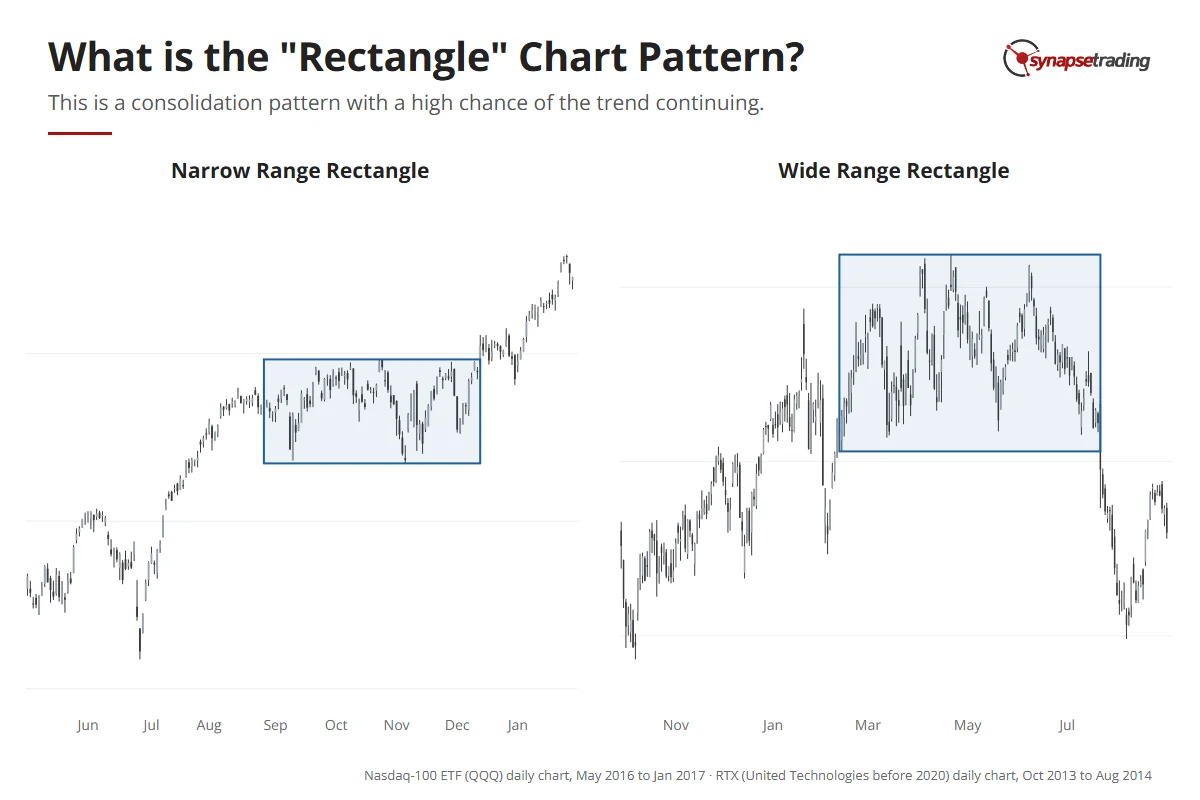
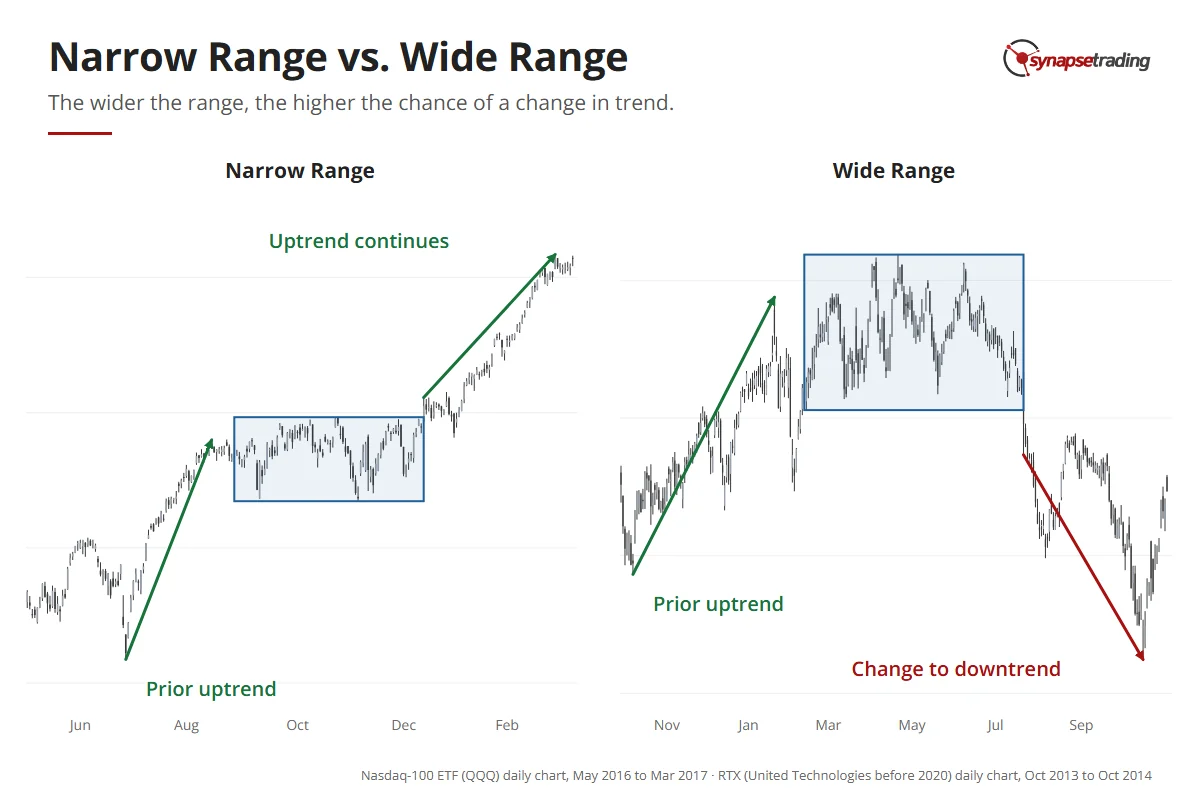
Two real rectangles: the Nasdaq-100 ETF pauses in a narrow range in late 2016, and United Technologies (now RTX) swings in a wide range through 2014.

The day before that outlook, the index broke below the box and then closed back inside it. As I said on the video, “so that means that the breakout failed”. My view was to leave the index alone until it broke out clearly, and the wide range below shows why.

Why does the height of the rectangle matter so much?

Two rectangles can look identical apart from their height, and they behave so differently that I teach them as two separate market types. In my course, a narrow range is a Type 3 market and a wide range is a Type 4.

So why would height change anything? It comes down to who is sitting inside the box.

In a narrow rectangle, the trend is taking a breather. Most of the people who rode it are still holding, and only a few are taking profits and waiting to buy back in, so there is very little pressure on anyone to turn the trend around. When the range breaks, it tends to break the same way, with a strong new leg behind it.
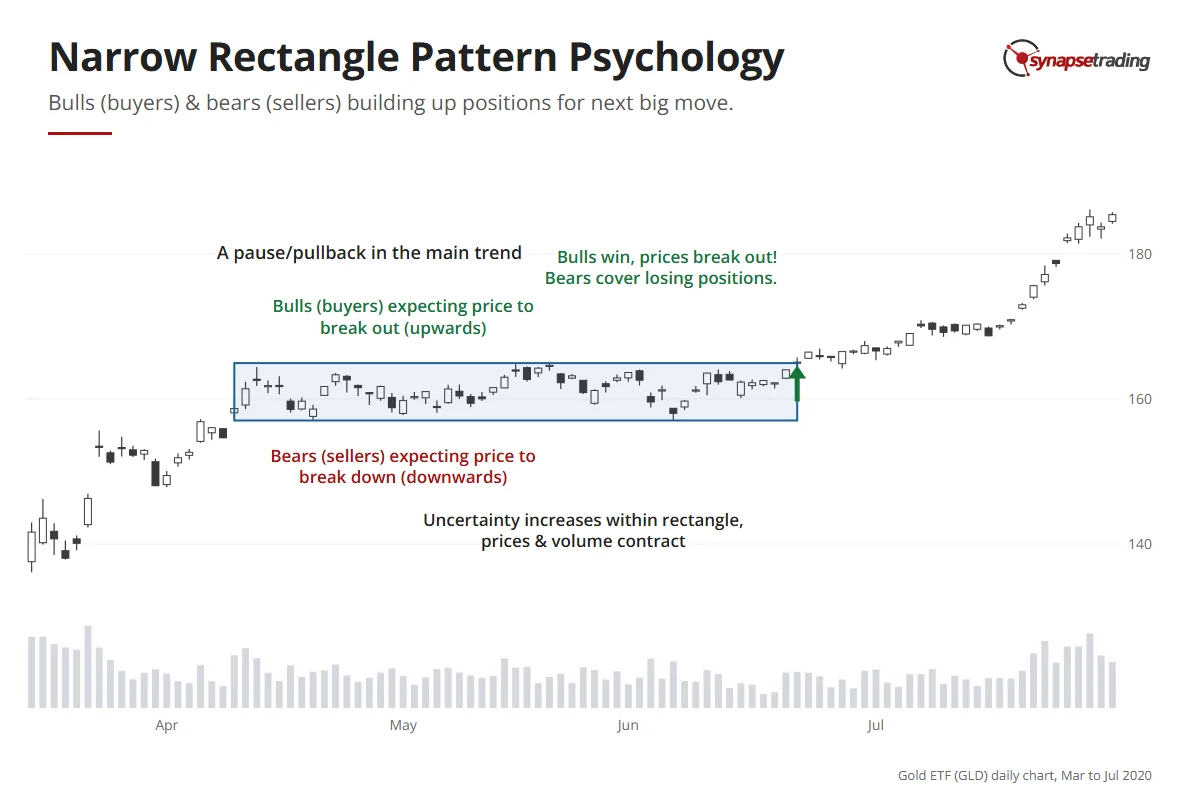
Gold ETF daily chart, 2020: a pause in a narrow range after a sharp rise, with volume shrinking and buyers and sellers each expecting a break their way, until buyers win in June.

In a wide rectangle, the swings are big enough that traders start trading the range itself, selling near the top and buying near the bottom. That turns it into a far more even tug of war between bulls and bears, with plenty of false breakouts and a much higher chance that the eventual move is a reversal.
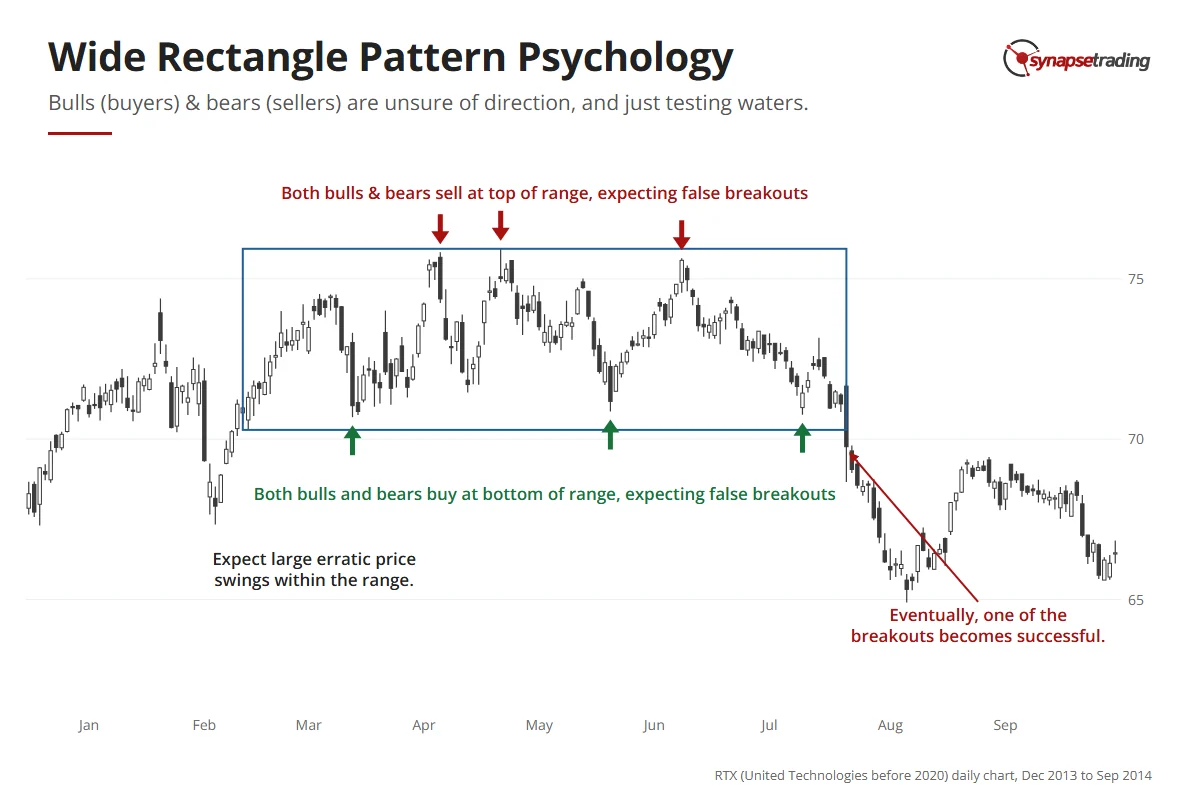
United Technologies (now RTX) daily chart, 2014: large swings inside a wide range, with sellers at the top and buyers at the bottom, until the range breaks down in July.

Other patterns split the same way, with flags and pennants tending to be narrow and to continue the trend, while the head and shoulders and the double top tend to be wide and reverse it. I cover both families in continuation vs reversal patterns.

Narrow rectangle, Type 3Wide rectangle, Type 4
What it usually doesContinues the prior trendReversal becomes more likely
BreakoutsMore reliableMany false breakouts
How to trade itTrade the breakout, with the trendBuy low and sell high inside it
Best entryThe breakout close, or the first pullbackNear the edges, or the pullback after a breakout

Two real rectangles after an uptrend: the Nasdaq-100 ETF 2016 narrow range resolves up and the trend continues; United Technologies 2014 wide range resolves down and the trend changes.

Hence the short version: trade with the trend when the rectangle is narrow, and trade both sides when it is wide.

If you trade around a full-time job, my free 15-minute swing trader checklist is the daily routine I use myself.

Strategy 1: How do you trade an accumulation breakout?

The first narrow-range strategy is to wait for a period of accumulation, then trade the breakout that ends it.

The clue is usually in the volume. As the rectangle forms, volume dries up because nobody is in a hurry, and then it jumps when the breakout fires. What I want to see is a candle that closes beyond the line on clearly heavier volume. A wick that pokes through and closes back inside does not count.
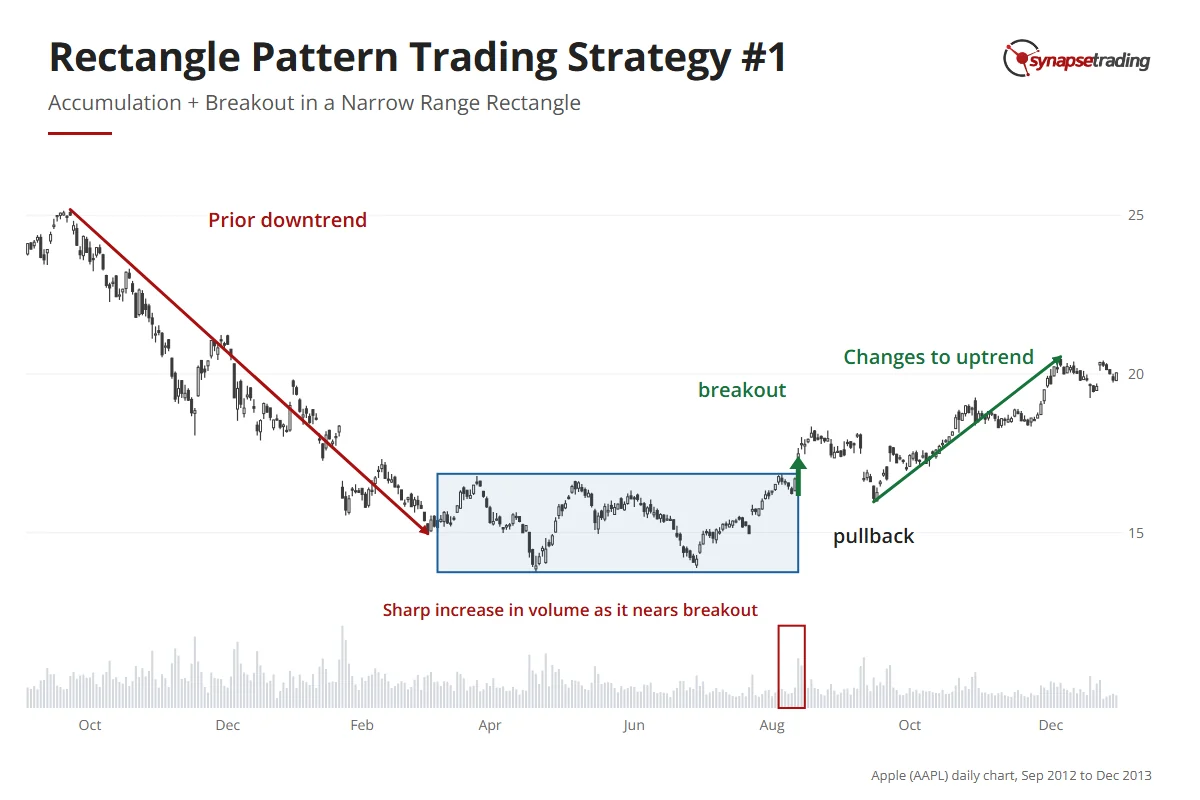
Apple daily chart, late 2012 to 2013: a downtrend, then a flat range, a breakout on rising volume, a pullback, and a new uptrend.

You can enter as the breakout candle closes, or wait for the first pullback. Personally, I take the pullback more often. It still gets me in near the start of the new leg, and the stop sits just below the level that broke, which keeps it tight.

Do note that a narrow range can still end in a reversal if it drags on. The longer a consolidation lasts, the more the people riding the old trend start to doubt it.

Strategy 2: How do you trade a rectangle in the middle of a trend?

The second narrow-range strategy is to find a small rectangle partway through an existing trend, and enter when the trend resumes.

Speed matters here. The longer the pause, the less likely the trend is to continue, so the faster the breakout comes, the better your odds.
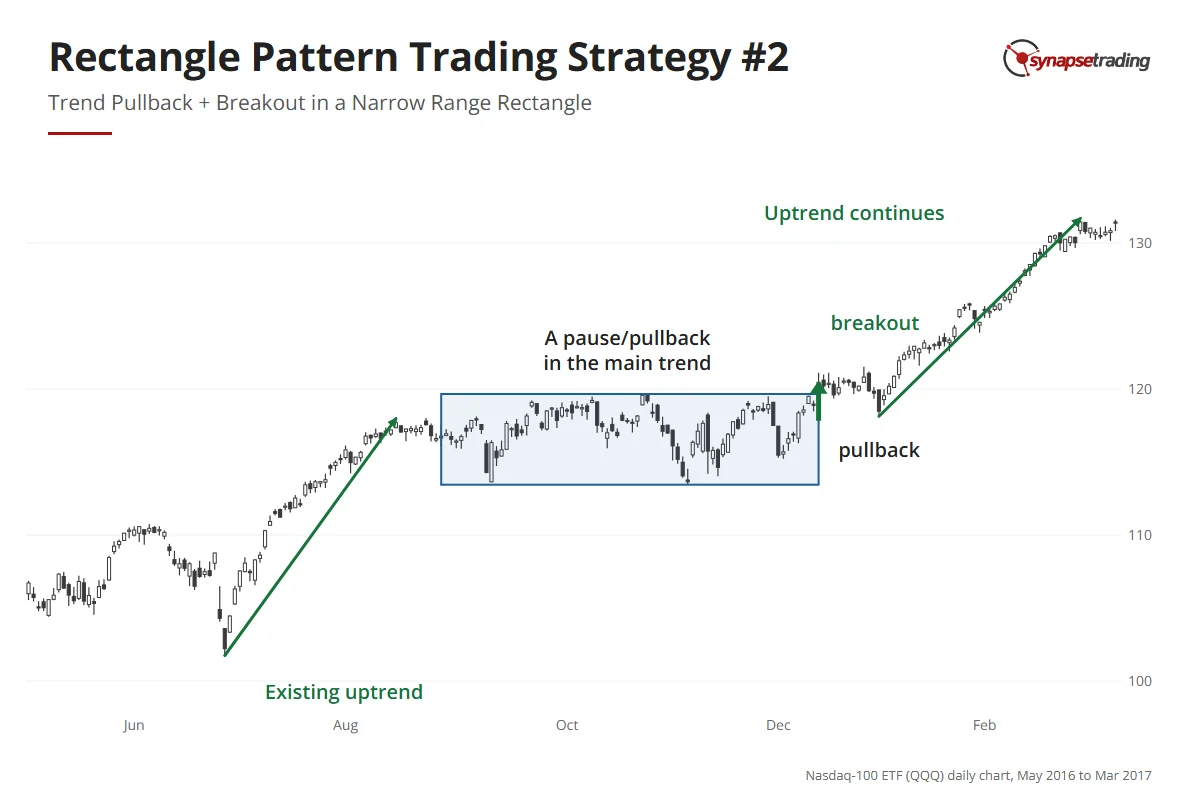
Nasdaq-100 ETF daily chart, 2016 to early 2017: an uptrend, a pause in a narrow range, a breakout, a pullback, and the uptrend continuing.

In a clean example, an uptrend pauses inside a small box, then breaks upward and carries on as if it had only stopped for a drink. The entry is the same as before, at the breakout or the first pullback.

Strategy 3: How do you buy low and sell high inside a wide range?

In my outlook on 12 March 2026, QQQ, the fund that tracks the Nasdaq 100, had been moving up and down inside a box. Three times it tried to break out to the downside, and three times it failed and went back up. “There is strong support at the bottom of the box,” I said on the video. There was strong resistance at the top too.

That is a wide range doing what wide ranges do, where false breakouts are more common than real ones, so instead of chasing them you buy near the bottom and sell near the top. Sometimes that means fading a breakout, which is trading against it because you expect it to fail.
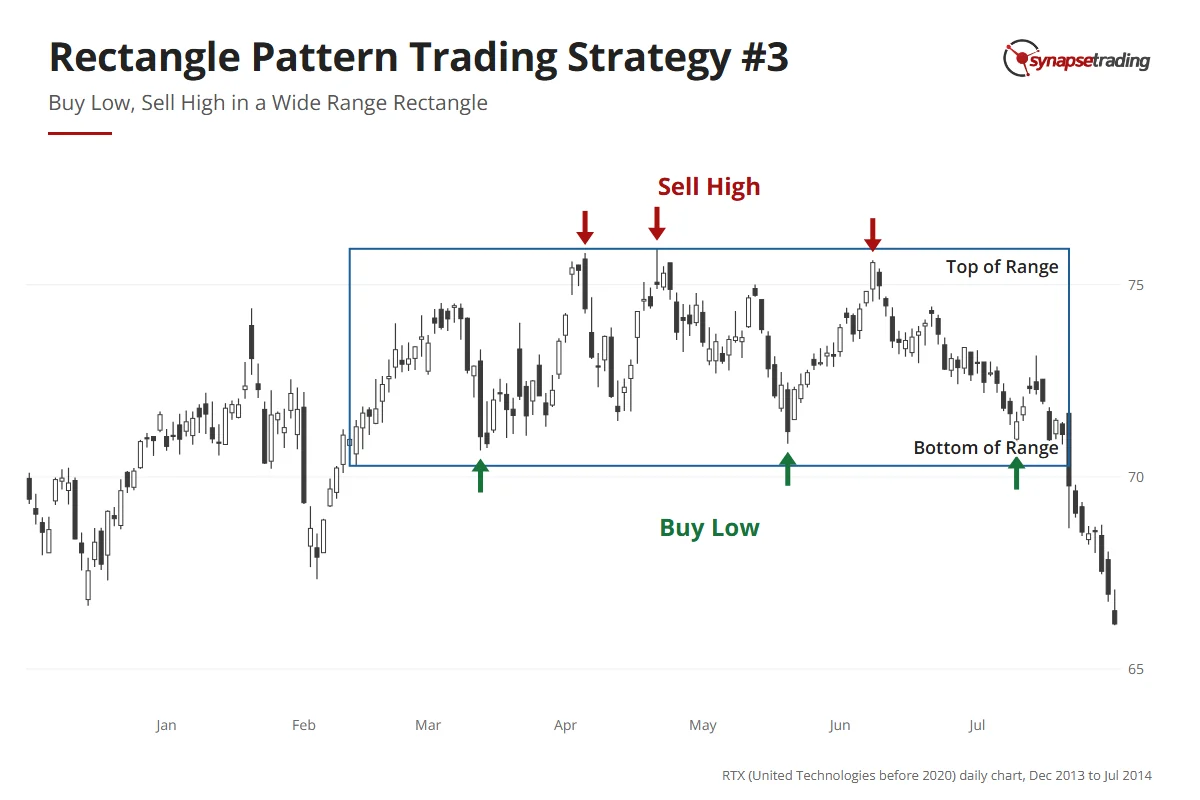
United Technologies (now RTX) daily chart, 2014: price swings between the top and the bottom of a wide range; sells are marked at the top and buys at the bottom.

For this to work, the range has to be clearly defined. It also has to be wide enough to leave real “meat” on the trade, meaning room for price to travel from one side to the other after you allow for your stop. You can scale in as well, building buys while price sits in the lower end of the range, then selling those off and building shorts as it reaches the top.

Eventually one of the breakouts will be real. Nobody rings a bell. When that happens, cut the position and get out fast, because fading the edge of a range that has already ended is how a small loss turns into a large one.

Ranges reward patience more than speed, which is the idea behind the free 15-minute swing trader checklist I run each day.

Strategy 4: Why wait for the pullback after a wide-range breakout?

After the sharp drop on 10 October 2025, the S&P 500 settled into a range. Over the next two days it tried to break out on the downside and failed, then tried the upside and failed again, and by my outlook on 23 October it was back in the middle.

Anyone who traded the first move got whipsawed. Anyone who bought early got caught. My conclusion on the video was short: “for this kind of scenario it’s usually better to wait”.

That is the fourth strategy. In a wide range, you only enter a breakout after the pullback, never on the breakout candle itself. Watch how strong the breakout is and how far it runs, then wait for price to come back and retest the broken level, and enter only if that level holds.
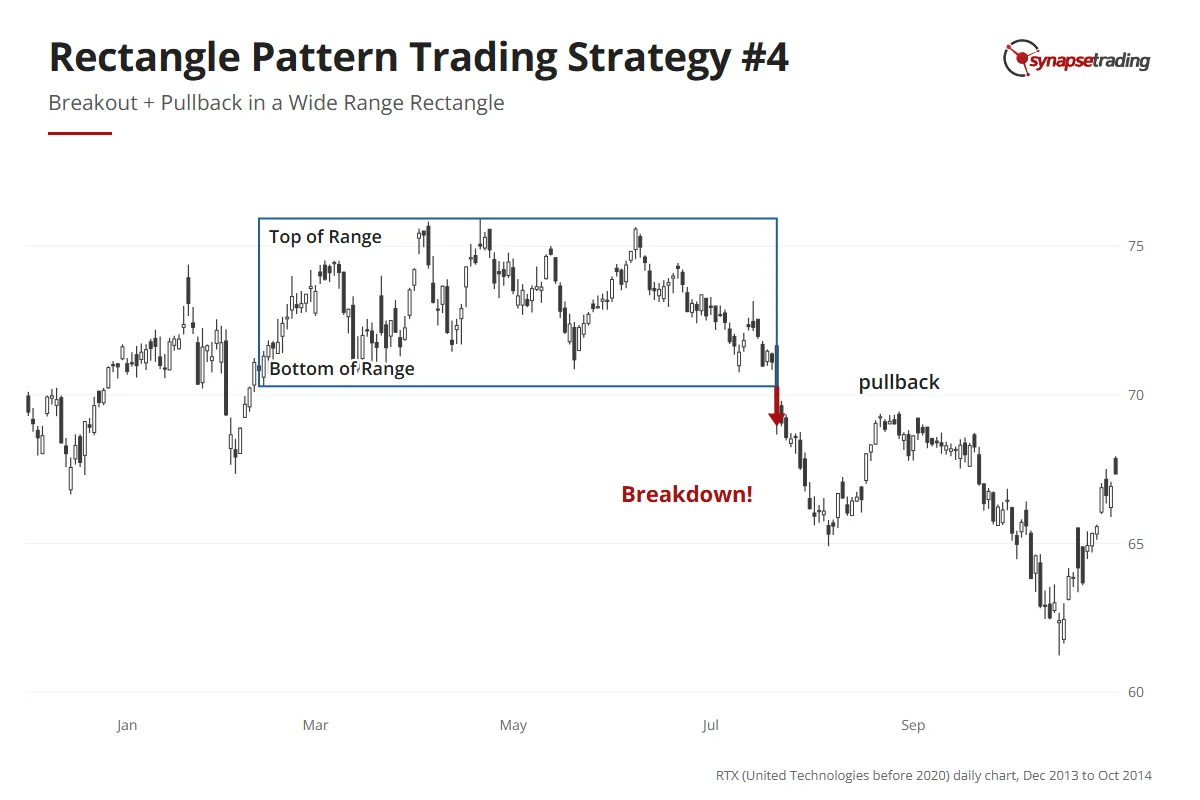
United Technologies (now RTX) daily chart, 2014: a wide range breaks down in July, price pulls back toward the old bottom, then falls further.

On 8 November 2023, a trader on Reddit’s r/Daytrading raised the obvious problem with all this waiting. They wrote that “the market does not give much time in practice to act”. By the time a breakout looks convincing, the stop is far away and the target is close.

It is a fair complaint. Part of it is simply true. Some strong breakouts never come back for a retest, and if you only take the pullback, you will watch a few leave without you. I accept that, because in a wide range the failed breakouts outnumber the clean ones, and the retest is what tells them apart while the stop is still close.

My own records keep me modest about this. The trades I tagged as breakouts, rectangles included, have not won much more often than the rest of my book. The pattern does not win by itself, which is why the entry and the stop do so much of the work.

How do you set a profit target on a rectangle pattern?

A finished rectangle tells you roughly how far the move might go. Take its full height and project that distance from the breakout point, and that level is your minimum target.

Here is a made-up example. Say an index has been stuck between 4,900 and 5,000 points.

The rectangle is 100 points tall, so a breakout above 5,000 has a minimum target of 5,100.

Now add the stop. Suppose you enter on the retest at 5,010, with the stop at 4,970, just below the old resistance. You are risking 40 points to make 90, a reward of 2.25 times the risk.
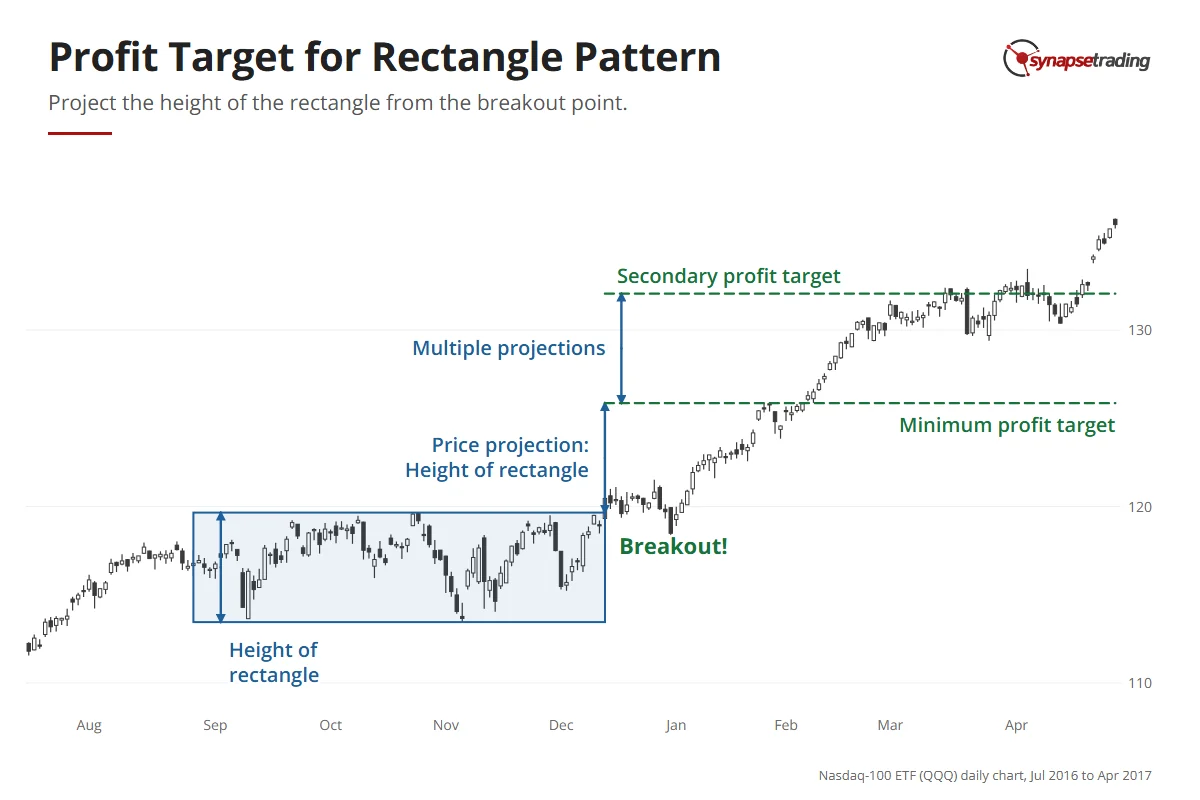
Nasdaq-100 ETF daily chart, 2016–2017: the height of a narrow rectangle is projected up from the December breakout once for a minimum target and twice for a secondary target.

On a small rectangle, you can stack several projections for several targets. And a projection that lines up with an old support or resistance level is worth more than either one alone.

If you want a routine that keeps this to a few minutes after work, grab the free 15-minute swing trader checklist.

Which rectangles should you leave alone?

What is the right number of trades in a messy, sideways market? Quite often it is zero. A line I keep repeating to students is “trade smaller and trade less when the market is harder to trade”, and the rectangle is where it earns its keep.

  1. Trade with the larger trend. The breakout that goes with the bigger trend has the odds behind it.
  2. Size down when the range is wide. The wider the range, the bigger the risk, and the higher the chance the trend changes.
  3. Wait for the pullback when in doubt. It costs a little on the entry and saves you most of the fakeouts.

FAQ

Is a rectangle pattern bullish or bearish?
It follows the trend before it. A rectangle in an uptrend leans bullish and one in a downtrend leans bearish, though wide rectangles are more likely to reverse.

What is the difference between a narrow and a wide rectangle?
Height. A narrow rectangle usually continues the trend, so you trade the breakout. A wide one throws off many false breakouts, so you trade inside it and only take a breakout after the pullback.

How do you avoid false breakouts on a rectangle?
Wait for a candle to close beyond the line on strong volume, and treat a wick through it as noise. In a wide range, enter only on the pullback.

How do you set a profit target on a rectangle pattern?
Project the full height of the rectangle from the breakout point, and treat that level as a minimum target.

Where do you put the stop-loss on a rectangle breakout?
Just beyond the level that broke. If price falls back inside the box, the breakout has failed.


Now that you have all four strategies, which one suits the way you trade, and has a range ever whipsawed you before it finally broke? Let me know in the comments.

To see the rectangle next to every other chart pattern, read the Guide to Trading Price Chart Patterns. Its close cousins are ascending and descending triangles and the expanding triangle, and the rest of the basics are in my free trading guides.

thumbnail the definitive guide to trading price chart patterns

If you would like to learn all the different price chart patterns, also check out: “The Definitive Guide to Trading Price Chart Patterns”

And if you want a routine that does not need you watching every candle, grab the free 15-minute swing trader checklist.


About the author. Spencer Li is The 15-Minute Trader and the founder of Synapse Trading. He is a Certified Financial Technician (CFTe) with 15+ years of trading, run from 70+ countries. He holds a B.Acc and B.BM from SMU. Every trade he takes is public, dated, losses left in. He teaches low-risk swing trading in 15 minutes a day, one system for any market.

Education, not financial advice. Synapse Trading is not licensed by MAS to advise on investment products. Trading carries risk of loss, and past performance is not indicative of future results.
by Spencer Li
https://synapsetrading.com/wp-content/uploads/2026/10/rectangle-pattern-strategy-card.webp 630 1200 Spencer Li https://synapsetrading.com/wp-content/uploads/2026/10/synapse-logo-horizontal-light.png Spencer Li2021-05-16 18:58:032026-09-21 16:02:49Rectangle Pattern Trading Strategy: 4 Ways to Trade the Breakout and Avoid the Fakeouts
Spencer Li

Triangle Pattern Trading: How to Trade the 3 Types of Triangle and Catch the Breakouts That Hold

Technical Analysis & Price Action
Trade the three triangles - chart patterns

By Spencer Li, CFTe · Last updated: 10 August 2026

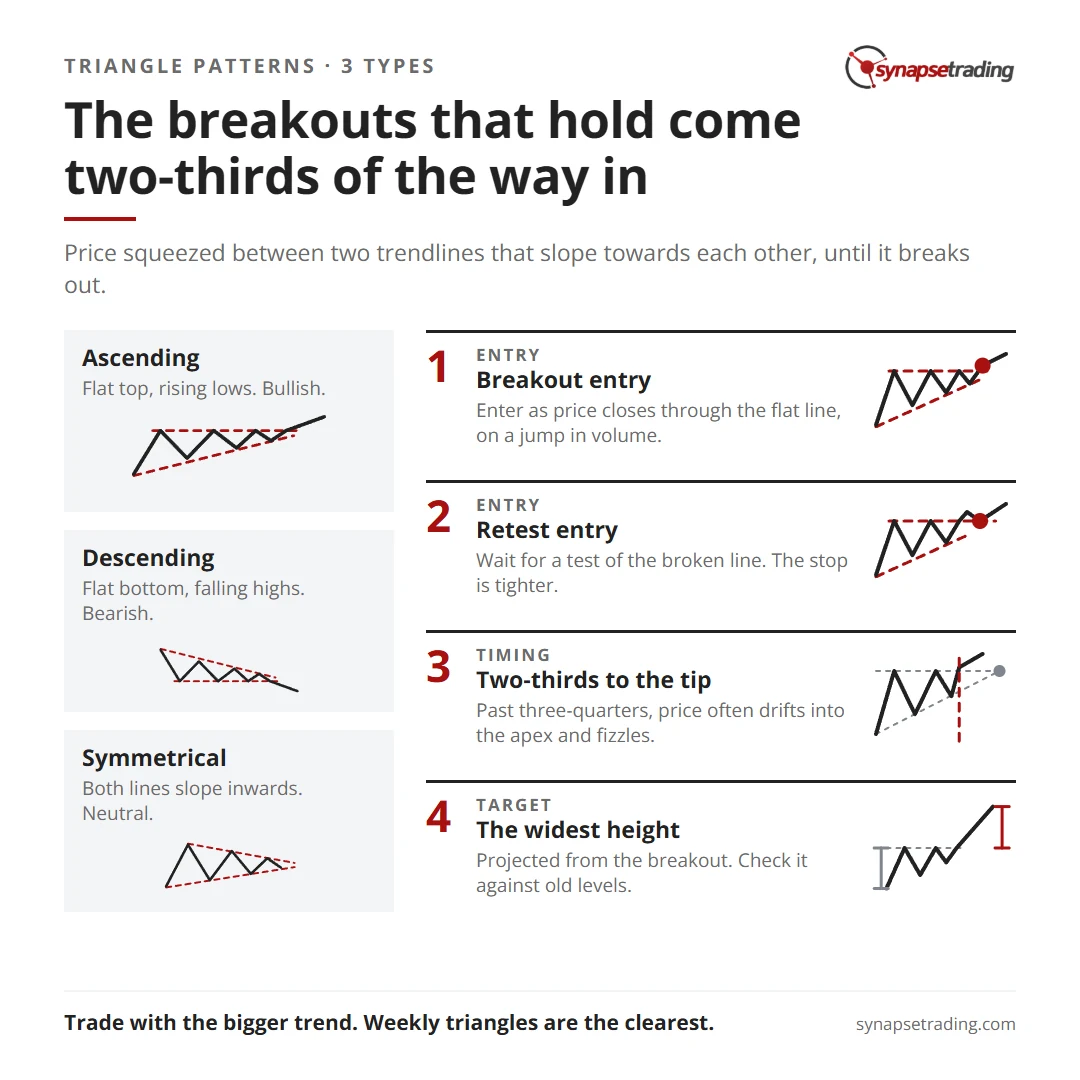
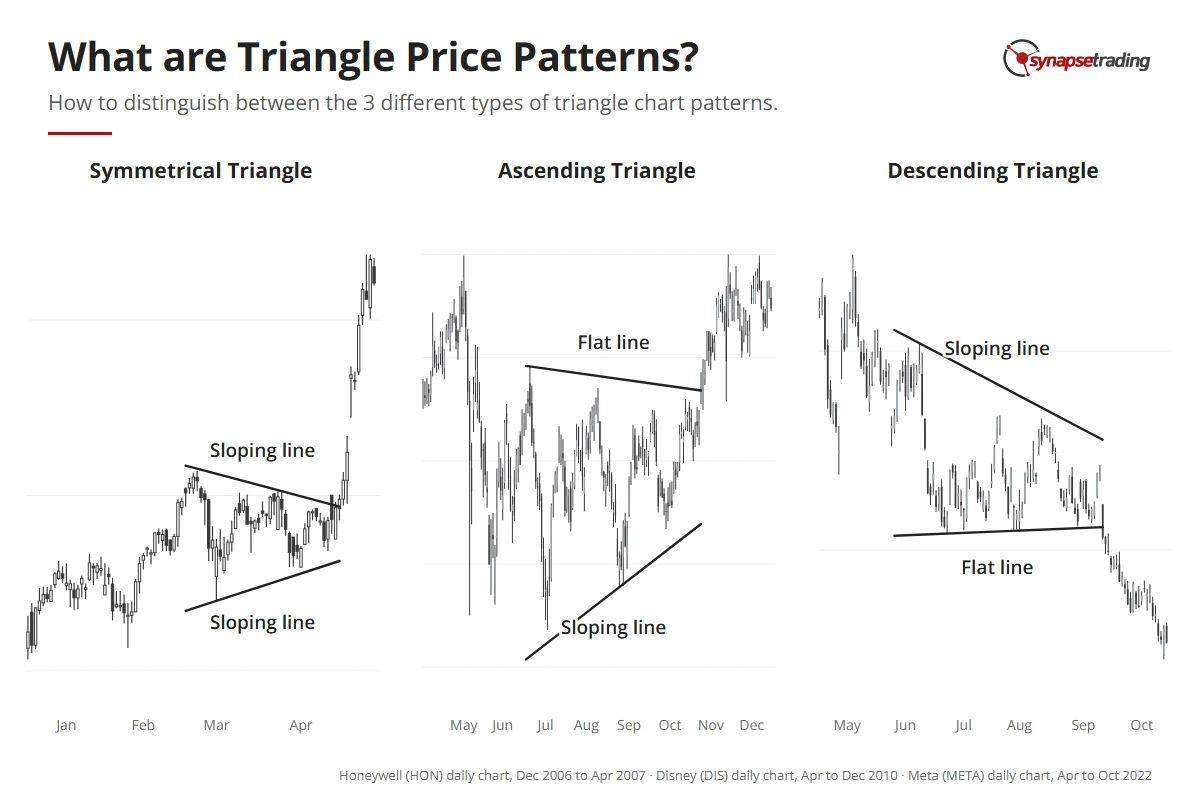
A triangle pattern is a chart pattern where price gets squeezed between two trendlines that slope towards each other, until it breaks out, usually in the direction of the trend that came before it. There are three types. The ascending triangle has a flat top and rising lows and leans bullish, the descending triangle has a flat bottom and falling highs and leans bearish, and the symmetrical triangle has both lines sloping inwards. You can trade the first two by entering on the breakout or by waiting for a retest of the broken line, and the breakouts that hold tend to come about two-thirds of the way to the tip.

I first wrote this guide in January 2021. When I went back through 29 of my weekly market outlook videos from October 2025 to June 2026 to update it, the words “ascending triangle” came up in 18 of them. The descending triangle came up in none, which probably says more about the past year’s market than about the pattern.

Triangle pattern cheat sheet: ascending, descending and symmetrical triangles, the breakout and retest entries, timing and the target.

What is a triangle pattern?

One of the best descriptions I know comes from a book first published in 1948. In Technical Analysis of Stock Trends, Robert Edwards and John Magee call the symmetrical triangle a “coil”, and it is a good name, because price gets wound tighter and tighter until it snaps free.

Each swing inside a triangle is a little smaller than the one before, so the two lines you draw across the highs and lows meet at a point on the right. That point is the apex. In my experience it is a medium-term pattern of about 50 to 100 bars, and it tends to show up in the middle or late stages of a trend.

Edwards and Magee also wanted to see four turns before calling anything a triangle: a top, a bottom, a lower top and then a higher bottom. With fewer than that, you are mostly joining dots.

Three real triangles: Honeywell 2007 (symmetrical, both lines sloping), Disney 2010 (ascending, flat top and rising lows), Meta 2022 (descending, falling highs and flat bottom).

What is happening inside the triangle?

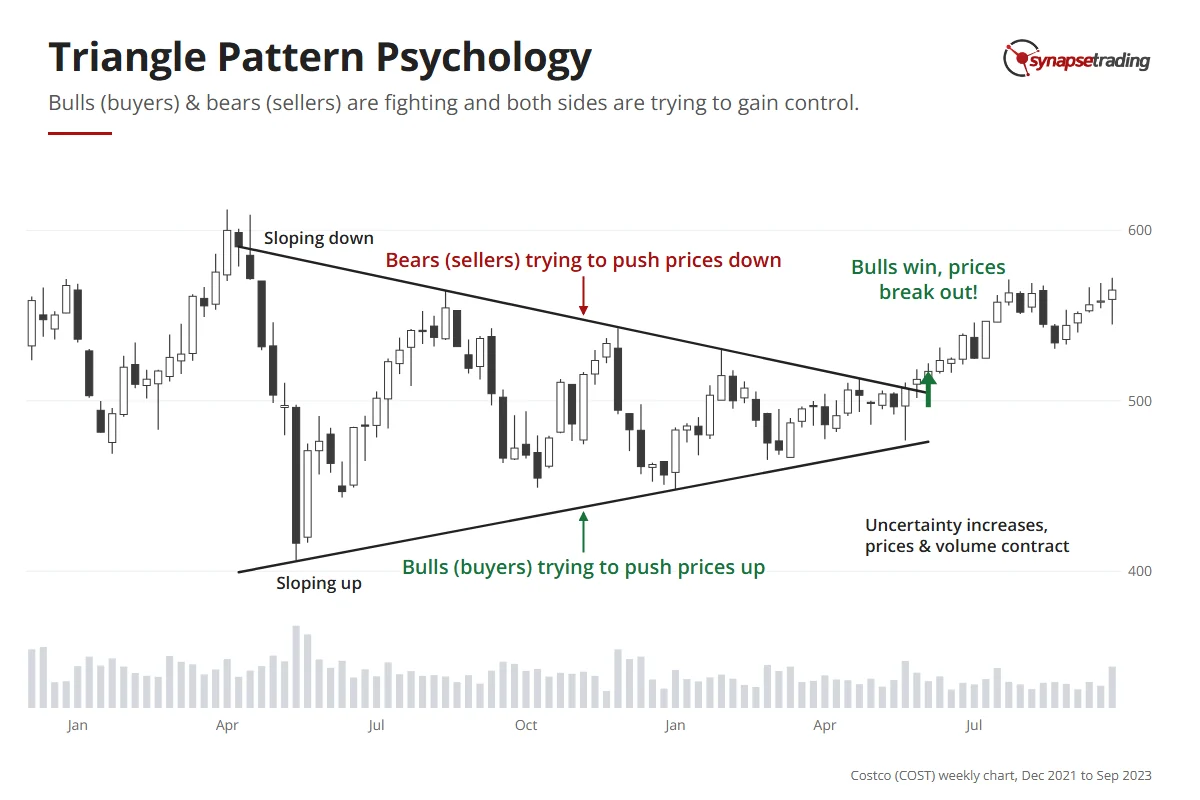
Think of a loaded spring. Bulls want higher highs and higher lows, bears want lower highs and lower lows, and inside a triangle neither side gets its way. So the swings shrink and volume dries up, as both sides step back and wait for the other to blink.

When price finally breaks one of the lines, the traders who were sitting on their hands jump in at once. That is why a real breakout tends to come with a jump in both price and volume.

An old Wall Street saying explains the volume rule. It takes buying to push a stock up, while a stock can fall under its own weight. So an upside break needs volume to be trusted, and a downside break often starts quietly.

Costco weekly chart, 2022 to 2023: a symmetrical triangle with falling highs (sellers) and rising lows (buyers) that narrows until buyers win and price breaks out.

What are the three types of triangle?

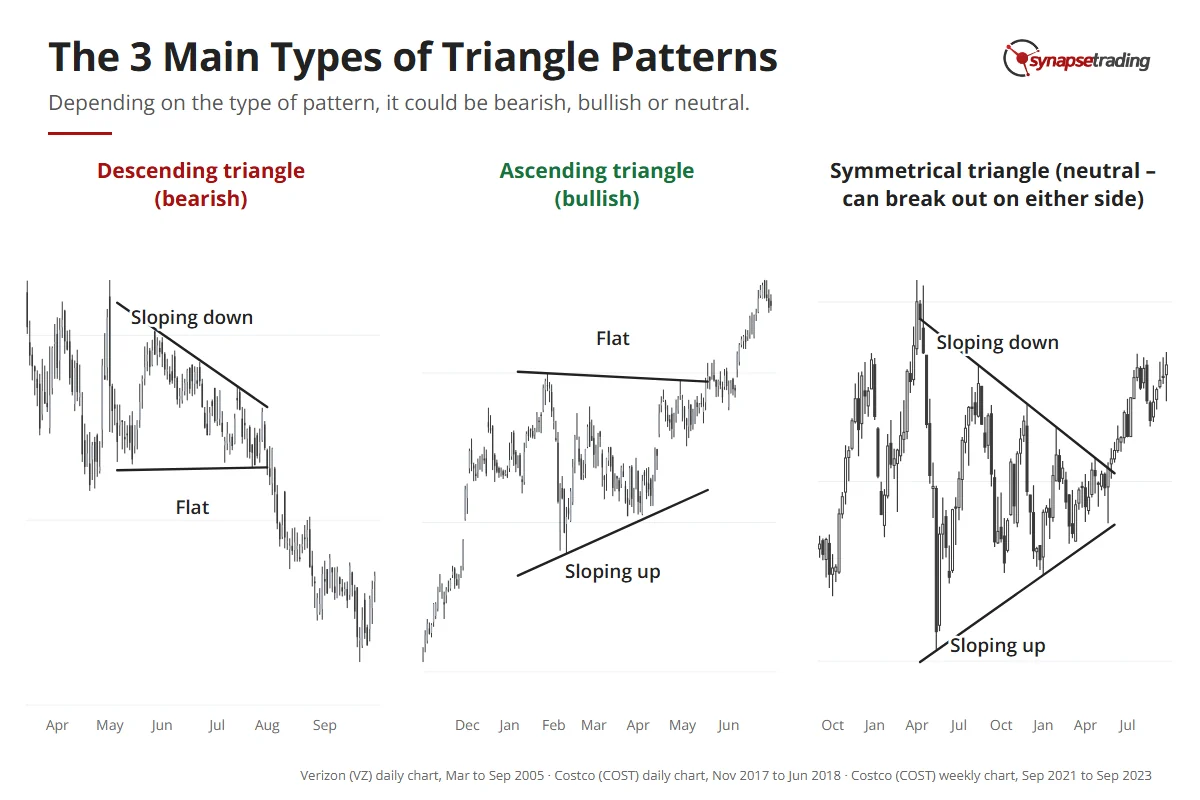
So which way will it break? The slope of the lines usually tells you before price has done anything. A flat line is a level that price keeps attacking, and the sloping line shows which side is gaining ground.

TriangleShapeBiasUsually breaksHow I treat it
AscendingFlat top, rising lowsBullishUp, especially in an uptrendMy favourite of the three
DescendingFlat bottom, falling highsBearishDown, especially in a downtrendThe mirror image
SymmetricalBoth lines sloping inwardsNeutralEither way, leaning with the trendOnly with a strong trend behind it

Three real triangles: Verizon 2005 descending triangle breaking down, Costco 2018 ascending triangle breaking up, Costco 2022–23 symmetrical triangle.

In an ascending triangle, buyers keep stepping in a little higher each time while sellers keep selling at the same price, and sooner or later the sellers run out of shares. Edwards and Magee put the buyers’ odds at around 9 to 1 once the rising line is clear. That came from their experience rather than a count, and 1948 had no algorithms, so I treat it as a strong lean.

The descending triangle is the mirror image, with lower highs pressing down on a flat floor, and when the floor breaks, holders who watched it hold for weeks lose their nerve and sell too. Fear does a lot of the work in a descending triangle.

Why did I stop skipping the symmetrical triangle?

In the 2021 version of this guide, I said I mostly leave the symmetrical triangle alone. I still think it is the weakest of the three. Edwards and Magee called it the “worst offender” for false moves in their whole book, which is quite a title to hold.

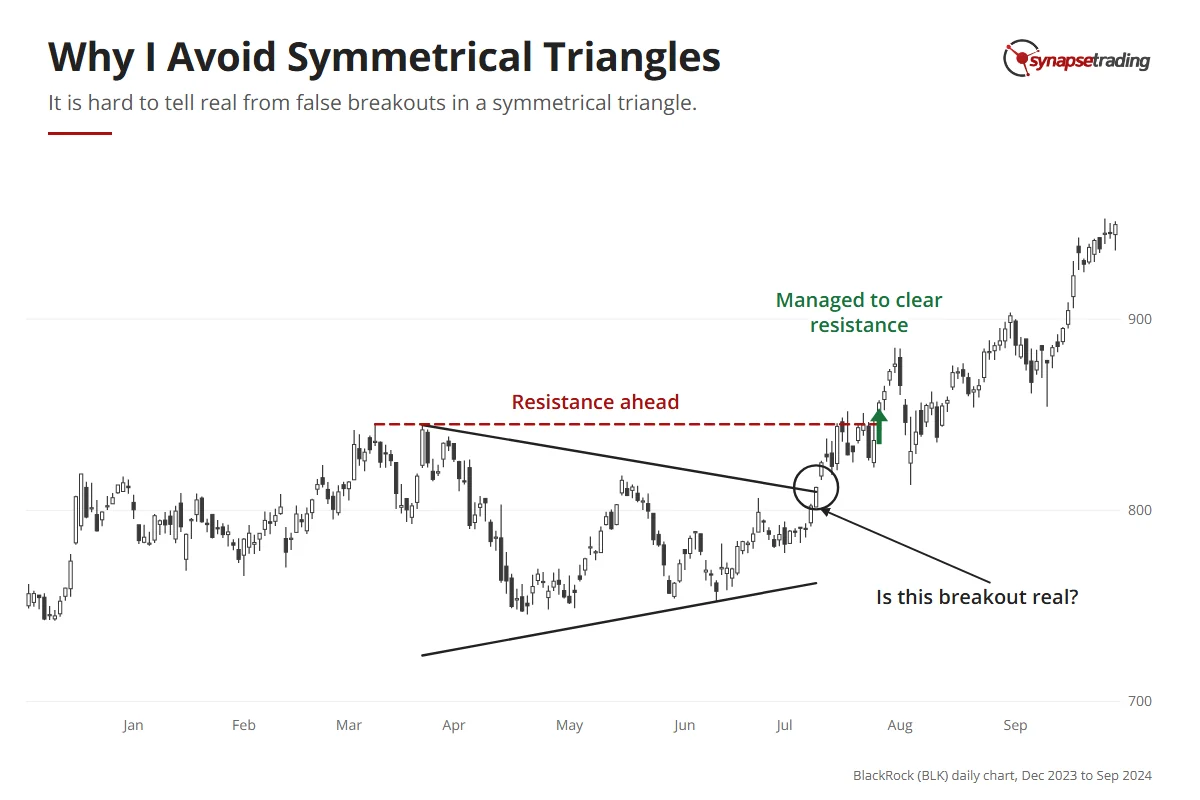
The trouble is confirmation. When price breaks out of the top of a symmetrical triangle, an earlier swing high is still sitting above it. Price has to clear that too before you know it is trending rather than sloshing around a wider range. By then, the clean entry has usually gone.

BlackRock daily chart, 2023 to 2024: a symmetrical triangle breaks out in July 2024 with the March high still overhead as resistance, which price later clears.

But I have softened on it, and my own outlooks show it. On 27 November 2025, I said that gold “looks like it has just broken out of this symmetrical triangle pattern,” and that I had added some positions. Three weeks later, I described gold as a consolidation forming inside an uptrend, and silver beside it had already formed a clean ascending triangle near its all-time highs. The trend did the confirming for it.

Edwards and Magee suggested much the same. A symmetrical triangle gives few clues on its own chart, so you look at the other charts, and if most look bullish, yours will probably break upwards too. I noticed this on 29 January 2026, when quite a few sector ETFs were forming ascending triangles at once, and so were the S&P 500 and the QQQ. One triangle is a guess. The same triangle across a whole list of sectors is the market telling you something.

If you would rather check charts for a few minutes after work than all evening, my free 15-minute swing trader checklist is the daily routine I use myself.

When does a triangle usually break out?

Here is an odd thing about triangles. You would expect a longer squeeze to build more pressure, but the longer price waits inside the pattern, the weaker the breakout tends to be.

The breakouts that hold usually come when price is about two-thirds to three-quarters of the way to the tip. Edwards and Magee gave a range of half to three-quarters, and picked out two-thirds as the most reliable spot. Past the three-quarter mark, price often just drifts into the apex and fizzles out. Their advice for that case is the most useful line in the chapter: “go away and look for something more promising elsewhere in your chart book.”

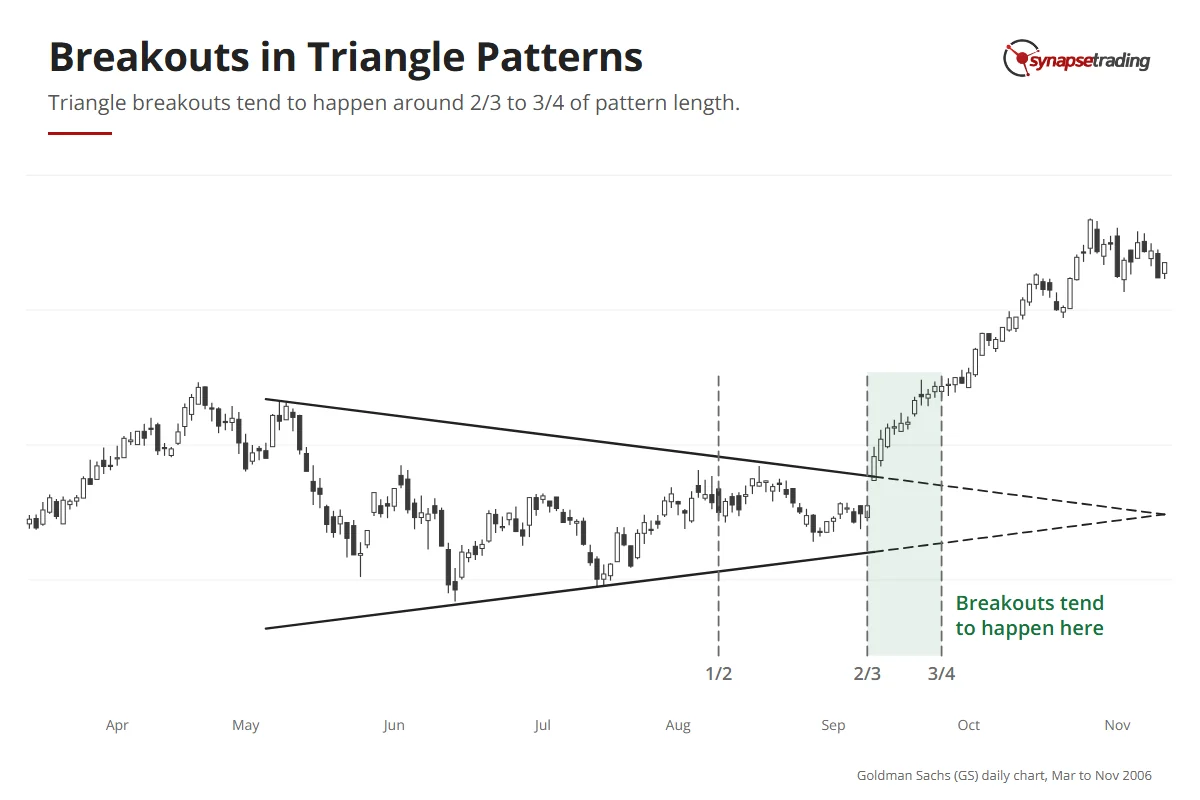
Goldman Sachs daily chart, 2006: a symmetrical triangle with markers at one half, two thirds and three quarters of the way to its apex; the breakout comes at two thirds.

Personally, I measure it by eye, by extending both lines to where they meet, and if price is already deep into the last quarter, I move on to the next chart.

How do you trade a triangle breakout?

There are two main ways to trade the ascending and descending triangles, and the difference is how early you get in.

EntryWhat you doBest whenStop goes
Breakout entryEnter as price closes through the flat lineStrong prior trend, small triangleBeyond the breakout bar
Retest entryWait for price to test the broken line, then enterLarge triangle, or one that fights the trendBeyond the end of the pullback

With the breakout entry, you buy as price closes above the flat top of an ascending triangle. My own scan asks for a close, since a wick that pokes through and falls back does not count, and for a clear jump in volume. It works best when the trend before the triangle was strong and the triangle is small.

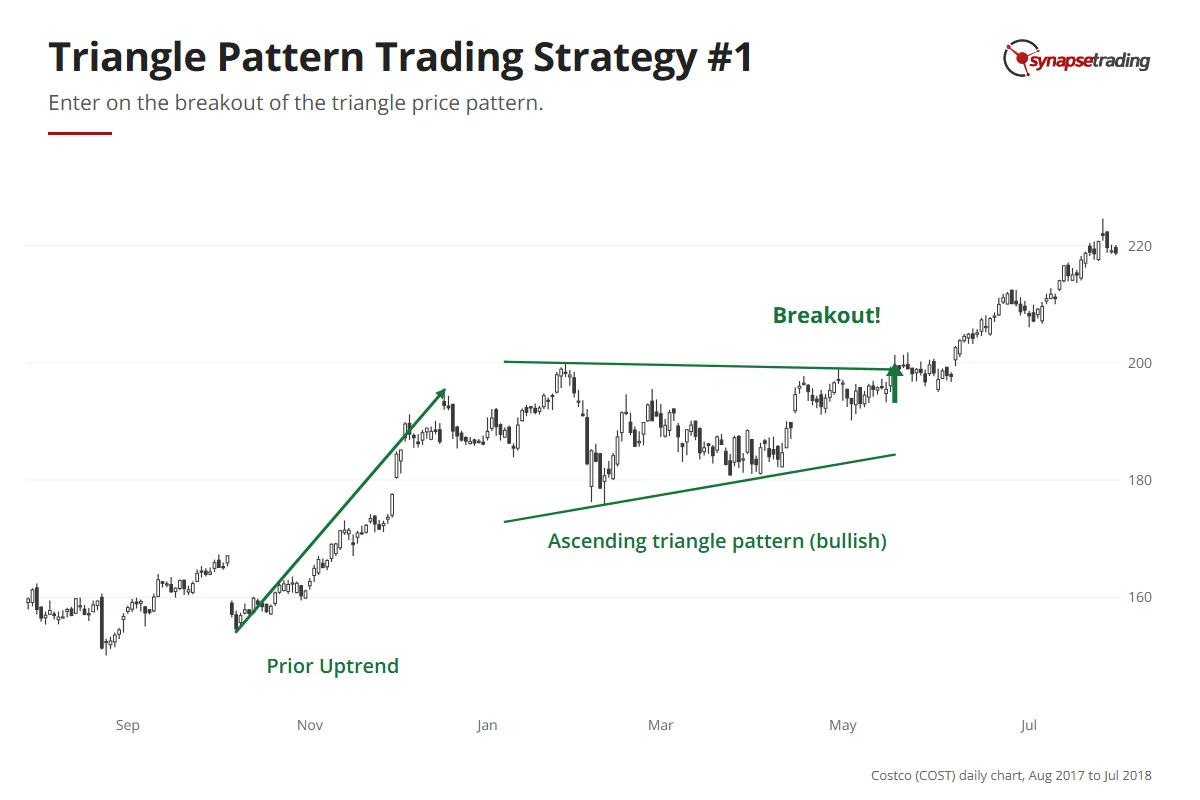
Costco daily chart, late 2017 to mid-2018: an uptrend, an ascending triangle with a flat top and rising lows, and a breakout in May 2018.

With the retest entry, you let the break happen and wait. Say an uptrend is followed by a bearish descending triangle. That is a small contradiction, so the break might be messy. You wait for price to come back up to the old flat support, now resistance, and enter once the pullback ends and price turns down again, with the stop just beyond the end of that pullback. Edwards and Magee noticed that when the rest of the market is firm, this kind of pullback is fairly certain.

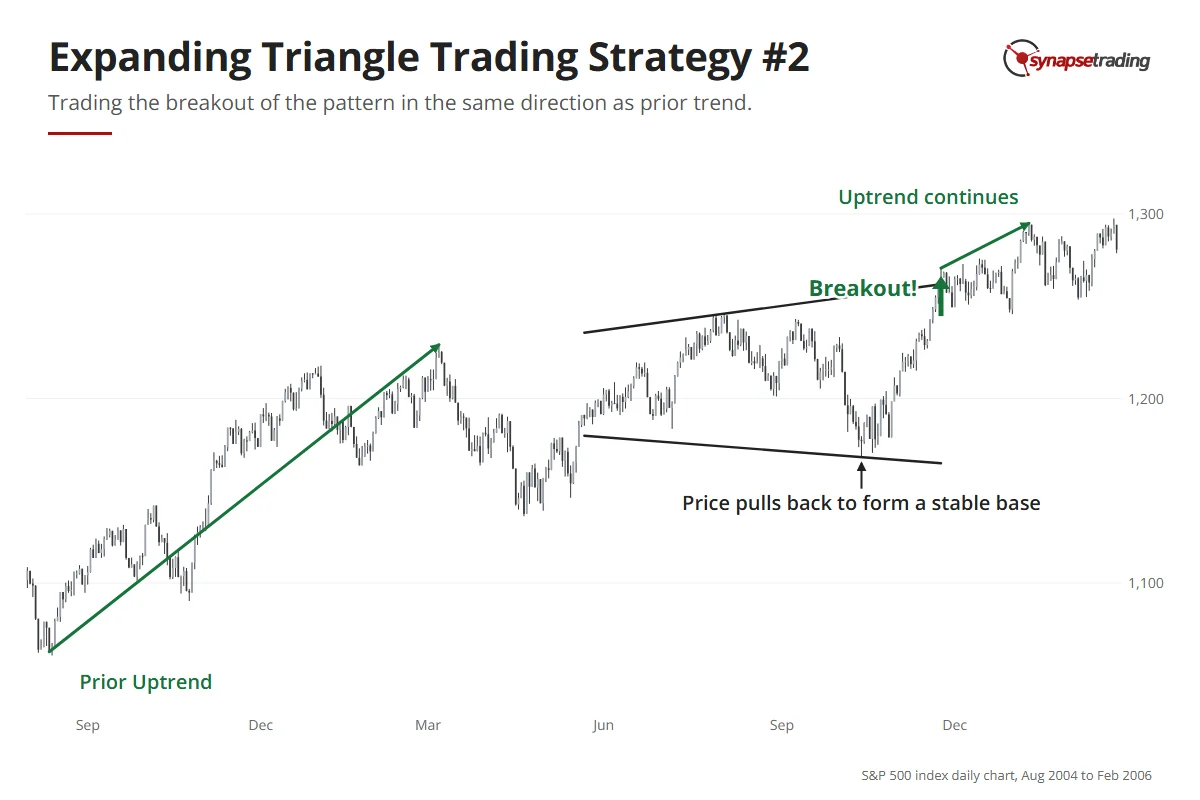
S&P 500 index daily chart, 2004 to 2006: an uptrend, an expanding triangle through 2005, a base at the October low, a breakout in November and a continued uptrend.

In practice, the retest is the entry I take most often, because the stop is tighter. The cost is that the strongest breakouts sometimes leave without you.

I do not always follow my own order either. On 17 December 2025, I said in my outlook that Tesla looked like a giant ascending triangle, and that this was why I had entered before the breakout even happened. That is a more aggressive third way, and I only use it when the bigger picture is already on my side.

How do you set a profit target on a triangle?

On 3 August 2026, a trader on Reddit’s r/technicalanalysis wrote this about the measured move rule: “I don’t use it because I haven’t found it reliable.”

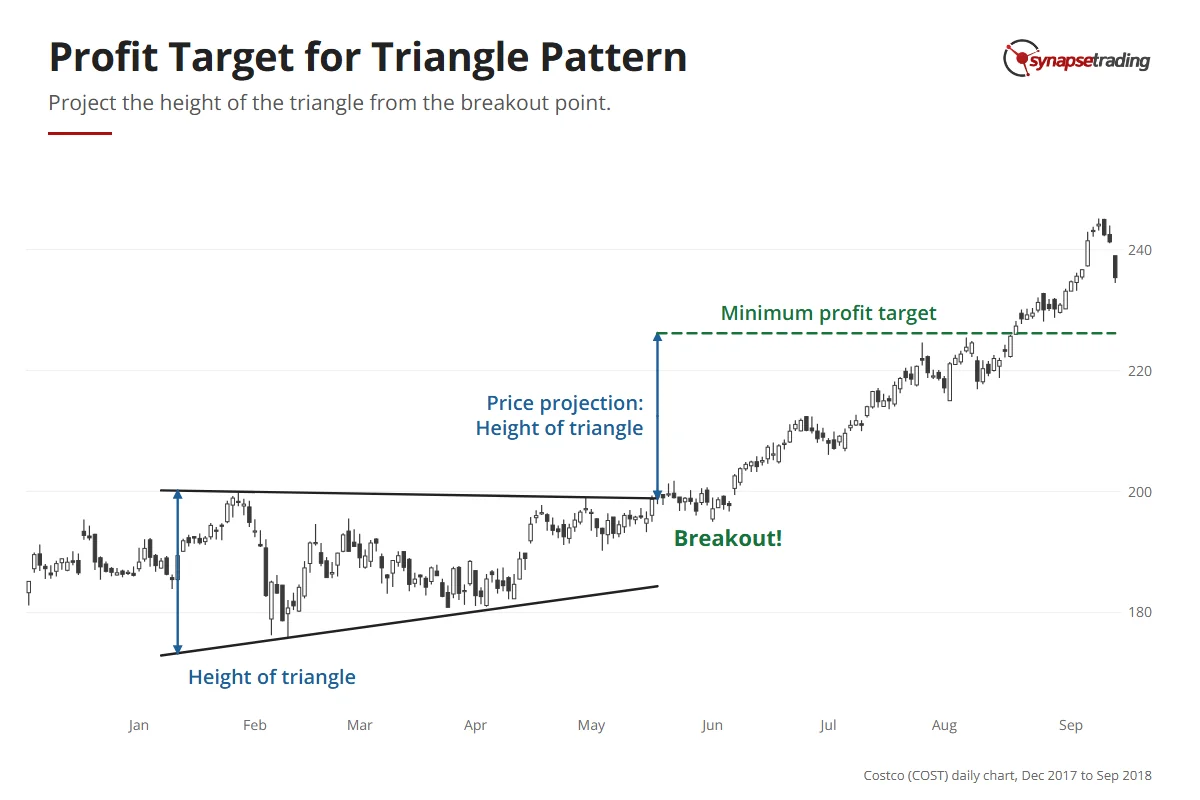
That is a fair point. The rule is simple enough: you take the height of the triangle at its widest part and project that distance from the breakout point. Even Edwards and Magee ranked the triangle’s target as less definite and less reliable than the one for head and shoulders.

So I treat the projected level as a minimum target, and where it lines up with a support or resistance level, I trust it more, while in empty space I trust the old levels over the arithmetic.

Costco daily chart, 2018: the height of an ascending triangle is measured and projected up from the breakout point; price reached that minimum target in August 2018.

Say an ascending triangle has a flat top at 50 and its first low at 44, so it is 6 points tall at the widest part.

Price breaks out at 50, and the minimum target is 56, a 12% move.

If there is an old high at 55, I would rather plan around 55 and treat anything above it as a bonus.

If you want a routine that keeps all of this to a few minutes a day, grab the free 15-minute swing trader checklist.

Which triangles are worth your time?

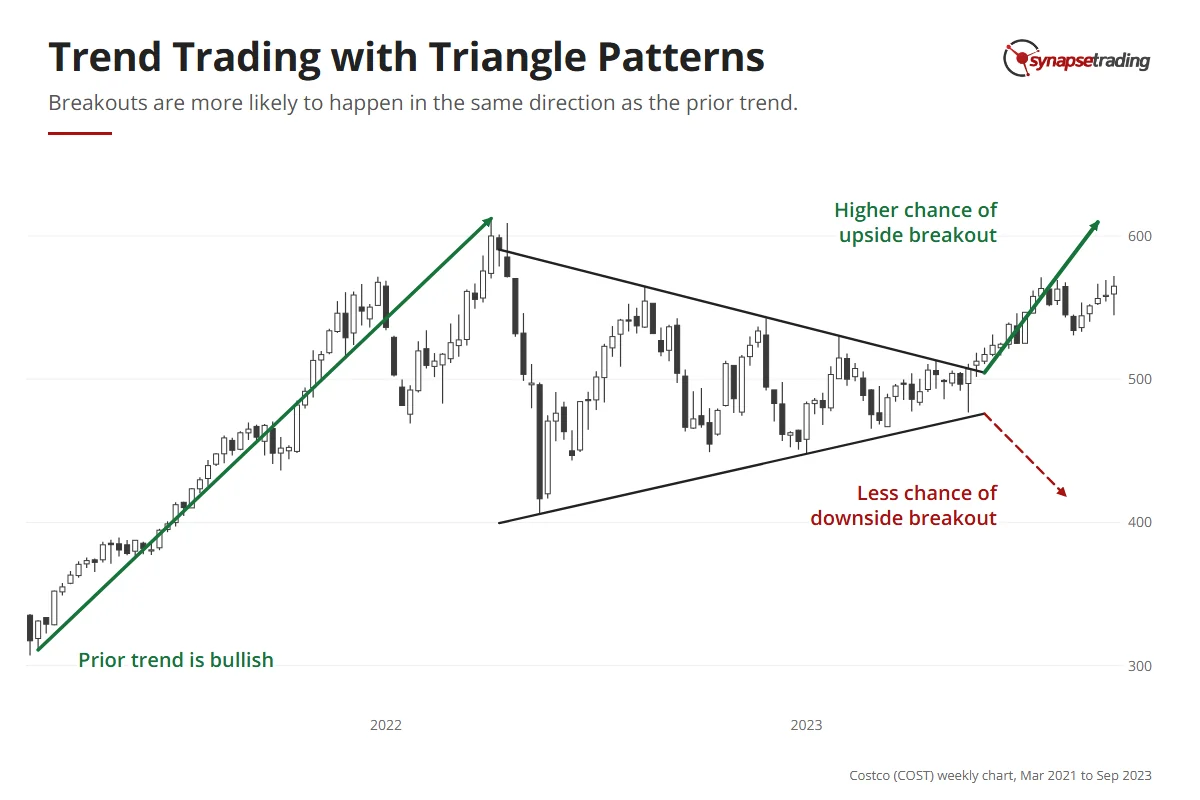
Before I trade a triangle, I ask what the bigger chart is doing. The first thing is the trend. A triangle inside a big uptrend is really a pause, a pullback that happens to be shaped like a triangle, and in that spot even a symmetrical one can beat 50-50.

Costco weekly chart, 2021 to 2023: a strong uptrend, then a symmetrical triangle; at the apex an upside breakout is drawn as more likely than a downside one, and price did break up.

The second is location. Triangles often form at the edge of a major support or resistance level, so you will see them near the necklines of double tops, double bottoms and head and shoulders. Then the larger pattern is what you are really trading.

The third is timeframe. Edwards and Magee found weekly triangles usually clear and dependable, and told readers to dismiss the huge, loose ones on monthly charts that take years to finish. My own rules agree, and a big ascending triangle on a weekly chart is one I am happy to trade, with the daily chart used to time the entry.

FAQ

Is a triangle pattern bullish or bearish?
It depends on the type. The ascending triangle is bullish, the descending triangle is bearish, and the symmetrical triangle is neutral and tends to break with the existing trend.

Which triangle pattern is the most reliable?
The ascending and descending triangles, because the flat line gives you a clear level to trade against. The symmetrical triangle is the least reliable, because its breakout is hard to confirm.

When does a triangle pattern break out?
The breakouts that hold usually come about two-thirds to three-quarters of the way to the tip. Past three-quarters, the pattern often drifts into the apex and fails.

Should I enter on the breakout or wait for the retest?
Take the breakout when the prior trend is strong and the triangle is small. Wait for the retest when the triangle is large or fights the prior trend.

How do I set a profit target on a triangle pattern?
Project the height of the triangle at its widest part from the breakout point. Treat it as a minimum target, and check it against nearby support and resistance.


Which of the three triangles do you see most on your charts right now, and do you take the breakout or wait for the retest? Let me know in the comments.

To see the triangle next to every other pattern, read my guide to trading price chart patterns. Its cousins are the expanding triangle and the rectangle pattern, and I explain how to tell the families apart in continuation and reversal patterns. The rest of my free trading guides are here.

thumbnail the definitive guide to trading price chart patterns

If you would like to learn all the different price chart patterns, also check out: “The Definitive Guide to Trading Price Chart Patterns”

And for a routine that does not need you watching every candle, grab the free 15-minute swing trader checklist.


About the author. Spencer Li is The 15-Minute Trader and the founder of Synapse Trading. He is a Certified Financial Technician (CFTe) with 15+ years of trading, run from 70+ countries. He holds a B.Acc and B.BM from SMU. Every trade he takes is public, dated, losses left in. He teaches low-risk swing trading in 15 minutes a day, one system for any market.

Education, not financial advice. Synapse Trading is not licensed by MAS to advise on investment products. Trading carries risk of loss, and past performance is not indicative of future results.
2 Comments/by Spencer Li
https://synapsetrading.com/wp-content/uploads/2026/10/triangle-pattern-card.webp 630 1200 Spencer Li https://synapsetrading.com/wp-content/uploads/2026/10/synapse-logo-horizontal-light.png Spencer Li2021-01-06 03:15:112026-08-10 14:14:20Triangle Pattern Trading: How to Trade the 3 Types of Triangle and Catch the Breakouts That Hold
Spencer Li

Head and Shoulders Pattern: 3 Ways to Trade the Reversal, and How to Tell a Real One

Technical Analysis & Price Action
Trading head and shoulders - chart patterns

By Spencer Li, CFTe · Last updated: 11 August 2026

The head and shoulders is a reversal pattern that shows up at the end of a long uptrend. Price makes three peaks: a high called the left shoulder, a higher high called the head, and then a lower high called the right shoulder, which fails to get back to the head. That failure is the whole point, because it is the first time in the trend that the buyers have pushed and come up short.

The inverse head and shoulders is the same shape turned upside down, with three troughs at the end of a downtrend.

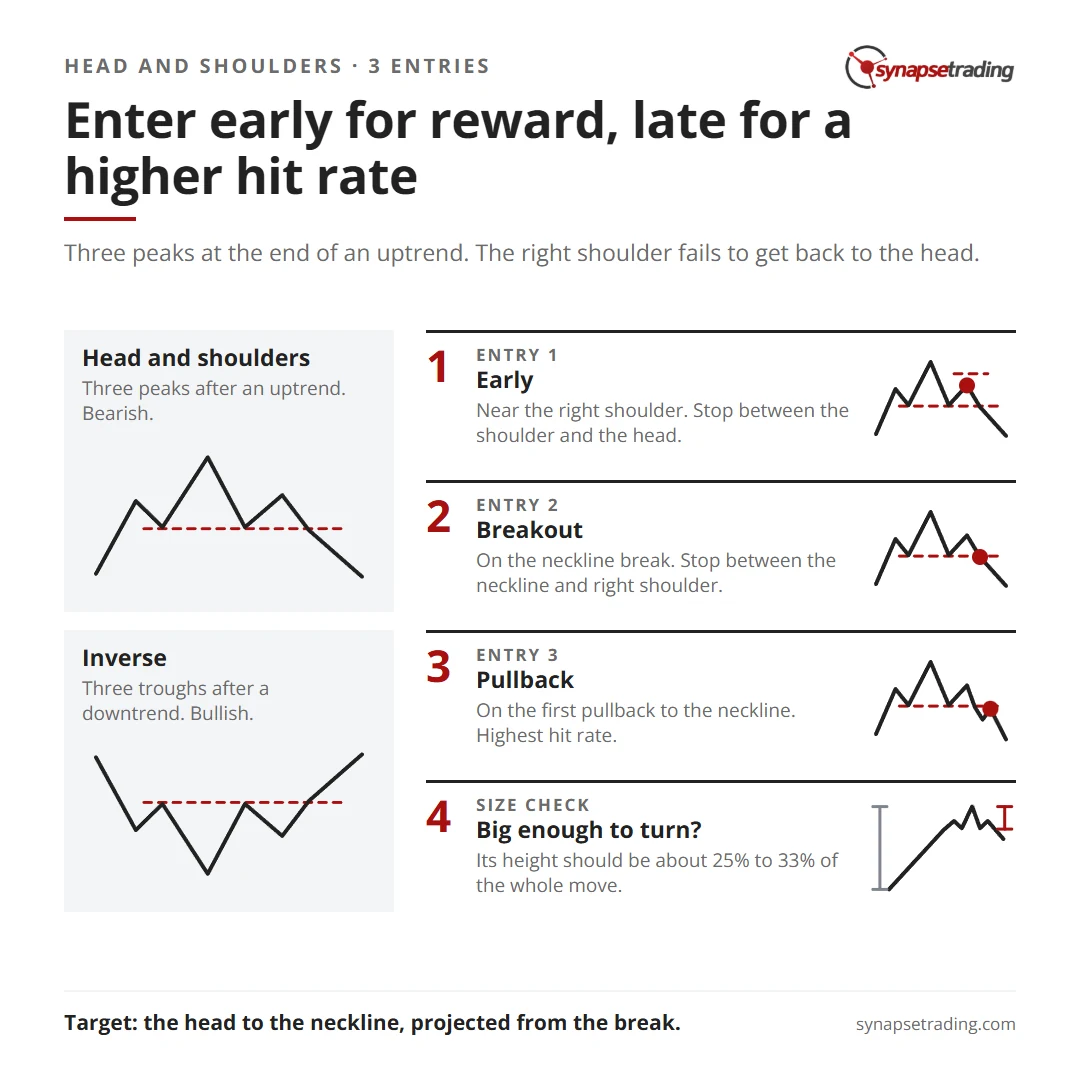
There are three ways to trade it. You can enter early near the right shoulder, on the break of the neckline, or on the pullback after the break. And there is one check that matters more than any entry, which is whether the pattern is big enough to turn the trend at all.

Head and shoulders cheat sheet: the early, breakout and pullback entries, their stops, and the size check on the whole move.

What does a head and shoulders actually look like?

One editor of the classic 1948 textbook on chart patterns, Technical Analysis of Stock Trends by Edwards and Magee, disliked the name “head and shoulders bottom” so much that he renamed it the Kilroy Bottom. He predicted the old name would vanish within a century. So far, it has not been a good bet.

The shape itself is simple. In the bearish version, price rallies to a high and falls back, which is the left shoulder, then rallies to a new high and falls back again, which is the head. The third rally stalls at roughly the level of the first peak. That is the right shoulder.

Now draw a line across the two lows between the three peaks. That line is the neckline, and when price closes below it, the uptrend is over.

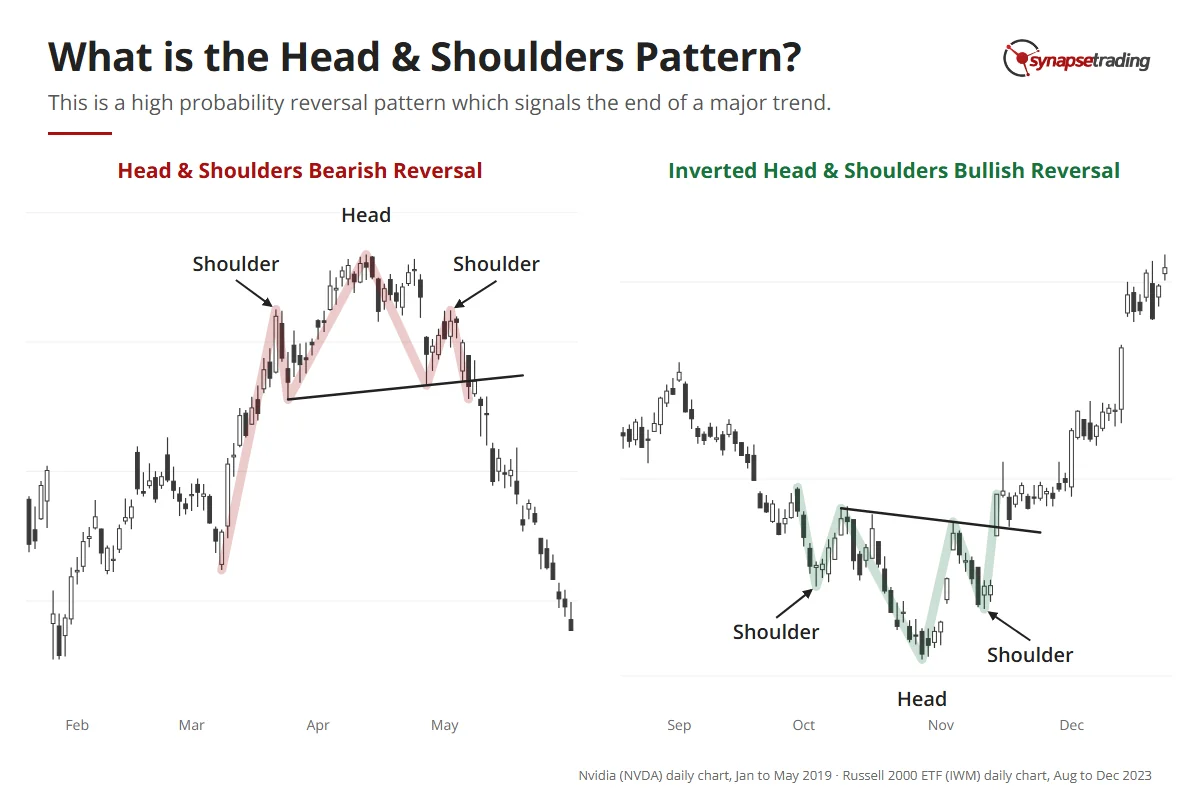
Two real charts: Nvidia in 2019 forms a head and shoulders top and reverses down; the Russell 2000 ETF in 2023 forms an inverted head and shoulders and reverses up.

The inverse version runs the same way in reverse, with a low, a lower low for the head, a higher low for the right shoulder, and a break up through the neckline drawn across the two highs in between.

Why should three bumps on a chart mean anything?

Because the pattern is a picture of one side of the market running out of fuel.

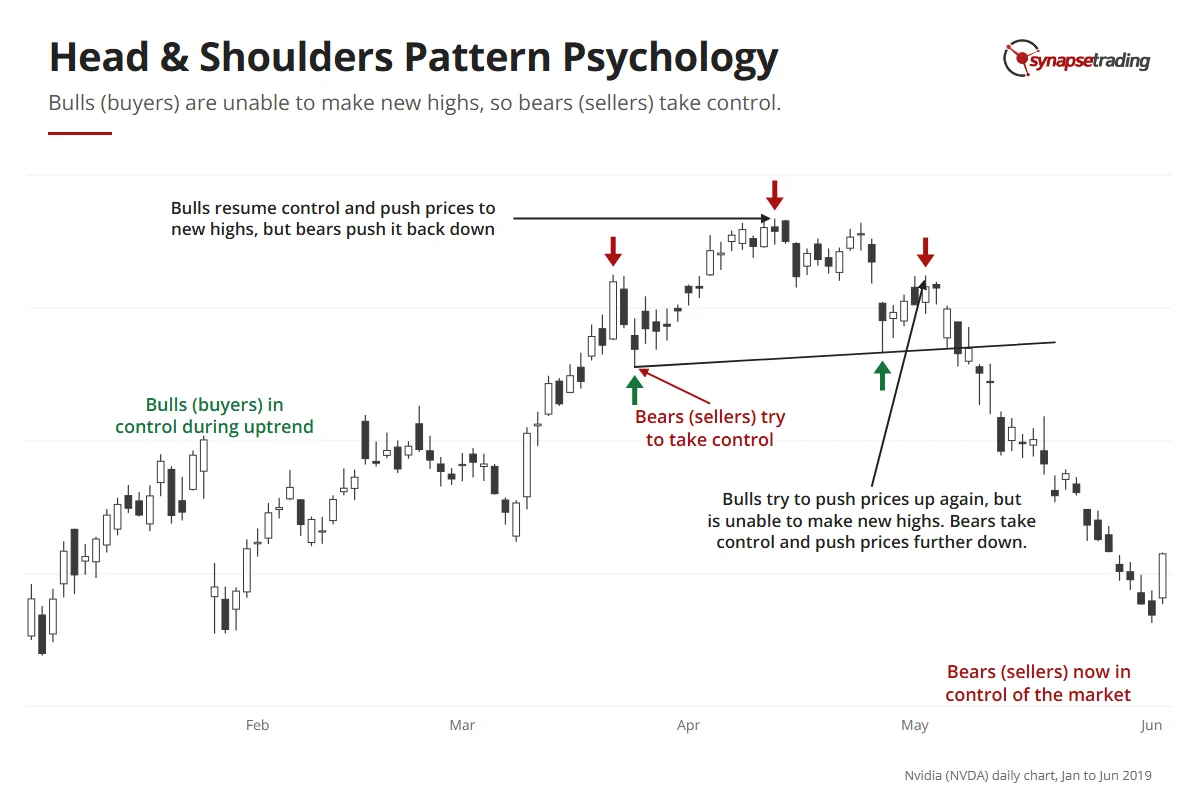
In an uptrend, the bulls are in charge. At some point the bears push back and knock price down, which creates the left shoulder. The bulls shrug it off and drive price to a new high, the head. The bears push back again and price falls towards the level of the first dip, and then the bulls try one last time and cannot make a new high.

That failed last push is the tell. By the time the bears break the neckline, they are pushing against buyers who have tried three times and failed once, and it does not take much fear before the people still holding decide to sell.

Nvidia daily chart, 2019: buyers in control in the uptrend, sellers push back, buyers make one more high that fails, a lower high follows, and sellers take control.

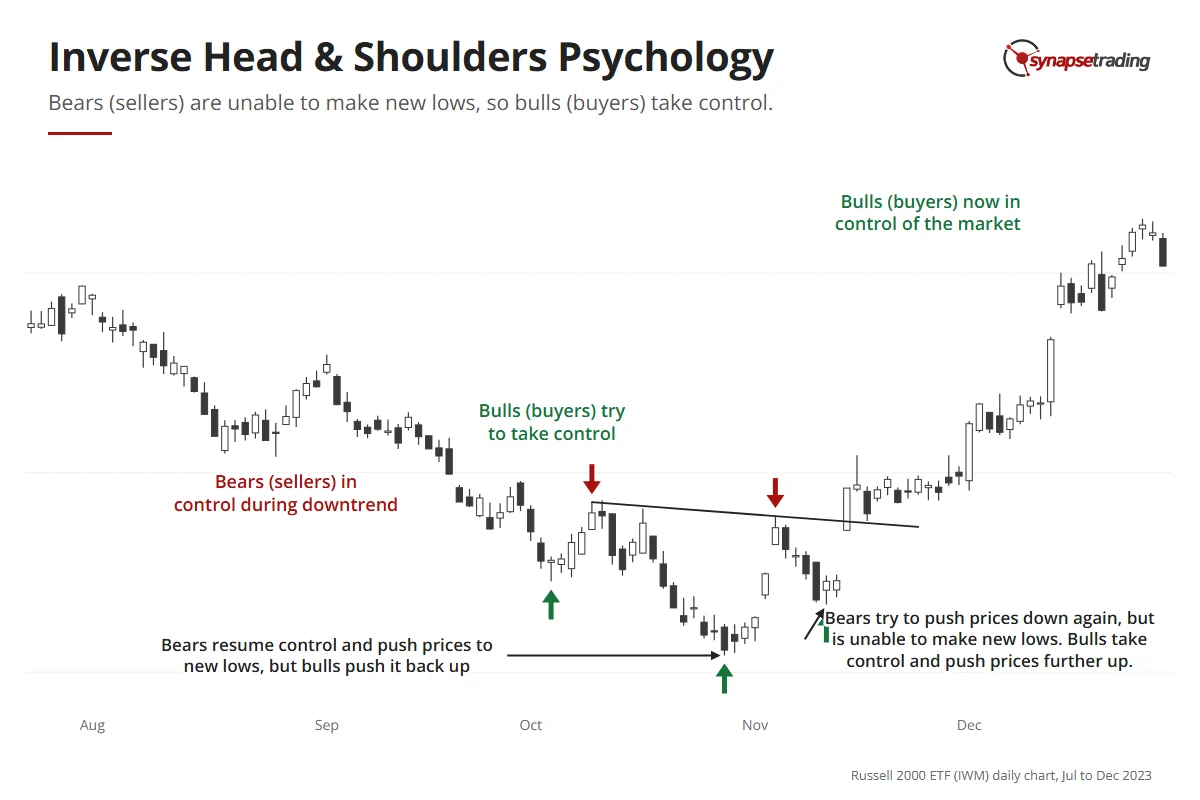
The inverse pattern is the same story with the roles swapped.

Russell 2000 ETF daily chart, 2023: sellers in control in the downtrend, buyers push back, sellers make one more low that fails, a higher low follows, and buyers take control.

Which of the three entries should you use?

The three strategies are three entry points on the same reversal, and the trade-off between them never changes. Enter early and you get a better reward-to-risk ratio but a lower hit rate. Enter late and the hit rate rises while the reward shrinks.

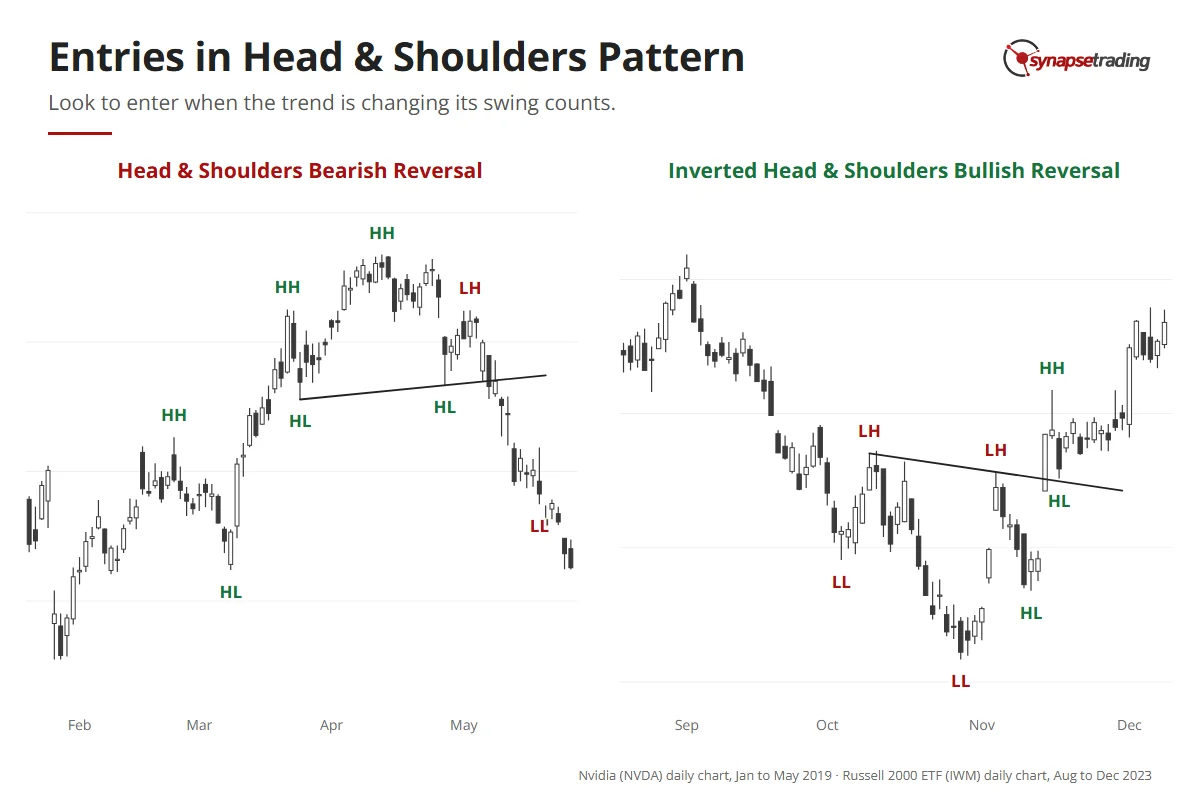
Every trade is that trade-off. This pattern just makes it unusually easy to see, because a bearish reversal turns a run of higher highs and higher lows into lower highs and lower lows, and each entry sits at a different step of that change.

EntryWhere you enterBest whenHit rate vs reward-to-risk
#1 EarlyNear the right shoulder, on the first lower highThe push to resume the trend looks weakLowest hit rate, best reward-to-risk
#2 BreakoutOn the neckline break, the first lower lowThe neckline is clear and the break has volumeMiddle on both
#3 PullbackOn the first pullback after the break, the next lower highThe break was messy, or you want confirmationHighest hit rate, smallest reward-to-risk

Nvidia 2019 and the Russell 2000 ETF 2023 with each swing high and low labelled higher or lower; the swing counts flip as each head and shoulders completes.

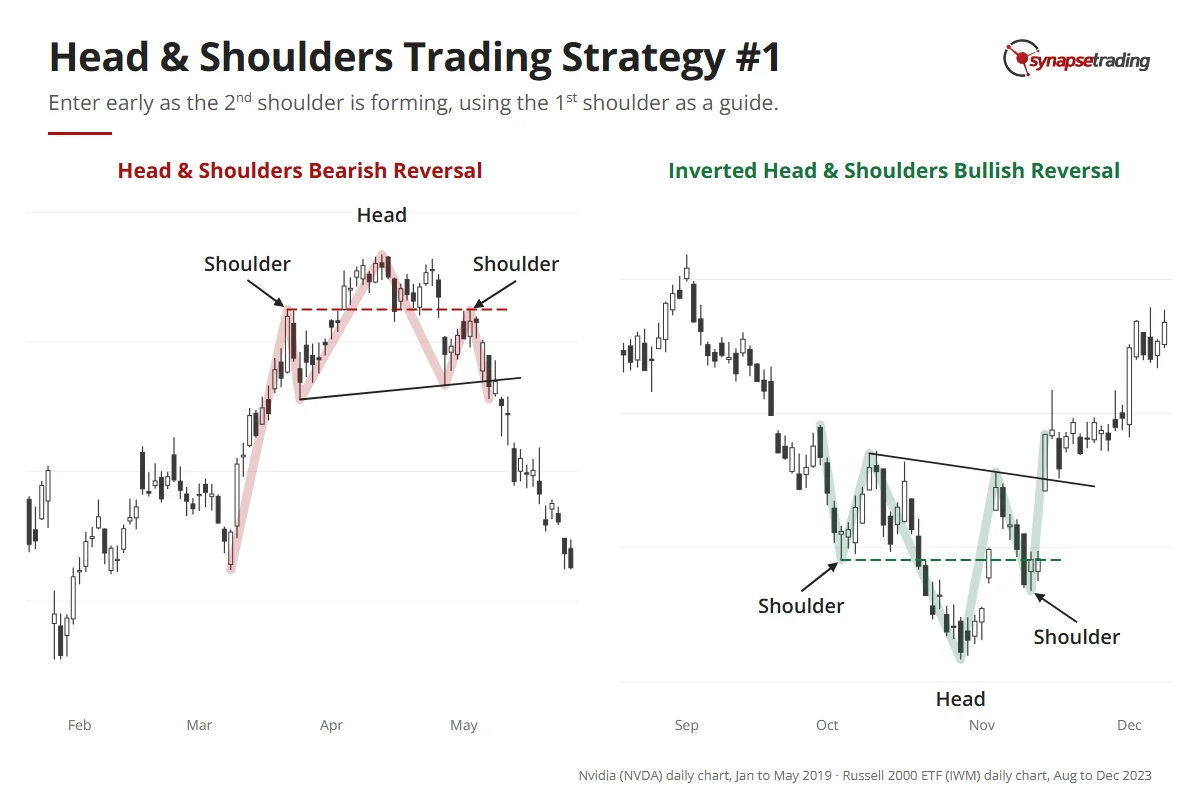
Strategy #1: the early entry

Edwards and Magee estimated that “perhaps 20%” of head and shoulders tops are saved before the neckline ever breaks. Price drifts around the right shoulder for a while, then pushes on to new highs.

That is the risk you take here. The idea is to use the left shoulder as a guide, because most of the time the right shoulder forms at roughly the same level. So you watch price approach that level and look for reversal candles, weak price action and fading volume. Your stop goes between the shoulder and the head. If price climbs back into that zone, your read was wrong and the loss is small.

It works best when the rally trying to resume the trend is visibly weak.

Nvidia 2019 and the Russell 2000 ETF 2023: a dashed line from the first shoulder marks where the second shoulder is likely to form, where an early entry is taken.

Do note that this is the entry I teach and the one my own rules like least. We went back through 734 of my annotated charts from June 2024 to May 2026. The rule that came out for reversal trades was to wait for the neckline to break and retest, and never to pre-empt a neckline that has not broken. Personally, I keep the early entry for the rare chart where the last rally is almost embarrassingly weak.

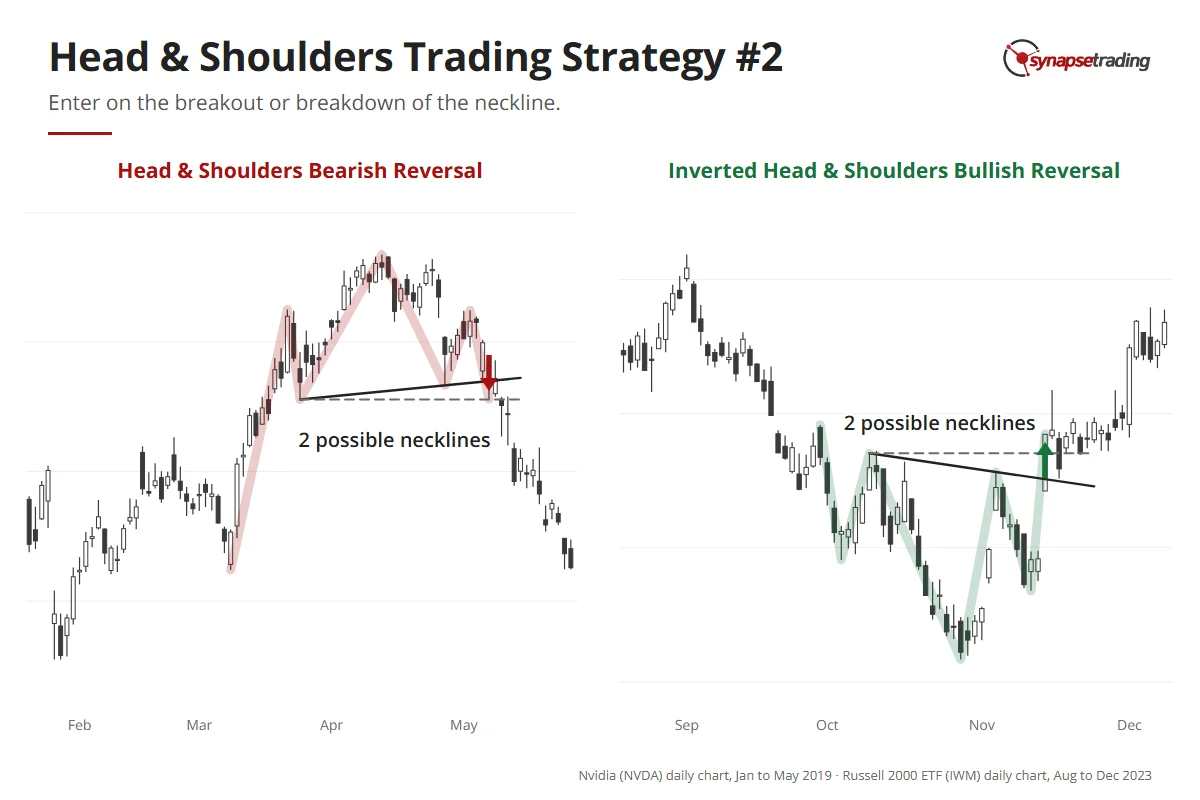
Strategy #2: the breakout entry

What counts as a break? Edwards and Magee wanted a close about 3% beyond the neckline before they believed it, which tells you how many false breaks they must have sat through.

The breakout entry fires on that first lower low, which the break creates automatically. You enter as it happens, looking for strong price action and volume, and your stop goes between the neckline and the right shoulder.

Sometimes there is no single clean neckline. You get a zone, or two or three lines that all look plausible, and when that happens, or when the break is choppy, it is better to wait for the pullback.

Nvidia 2019 breaks down through its neckline and the Russell 2000 ETF 2023 breaks up through its neckline; each chart shows a sloping and a flat way to draw the neckline.

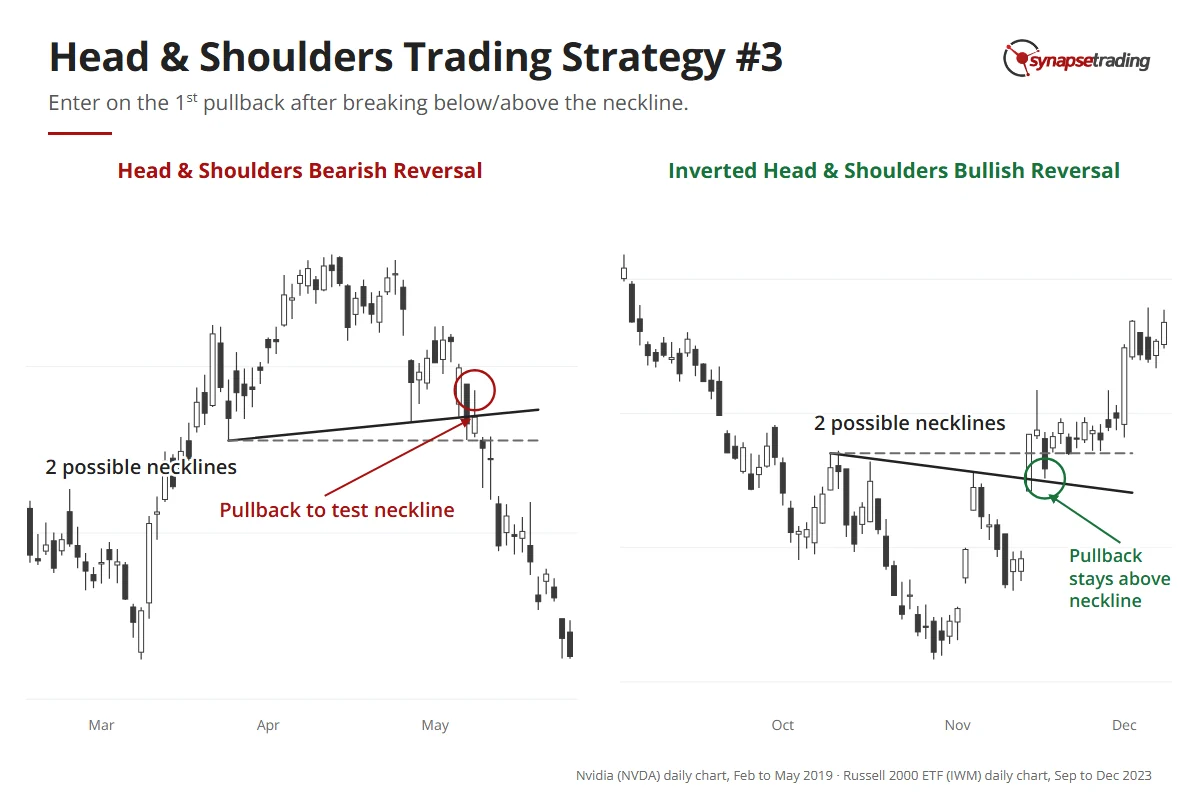
Strategy #3: the pullback entry

Price breaks the neckline, and then, quite often, it comes back to visit. Edwards and Magee found at least one pullback to the neckline in the great majority of cases.

That visit is your third entry. You have already seen a lower high and a lower low, so you enter on the next lower high, with the new trend a little more established and the reward a little smaller. If the breakout had strong momentum, the pullback may stop short of the neckline, so do not insist on a perfect touch. Watch for reversal candles that show price cannot reclaim the neckline, and keep the stop between the neckline and the right shoulder.

Nvidia 2019 and the Russell 2000 ETF 2023: after each neckline break, price comes back to test the neckline once before moving away.

If you went in on the breakout, this is a sensible place to add.

If you would rather have a short daily routine than a screen full of necklines, my free 15-minute swing trader checklist is the one I run myself.

How far can price fall after the break?

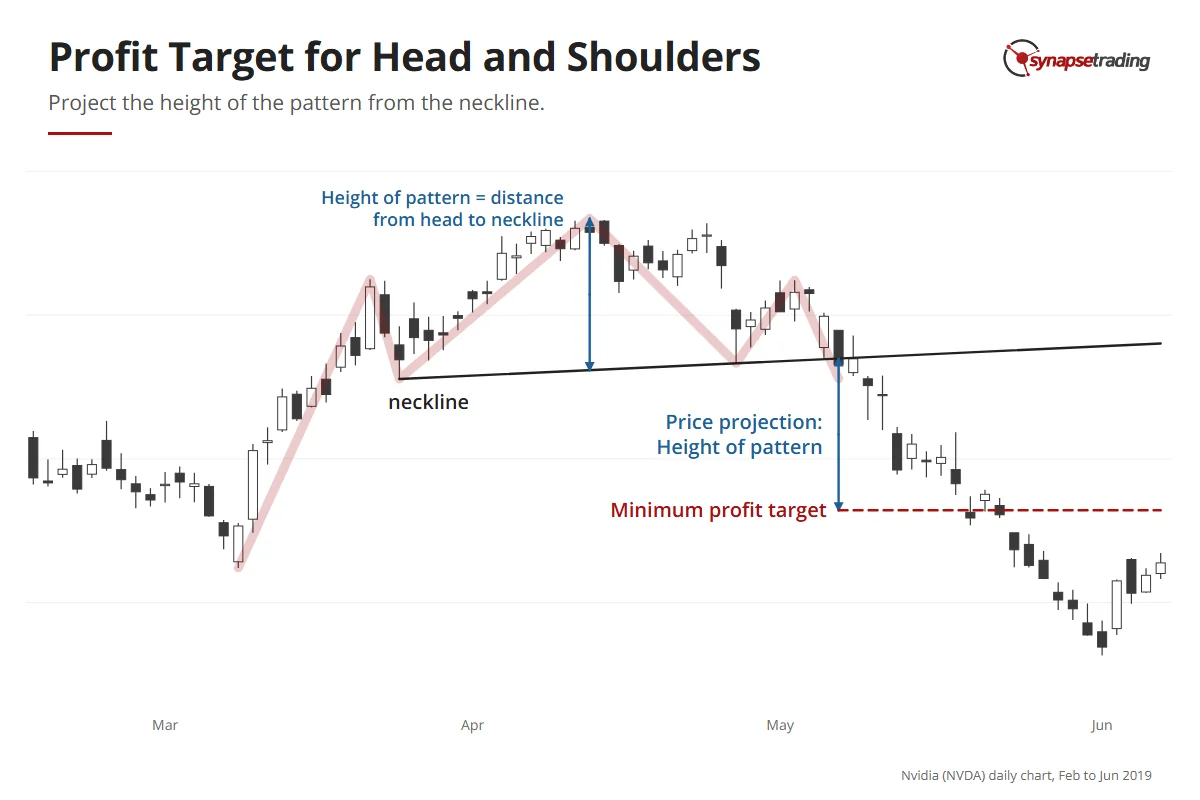
A completed head and shoulders gives you a price target, which is one of the genuinely useful things about it. Measure the height from the top of the head to the neckline, then project that distance down from where price broke the neckline.

That level is a minimum target. If the neckline is unclear, use the most conservative one and take the smaller projection, then compare it with the support and resistance already on the chart. When the two land close together, you have a second reason to believe the number.

Nvidia daily chart, 2019: the distance from the head down to the neckline is projected down from the breakdown point; price reached that minimum target on 20 May 2019.

Is the pattern big enough to turn the trend?

Imagine a stock that has climbed for a year and then prints a tidy little head and shoulders covering a few days. Is that the end of the trend, or a pause?

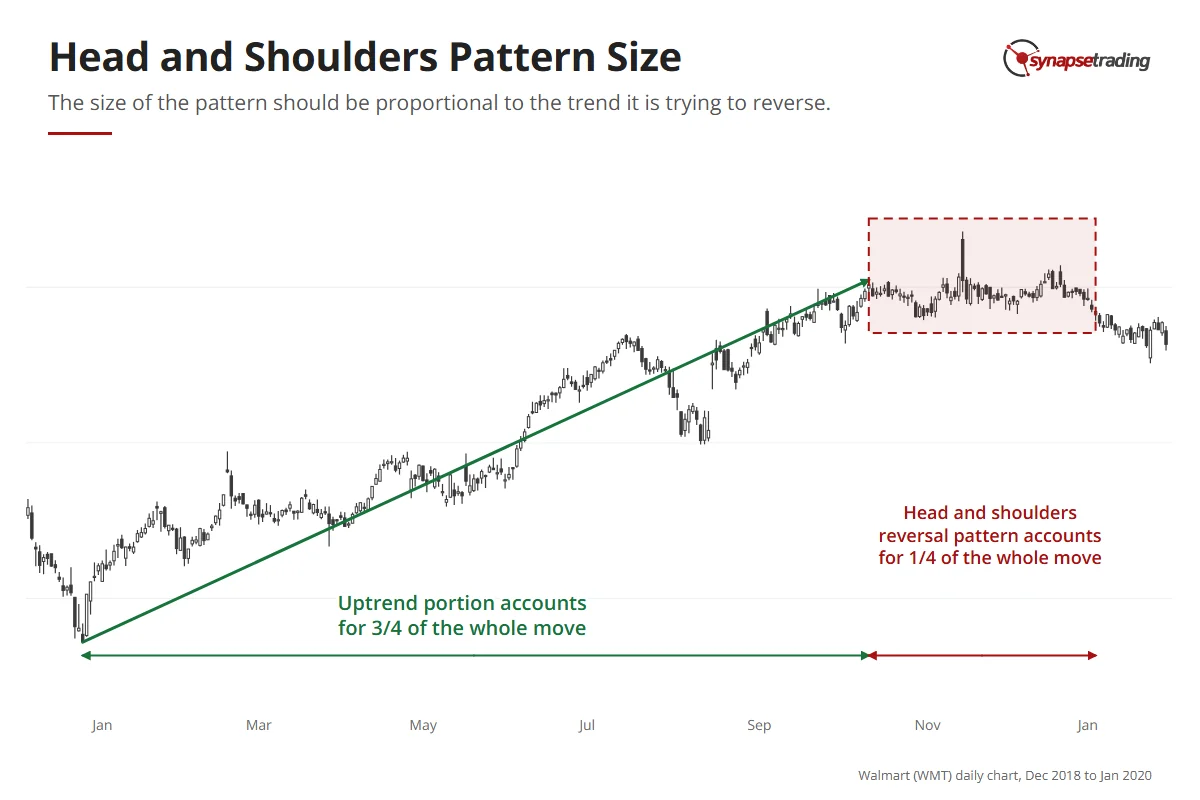
That question is what the proportion rule answers, and it is the one most new traders miss. Measure the whole move vertically. A reversal pattern works best when its height is about 25% to 33% of it, so a trend that makes up 75% of the move and a pattern that makes up the other 25% is the healthy case.

Pattern height vs the whole moveWhat it usually means
Less than 25%Too small to reverse the trend. Expect a pause and a resumption, or a pattern still growing.
25% to 33%Proportional. Big enough to do the job.
More than 33%Too big for a clean head and shoulders. More likely wide swings inside a range.

Walmart daily chart, 2019: a ten-month uptrend followed by a head and shoulders top that takes about a quarter of the whole move before breaking down in January 2020.

I have not seen this rule spelled out in the pattern books I have read. To be fair, the most famous of them leans the other way, because Edwards and Magee noticed how often a small one announced a major move, and wrote that no head and shoulders “should be regarded lightly, ever.”

They are right that a small one deserves attention. But attention and a position are different things. A small pattern inside a strong trend tells me to tighten the stop on the trade I already have, and it takes a pattern of the right size before I open a new one against the trend.

The same logic is why the pattern works best late in a trend. A trend that has run for a long time is tired.

What happened to the “textbook” S&P 500 head and shoulders in November 2025?

On 25 November 2025, a trader on Reddit’s r/technicalanalysis asked about the S&P 500, writing that “this is looking like a textbook H&S.” The right shoulder, as the post itself said, had not formed yet.

Two days later I recorded my weekly outlook. The index had pulled back to its 100-day moving average and bounced, and I said the mini head and shoulders “is kind of failed.” By 4 December it was less than 2% from its all-time high after almost eight white candles in a row, and I said we should be positioned on the long side.

So was it a textbook head and shoulders? It was two-thirds of one.

A head and shoulders with no right shoulder is a guess with a name. It was also a small pattern inside a strong trend, which is exactly the case the proportion rule warns about. The trader was right to ask, and the honest answer at the time was that the chart had not finished talking.

I should also be honest about what my own records can prove. In my own trading book, as at 29 August 2026, ten closed trades matched charts I had tagged as Turn setups, the family of reversal trades a head and shoulders belongs to. Five won and five lost, and the average across all ten, losses included, was +3.55% a trade. Ten trades is far too few to prove anything, and I say that as someone who would quite like it to.

Reading patterns takes practice. Not losing money while you practise takes a routine, and the free 15-minute swing trader checklist is mine.

FAQ

Is a head and shoulders pattern bullish or bearish?
The standard pattern, with three peaks, is bearish and forms at the end of an uptrend. The inverse, with three troughs, is bullish and forms at the end of a downtrend.

What is the neckline in a head and shoulders pattern?
It is the line across the two lows between the three peaks, or the two highs between the troughs on the inverse. A close beyond it confirms the pattern.

What is the best entry for a head and shoulders pattern?
The early entry has the best reward-to-risk and the lowest hit rate. The breakout is the standard play. The pullback has the highest hit rate and the smallest reward.

How do I set a profit target on a head and shoulders?
Measure from the top of the head to the neckline, then project that distance from the breakout point. Treat it as a minimum.

How do I know if a head and shoulders is big enough to trust?
Compare its height with the whole move it is reversing. About 25% to 33% is healthy. Smaller patterns tend to be pauses, and bigger ones tend to be ranges.

Do head and shoulders patterns fail?
Yes, often before the neckline breaks. Edwards and Magee estimated that perhaps 20% of developing tops are saved before the break.


Which of the three entries suits the way you trade, and have you ever been caught by a head and shoulders that never finished? Let me know in the comments.

If you want every price pattern in one place, read The Definitive Guide to Trading Price Chart Patterns. I compare the reversal shapes in continuation and reversal patterns, and the rest is in my free trading guides.

thumbnail the definitive guide to trading price chart patterns

If you would like to learn all the different price chart patterns, also check out: “The Definitive Guide to Trading Price Chart Patterns”

And if you want a routine that takes 15 minutes a day rather than an evening of drawing necklines, grab the free 15-minute swing trader checklist.


About the author. Spencer Li is The 15-Minute Trader and the founder of Synapse Trading. He is a Certified Financial Technician (CFTe) with 15+ years of trading, run from 70+ countries. He holds a B.Acc and B.BM from SMU. Every trade he takes is public, dated, losses left in. He teaches low-risk swing trading in 15 minutes a day, one system for any market.

Education, not financial advice. Synapse Trading is not licensed by MAS to advise on investment products. Trading carries risk of loss, and past performance is not indicative of future results.
1 Comment/by Spencer Li
https://synapsetrading.com/wp-content/uploads/2026/10/head-and-shoulders-card.webp 630 1200 Spencer Li https://synapsetrading.com/wp-content/uploads/2026/10/synapse-logo-horizontal-light.png Spencer Li2021-01-06 00:54:142026-08-11 09:21:51Head and Shoulders Pattern: 3 Ways to Trade the Reversal, and How to Tell a Real One
Spencer Li

Cup and Handle Pattern: How to Trade It and Avoid the False Breakouts

Technical Analysis & Price Action
Trading the cup and handle - chart patterns

By Spencer Li, CFTe · Last updated: 13 October 2026

The cup and handle is a bullish chart pattern built from two bases. First comes a wide, rounded U called the cup, where price slowly climbs back to an old high, and then a small, shallow dip called the handle forms just under that high before price finally breaks out above it.

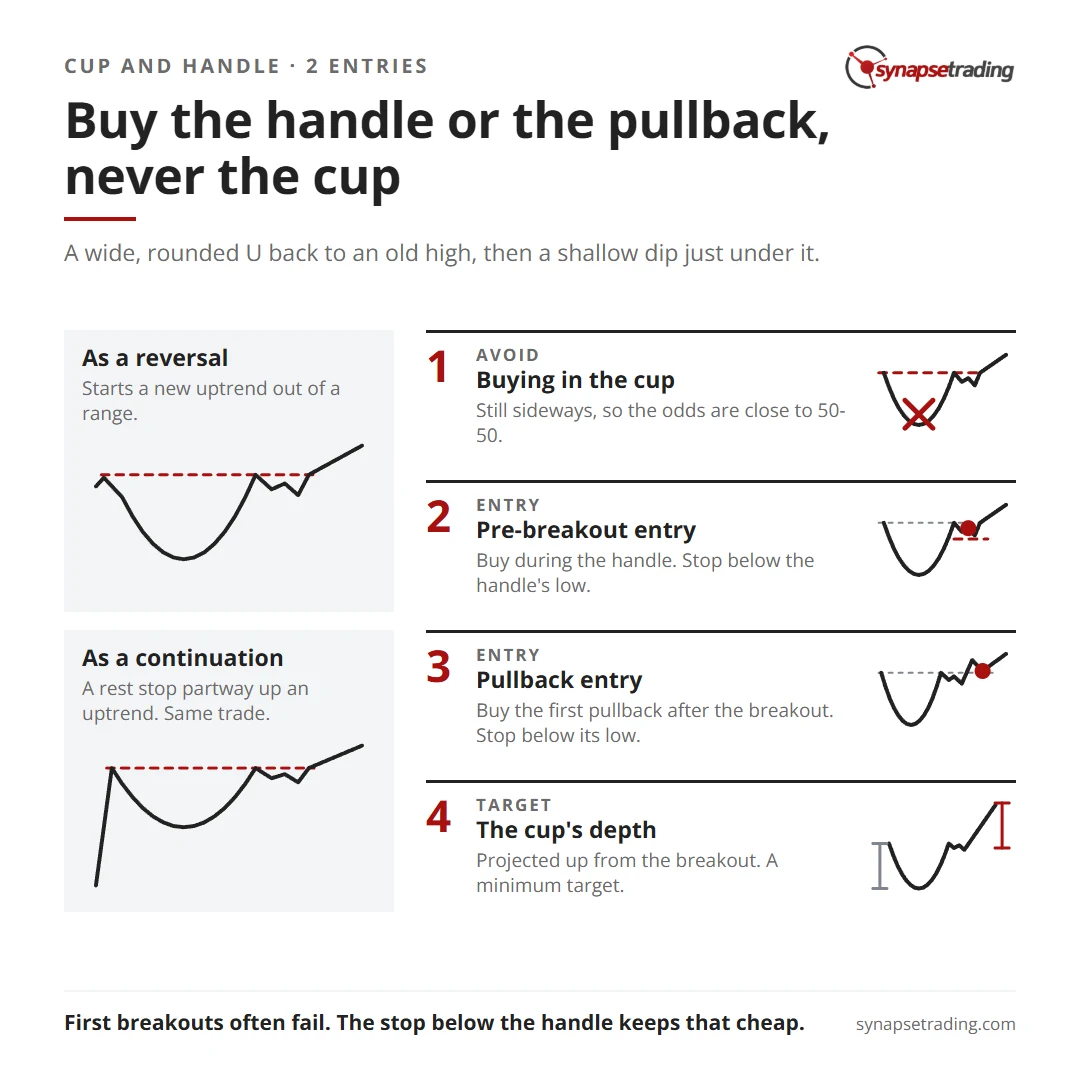
There are two good places to buy it. You can enter during the handle, just before the breakout, with a stop below the handle’s low, or you can buy the first pullback after the breakout. Your minimum target is the depth of the cup, projected up from the breakout. The one place I would avoid is the cup itself, where the price looks cheapest and the odds are close to a coin toss.

Cup and handle cheat sheet: buy the handle or the first pullback, never the cup. Two entries, their stops and the minimum target.

What is a cup and handle pattern?

William O’Neil, the investor who made this pattern famous, charted 100 of the biggest winning US stocks from the 1880s to 2008 and counted 105 cup-with-handle examples among them. That is more cups than stocks.

The cup and handle is an accumulation pattern, which means buyers are quietly building positions through a long stretch of sideways trading. You usually notice it only once the cup is well underway. O’Neil’s test is that the bottom should round into a U rather than a narrow V.

The handle confirms it. It is a short dip just under resistance, the level where sellers have turned the market back before, and I think of it as pushing down on a loaded spring to build a little more pressure right before the release.

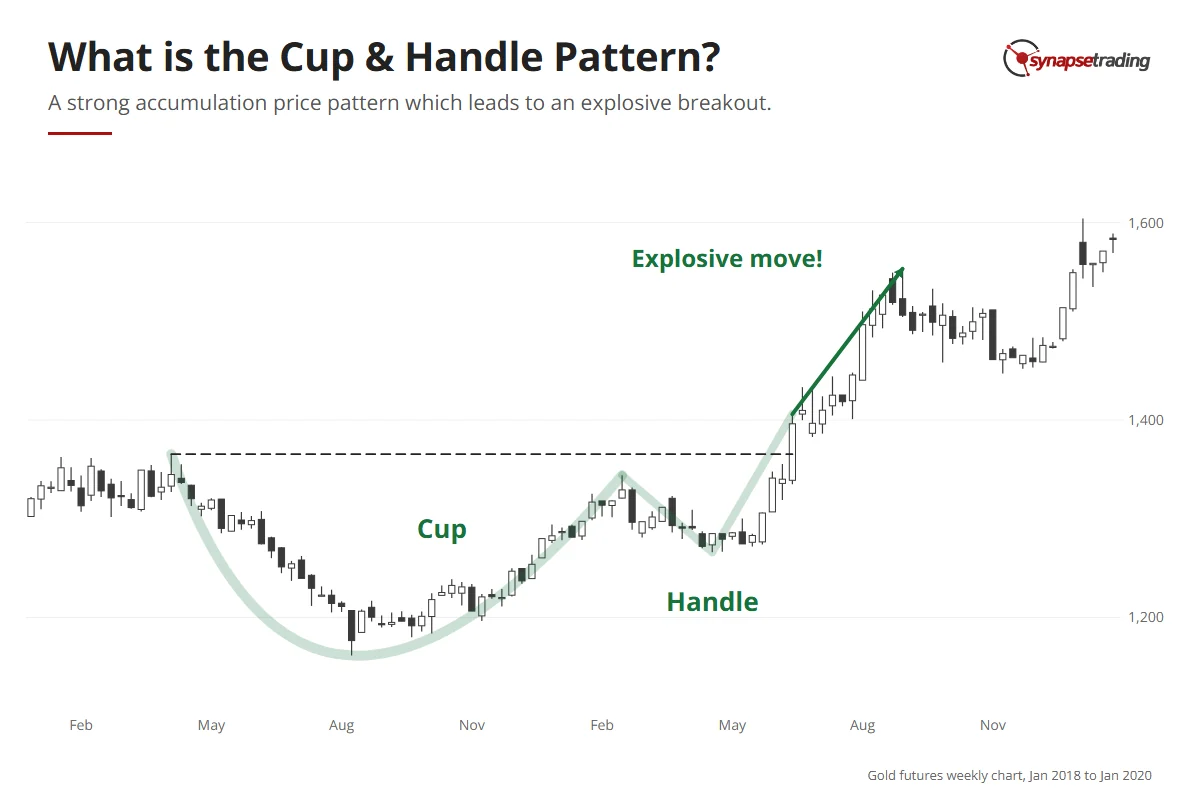
Gold futures weekly chart, 2018 to early 2020: a rounded cup from April 2018 to February 2019, a short handle, then a strong rally after the June 2019 breakout.

Is the cup and handle a reversal or a continuation pattern?

In my weekly outlook on 18 December 2025, I pulled up IWM, the fund that tracks the Russell 2000 index of smaller US companies. While the bigger indices climbed, IWM had spent years carving out a big curve, because small companies suffer more from high interest rates, and only once rates started coming down did they start to move. I said on the video that it looked like “a big sort of cup and handle”, and admitted it was “not a very nice one, but the idea is there”.

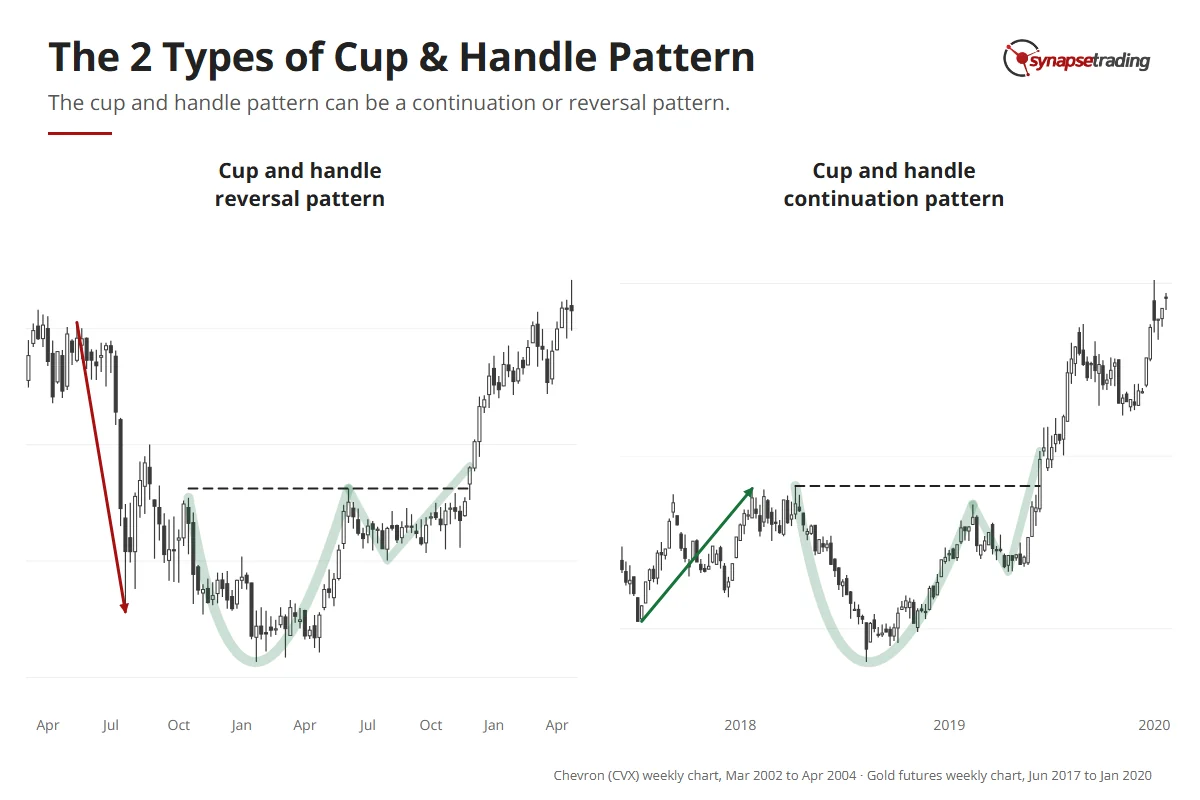
IWM came into that pattern going sideways, with no real trend either way, and that is why I file the cup and handle under reversal patterns. It usually kicks off a new uptrend out of a ranging market, as I describe in my guide to continuation and reversal patterns.

Plenty of traders call it a continuation pattern, and they have a point. O’Neil himself wants a prior uptrend of at least 30% before the cup forms, so in his version the cup is a rest stop partway up an advance that is already running. The shape is the same either way, and so is the trade. It is bullish in both cases, so the whole job is finding a low-risk place to buy.

Two real cups: Chevron weekly 2002–2003 forms a cup and handle after a downtrend (reversal); gold futures weekly 2018–2019 forms one after an uptrend (continuation).

What is happening inside the cup and the handle?

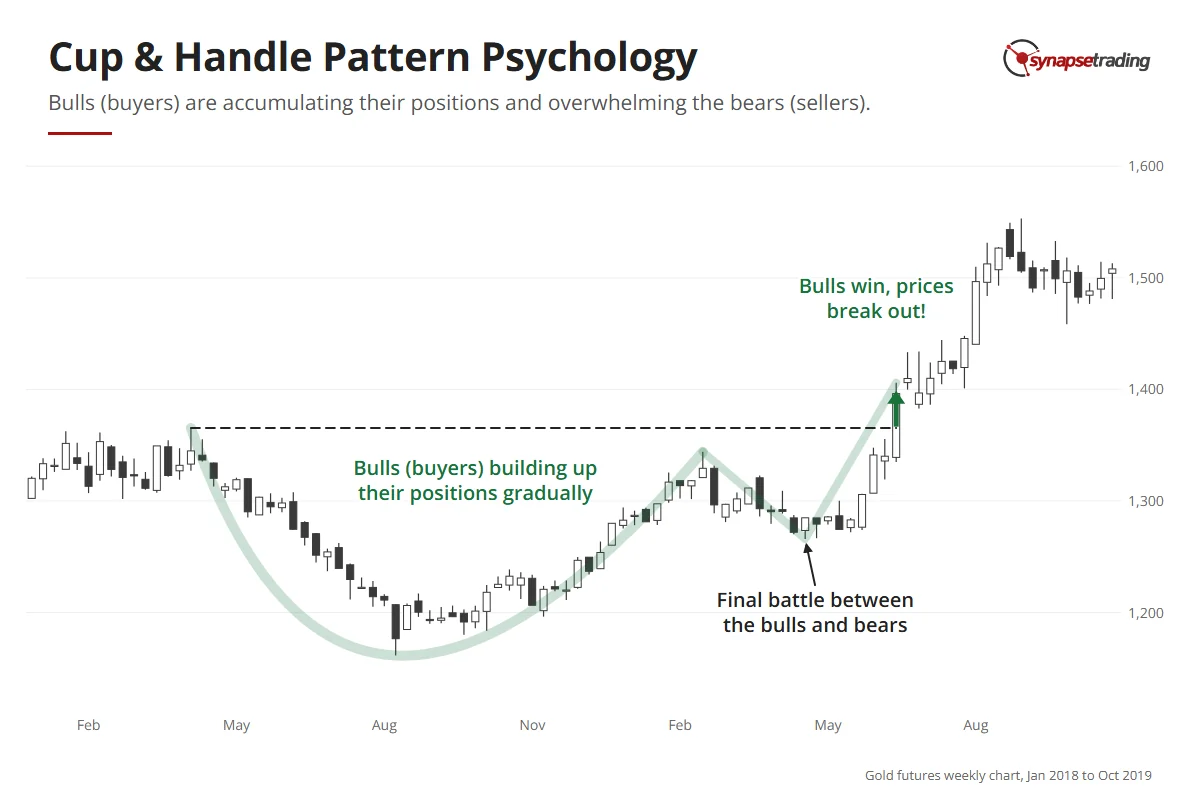
Why does the pattern look like this at all? Because it is a slow change of control.

As the earlier move fades, sellers thin out and buyers start picking up shares a little at a time. The two sides are almost balanced while this goes on, and that balance draws the wide, flat bottom of the cup. Sellers are no longer in charge. Buyers have not quite taken over.

The handle is the final fight. By then buyers have the upper hand, and every dip that holds attracts a few more of them. O’Neil says a healthy handle drifts slightly lower and ends with a shakeout, where price slips under an earlier low and scares out the last nervous holders, and he notes that volume often dries up near the handle’s lows. Once those last sellers give up, buyers take full control, and the breakout happens.

Gold futures weekly chart, 2018–2019: buyers build positions through the rounded cup, a final tussle forms the handle, then buyers win and price breaks out.

Watching a handle form takes minutes a day, and my free 15-minute swing trader checklist is the daily routine I run myself.

Why should you avoid buying during the cup?

Imagine you have found a stock halfway through its cup. The price is far below the old high, the curve is turning up, and buying now feels like the bargain of the year.

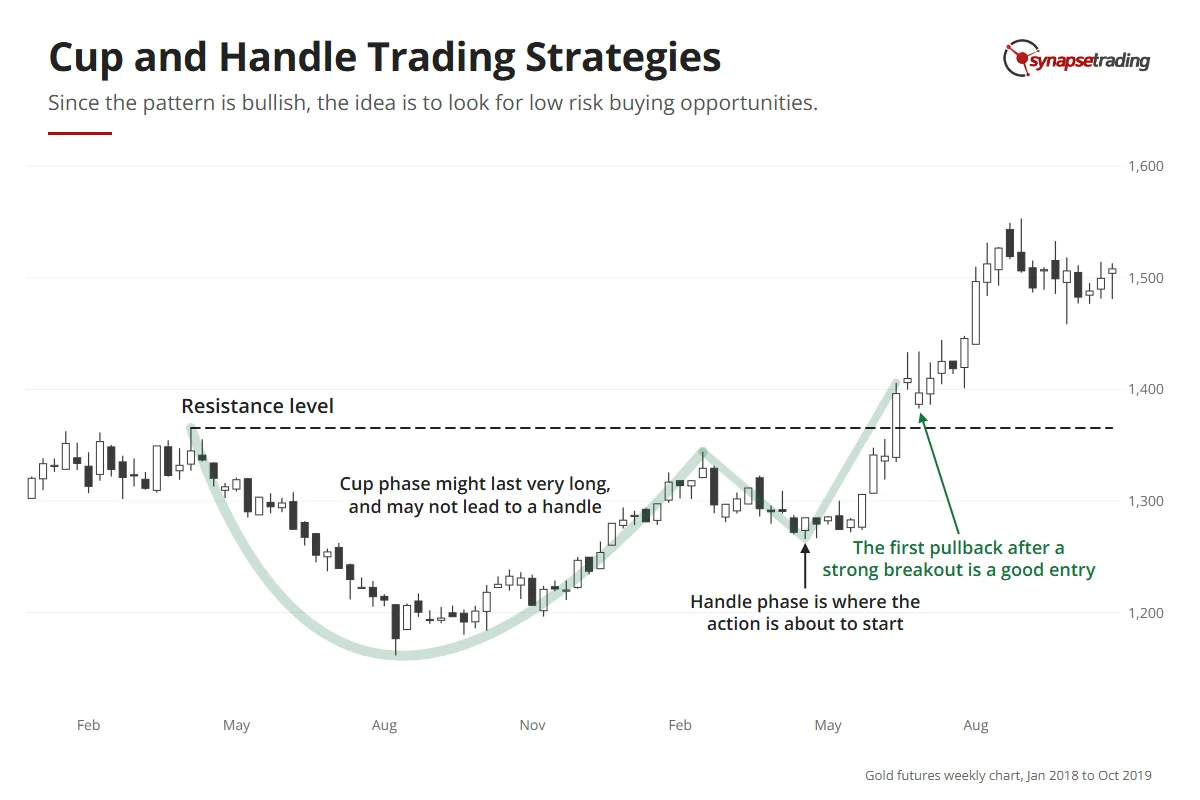
I would still skip it. Why? During the cup the market is still sideways, so the odds are close to 50-50 and there is no real edge yet. The cup can also outlast your patience. O’Neil’s cups took 7 to 65 weeks, most of them three to six months, while the IWM cup on my chart took three years, from its high in November 2021 to the retest in November 2024. Some cups never grow a handle at all.

Hence, it makes more sense to keep your capital free and only commit when the action is about to start. You give up a little on price, and in return your money is never stuck for months in a pattern that might not finish.

How do you trade the cup and handle?

Both strategies aim at the final fight just before the breakout, where the large moves tend to start. The only difference is whether you take your seat just before it or just after.

What you doBest whenStop
1. Pre-breakout entryBuy during the handle, close to resistanceYou can watch the handle formBelow the handle’s low
2. Pullback entryBuy the first pullback after the breakoutYou missed the handle, or the breakout was too fastBelow the low of the pullback

Gold futures weekly chart, 2018–2019: the cup, the handle and the first pullback after the breakout are each marked with what a trader does there.

Strategy 1: the pre-breakout entry

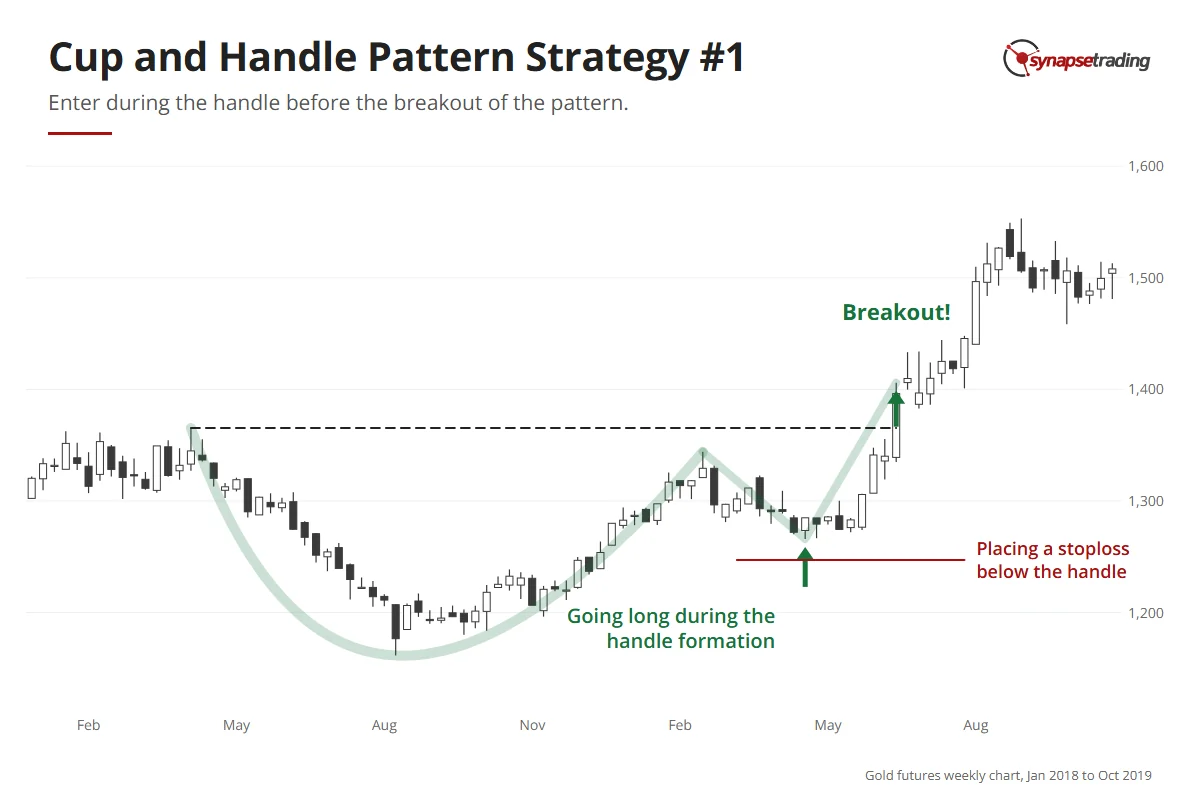
Through the cup, buyers have been building pressure. As the handle forms, the breakout is close. Once it fires, price and volume tend to surge, and a clean entry gets much harder to find.

So you enter during the handle and put your stop below the handle’s low. The handle is usually small next to the cup, so the distance to your stop stays small too. O’Neil puts numbers on this. In a bull market a sound handle stays within 8% to 12% of its peak, sits in the upper half of the base and takes more than a week or two to form. A handle that creeps upward along its lows is what he calls a wedging handle, and he counts it among the patterns most likely to fail.

Gold futures weekly chart, 2018–2019: a long entry is marked during the handle, with a stoploss below the handle low, before the June 2019 breakout.

Strategy 2: the pullback entry

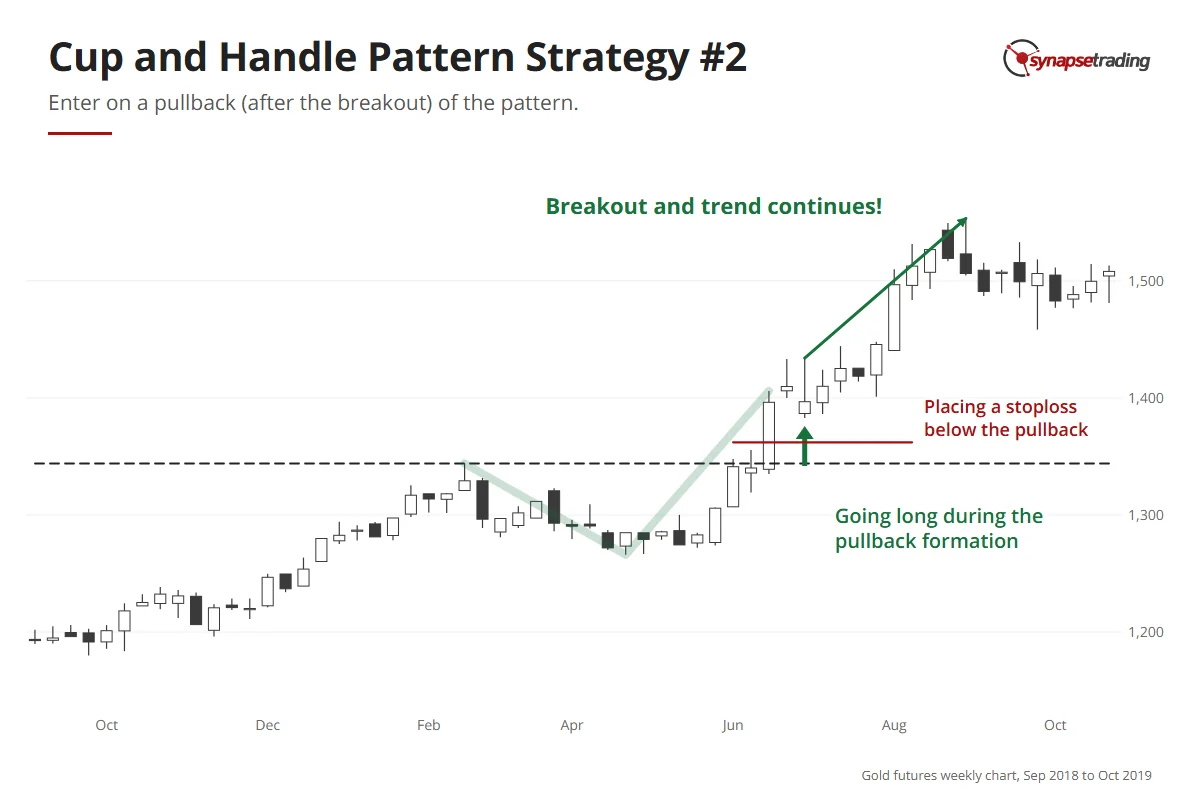
Sometimes the breakout is too fast, or you simply missed it. After such a long build-up, the move usually has more than one leg, so the first pullback after the breakout is a good second chance, and your stop goes at the bottom of that pullback. The pause often looks like a bull flag, a short downward drift after a sharp move.

A second chance works for people who are already in, too. On 9 October 2025, I showed CIBR, a cybersecurity fund, in my weekly outlook. I had held it since 29 September, and it had just pushed out of what I called “kind of like a cup and handle breakout”. So I told viewers who had missed it that this was “a second chance to buy it”, and said I had just added to my own position. If you entered during the handle, this is where you add.

The second chance does not always come, though. On 17 December 2025, I showed UBS, which I said was “not really a cup and handle because there’s no handle”. I had been hoping for a pullback to enter, and then it gapped up about 5% in one session, which I admitted I had not expected. O’Neil notes that cups without a handle fail somewhat more often, although many still work. A breakout that never pauses gives the pullback trader nothing to buy, so you let it go.

Gold futures weekly chart, 2019: after the June breakout price pulls back; a long entry is marked on the pullback, with a stoploss below the pullback low.

Why do some cup and handle breakouts fail?

On 16 November 2025, a trader on Reddit’s r/technicalanalysis asked: “Why would cup and handle confirm but then seemingly fail?” They had bought what looked like a confirmed breakout, and a few weeks later price was back at the bottom of the handle.

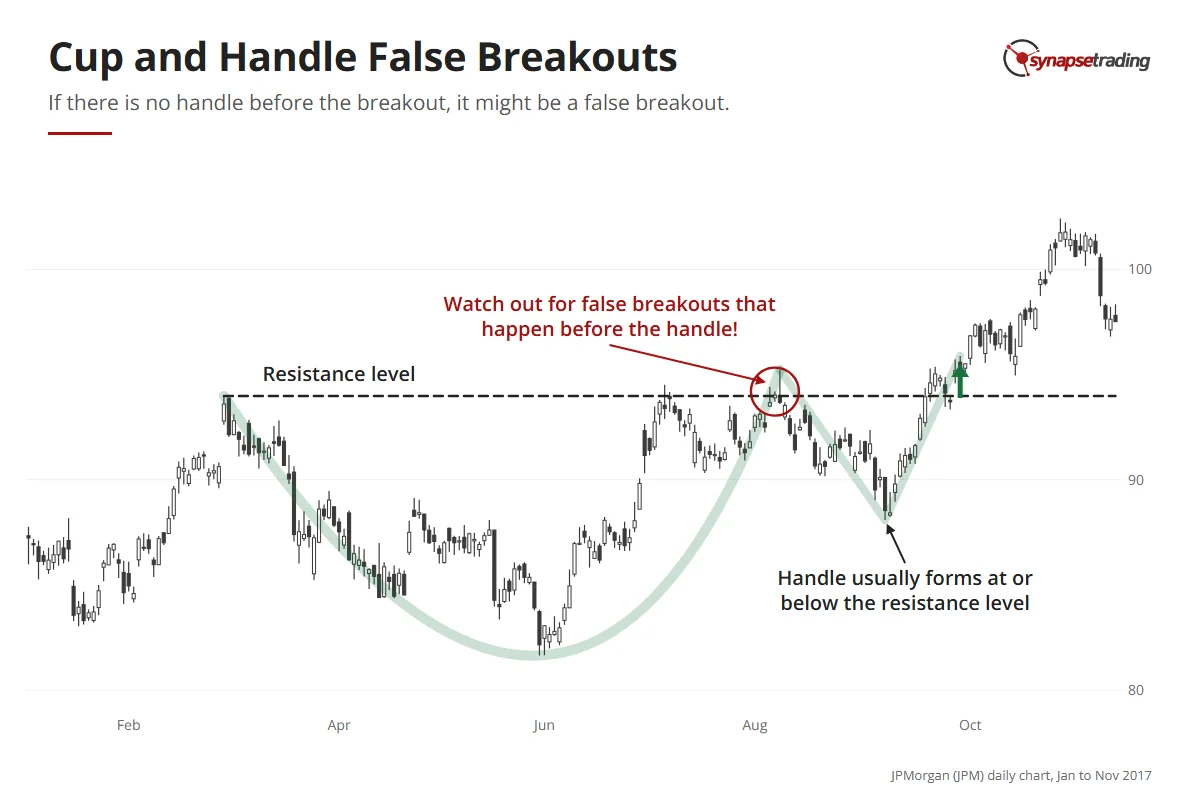
Every pattern trader asks this eventually, usually with some regret. Part of the answer is that first attempts often fail, because the whole pattern is one long attempt to clear the same resistance line, and the early pokes above it are mostly probes for weakness.

JPMorgan daily chart, 2017: a cup pokes above its March resistance in August, falls back to form a handle below it, then breaks out for real in late September.

IWM showed this on a big scale. In November 2024 it pushed a fraction above its November 2021 high, and anyone who bought that breakout then watched it fall about 30% by April 2025. That drop became the handle, and a deep one, far past the 8% to 12% that O’Neil likes to see, so price did not close clear of both old highs until early October 2025, nearly four years after the original high.

Do note that some pullback is normal. O’Neil estimates that winning stocks dip back to their buy point 40% to 60% of the time. A drop to the bottom of the handle is different. That is the floor the pattern was built on, and the stop sits there so one bad breakout cannot wipe out the gains from several good ones.

So if that trader’s stop sat below the handle, the pattern still did its job. It told them they were wrong, for a cost they knew in advance. Personally, I would rather take that small loss quickly than hold on and hope. Hope is how a small loss grows into one that blows up an account.

Hence, I like this setup most when price has already been turned back at the same level once or twice, because each failed attempt uses up a few more of the sellers waiting there.

If you want a routine that keeps you waiting for the handle, the free 15-minute swing trader checklist is the one I use.

How do you set a profit target for a cup and handle?

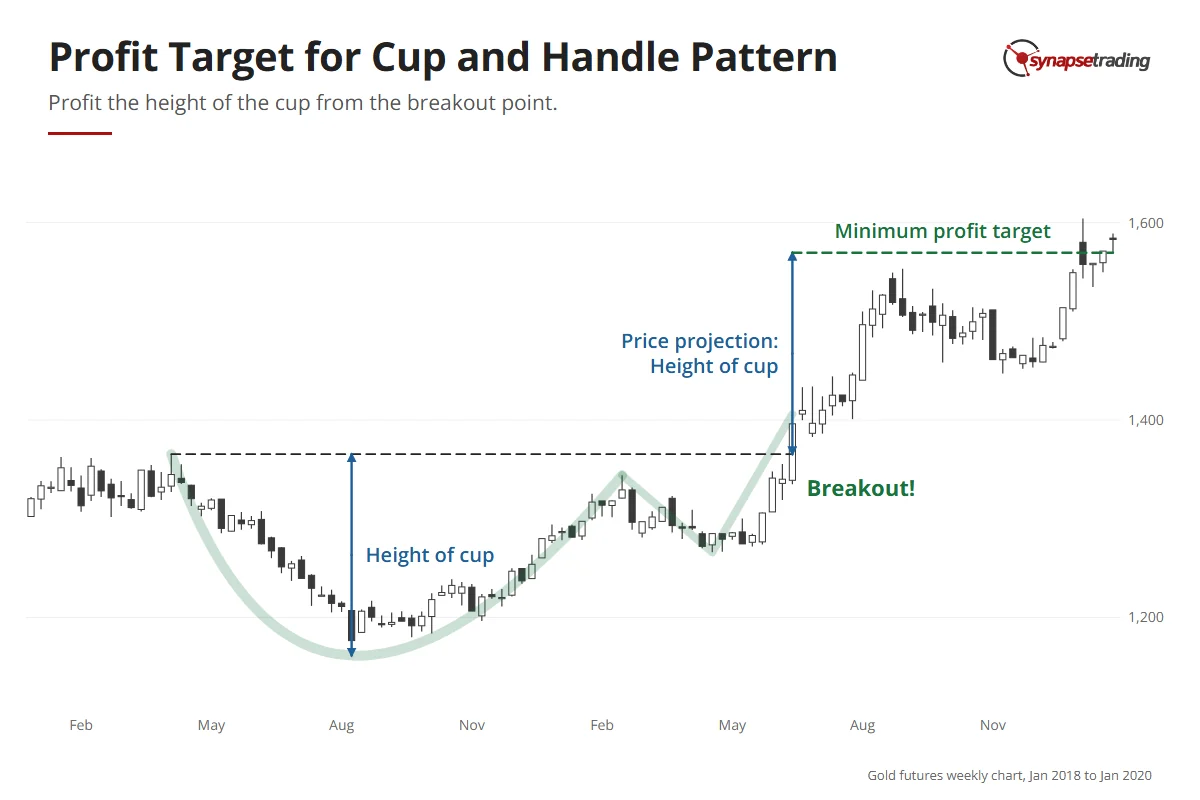
A finished cup and handle hands you its own target. Take the depth of the cup, from the rim down to the lowest point, and project the same distance up from the breakout.

On IWM’s monthly chart, the fall from the November 2021 high to the October 2023 low was about 34%.

So the minimum target sits roughly 34% above the old high.

Gold futures weekly chart, 2018 to 2020: the depth of the cup is projected up from the June 2019 breakout; price reached that minimum target in January 2020.

At its August 2026 high, IWM was about 25% above that old high, roughly three quarters of the way there. By 16 October 2026 it had slipped back to about 11% above it. The target is where you plan your first exit. Price can stop short of it, and so far it has.

For extra confirmation, look for confluence, where the target lines up with an old support or resistance level. Then you have two reasons to expect a reaction there instead of one.

FAQ

Is the cup and handle a bullish or bearish pattern?
It is bullish, which is why “cup and handle” means the bullish version by default.

Is the cup and handle a continuation or a reversal pattern?
It can be either. I class it as a reversal because it usually starts a new uptrend out of a ranging market, but many traders call it a continuation when it forms partway up an uptrend. You trade both the same way.

Where is the best place to enter a cup and handle?
During the handle, just before the breakout, where a stop below the handle keeps the risk small. The first pullback after the breakout is the next best entry.

Where do I put my stop on a cup and handle?
For a pre-breakout entry, just below the handle’s low. For a pullback entry, just below the low of the pullback.

How do I set a profit target for a cup and handle?
Measure the depth of the cup and project that distance up from the breakout. Treat it as a minimum target, and look for an old support or resistance level near it.


Which entry suits you, the seat in the handle or the second chance? And has a cup ever broken out on you, only to sink straight back into the handle? Let me know in the comments.

For every pattern in detail, read my Guide to Trading Price Chart Patterns, or the pages on the triangle, rectangle and expanding triangle. The rest of my free trading guides are in one place.

thumbnail the definitive guide to trading price chart patterns

If you would like to learn all the different price chart patterns, also check out: “The Definitive Guide to Trading Price Chart Patterns”

And if you want a daily routine that does not need hours at the screen, grab the free 15-minute swing trader checklist.


About the author. Spencer Li is The 15-Minute Trader and the founder of Synapse Trading. He is a Certified Financial Technician (CFTe) with 15+ years of trading, run from 70+ countries. He holds a B.Acc and B.BM from SMU. Every trade he takes is public, dated, losses left in. He teaches low-risk swing trading in 15 minutes a day, one system for any market.

Education, not financial advice. Synapse Trading is not licensed by MAS to advise on investment products. Trading carries risk of loss, and past performance is not indicative of future results.
by Spencer Li
https://synapsetrading.com/wp-content/uploads/2026/10/cup-and-handle-card.webp 630 1200 Spencer Li https://synapsetrading.com/wp-content/uploads/2026/10/synapse-logo-horizontal-light.png Spencer Li2021-01-06 00:52:512026-10-13 18:12:29Cup and Handle Pattern: How to Trade It and Avoid the False Breakouts
Spencer Li

Top 3 Reasons Why Price Action is Chosen by Professional Traders

Technical Analysis & Price Action
Why pros trade price action - price action

This article is going to be a little longer than usual, as I endeavor to make a balanced view about exactly why price action is preferred in the marketplace.

If you’re keen to expand your mind, deepen your knowledge, or simply learn something new about the financial markets, then please read on.

Throughout the centuries, traders around the world have tried to find every method possible to exploit the market for profits. The search for a trading edge has led to countless hours of research, hard work, and dedication. More recently, programming has become the rage as hedge funds, institutions, and large traders seek to find the optimal way to extract profits from the market.

While the internet is rife with methods, formulas, and patterns that claim to bring in profits, through my years of trading, I’ve found that trading plan or strategies fall into these 3 simple categories.

Most Trading Strategies Fall into 3 Categories


1. Trend-following

Many beginners make the mistake of asking these 2 questions: “When should I buy? When should I sell?”

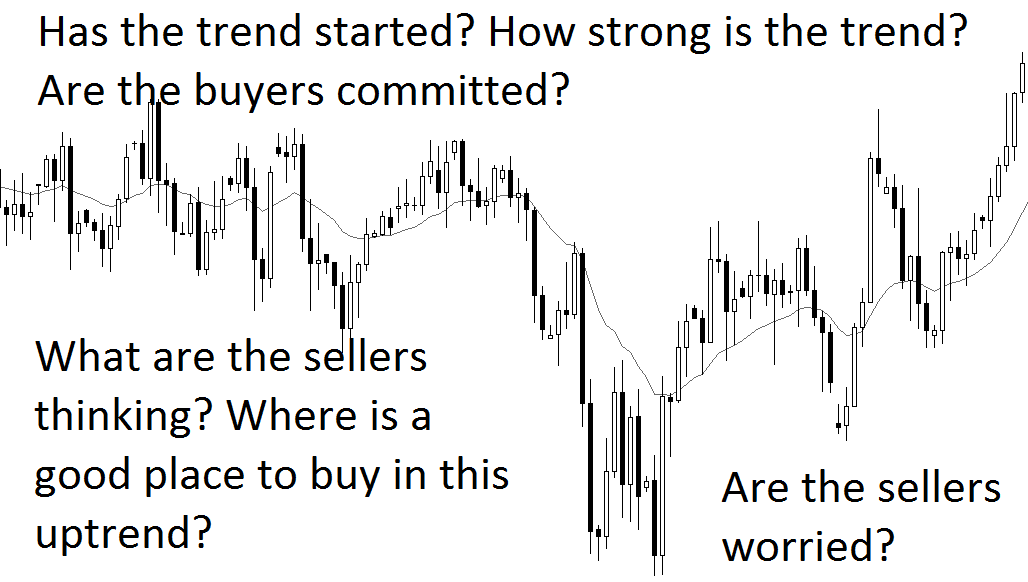
Beneath these two questions, are actually several important questions to ask before deciding when to buy and sell. You see, trend-following is the act of buying in an uptrend, and selling in a downtrend. It sounds simple, but several questions come to mind when a trader attempts to follow a trend:

  • Has the trend started? When did it start?
  • When will the trend end?
  • Where should I get in on the trend?
  • Is it a volatile trend, or a gentle trend?
  • Is it a strong trend, or a weak trend?

All of this has to be taken into account as the market unfolds before a trader’s eyes. The confluence of answers to these questions would allow a price action trader to buy or to sell. While it is impossible to predict what would happen, the better a trader can answer the above questions, the better he or she is positioned to make some money.

Why is price action preferred by professional traders?

Price action involves reading clean price charts, and understanding the motivation of buyers and sellers when taking trades. With proper training, a trader can answer all the above questions, and make the most efficient trade during a trending market situation.

Top 3 Reasons Why Price Action is Chosen by Professional Traders

Traders have to process large quantities of information at a go. Making the price chart as clean as possible allows the trader to clearly see what is happening, and simplifies his analysis. For example, in the above chart, buyers are committed during the most recent 10 bars, and a reasonable trade would be to buy on a pullback to the EMA or trendline.


2. Mean-reversion

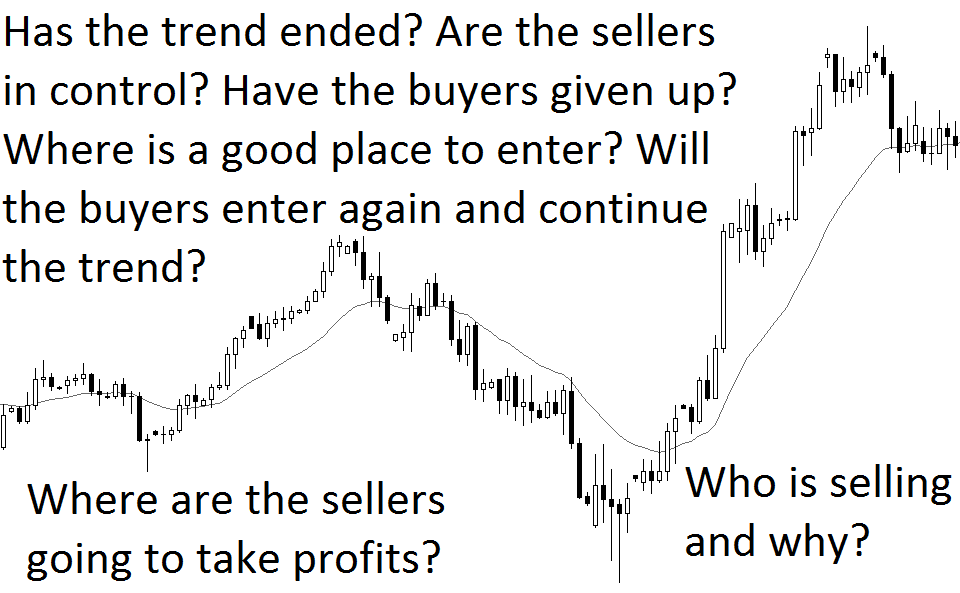
Mean-reversion is simply doing the opposite of a trend-follower. In essence, a mean-reversion trader would be asking the following questions:

  • Has the trend ended?
  • Where might the trend end?
  • Are the traders taking profits, or are they initiating new positions?
  • What price levels are mean-reversion traders looking at?

Based on my experience, beginners should not look to be mean-reversion traders until they are profitable trend-followers. It is much harder than it looks when taking a trade in the opposite direction of the trend.

In my trading foundation workshops, I emphasize time and again that a trade setup must occur in the opposite direction before taking a reversal trade. In fact, instead of going against the trend, I would much prefer that the trend has already changed direction, and then I hop on to that new trend for a lower-risk trade.

Price action traders consider many more options and ask more questions than indicator-based or value-based traders.

The financial marketplace is filled with professional traders seeking to make a quick buck out of unsuspecting, ill-disciplined, or even lazy traders. It is just like in the Olympics; at the highest level of sporting excellence, sportsmen that miscalculate their aim or fail to squeeze out that last ounce of energy could miss finishing in the top 3.

Top 3 Reasons Why Price Action is Chosen by Professional Traders 2

In a bull market, going against the trend is much harder than you think. That is why price action is so important; it helps you decipher when the trend is going to end, and whether it is wise to enter or not.


3. Spread-Betting (Betting during volatility)

Spread-betting is used by institutional traders and proprietary funds to make short-term bets during times of volatility. The software and execution technology required is often expensive, and is not suitable for a retail trader. The strategy is complex, because bets are placed on both sides during a volatile event, and it requires strict discipline when trading. I won’t go into great detail on how this is done, but you can read up about it.

 
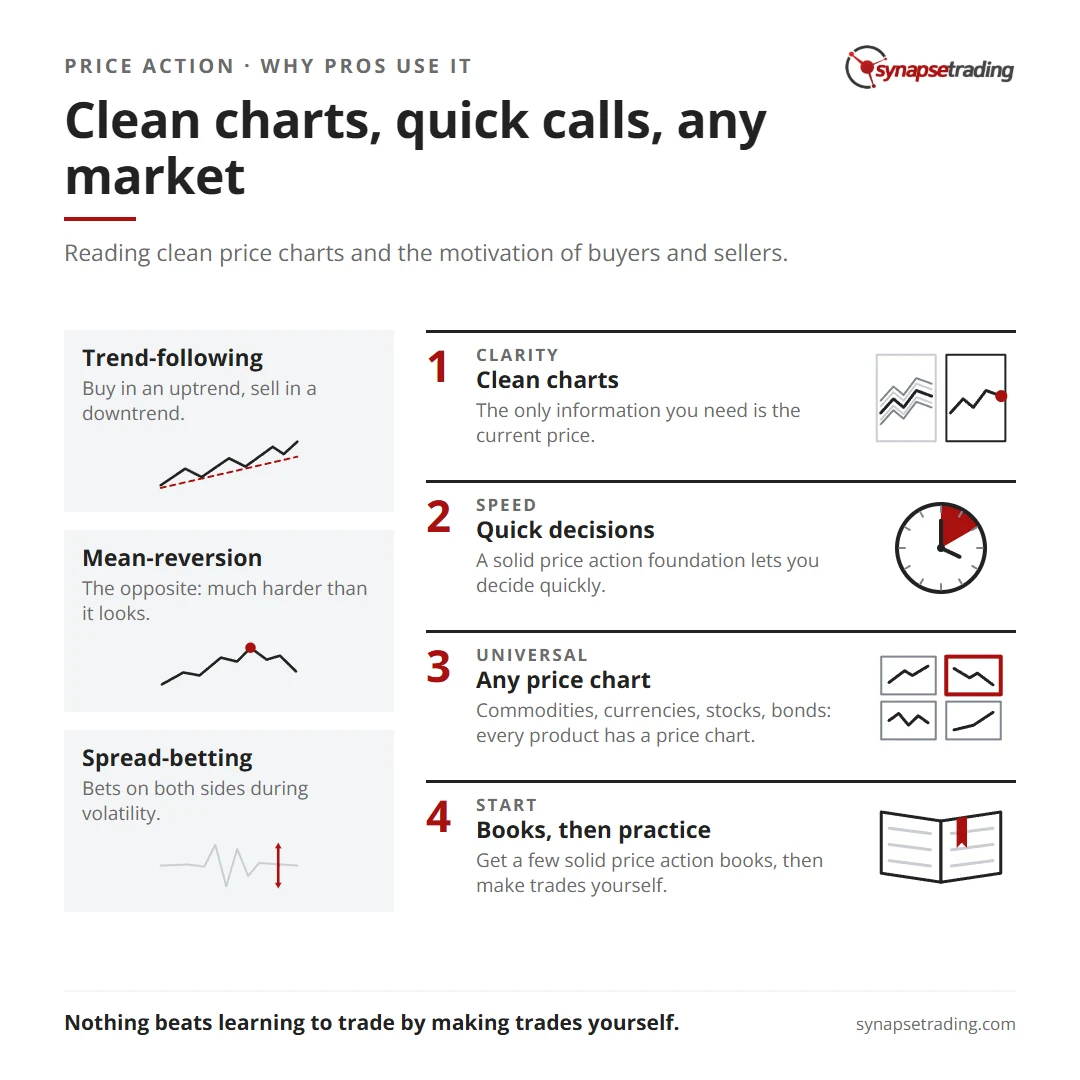
Clean charts, quick calls, any market. Summary card for the post: Top 3 Reasons Why Price Action is Chosen by Professional Traders.

Why Then, is Price Action Preferred by Professional Traders?


1. CLARITY

Price action trading is trading with clean charts. The only information you need is the current price, and these are displayed using candlestick charts. In the charts below, we see that the blank chart is far clearer and easier to read than the complicated one with many indicators.

CLARITY CLARITY 2


2. SPEED

When trading intra-day, traders need to quickly make a decision when the price action unfolds before them. While checklists and criteria do help, having a solid price action foundation would allow the trader to make a decision quickly. How would you make a trading decision, if you had to look at 12 screens at once?

SPEED

Image Source: LifeHacker.com

In contrast, I can make my trades on a single laptop computer, or even on my mobile devices. Something like this is more than sufficient:

SPEED 2

Image Source: MyCompas.com


3. UNIVERSALITY

Perhaps the biggest reason why price action is preferred, is that price action is universal. You can trade commodities, currencies, stocks, bonds, ETFs, REITs, futures on just about anything, and even options, because every product has a price chart. You can be just as sure that Coffee Futures have the same price action mechanics as Apple stock, and you wouldn’t have a problem transiting between products.

Trading is very much like selecting from a diverse menu in a fancy restaurant; while there are many products to trade, many traders settle on trading a few products and get proficient at them.

UNIVERSALITY

Price action works on just about anything with a price chart and a liquid secondary marketplace.
Image Source: TheActuary.com


How Can I Get Started On Price Action Trading?

For a start, I recommend using the old-school way by getting your hands on a few solid price action books. Many of these are available in public libraries, and if you have some spare cash, you can consider buying them on amazon.

Next, is to practice! While reading books and watching others trade is a great way to learn, nothing beats learning to trade by actually making trades yourself.

If you currently use many indicators and are not profitable, perhaps the question to ask yourself is whether you would like to understand what is behind the price chart and the indicators. It is not enough to use a formula, because market conditions change over time.

Here’s to wishing you all the best on your trading journey, and I hope this article has expanded your mind just a little more!

by Spencer Li
https://synapsetrading.com/wp-content/uploads/2026/10/top-3-reasons-why-price-action-is-chosen-by-professional-traders-card.webp 630 1200 Spencer Li https://synapsetrading.com/wp-content/uploads/2026/10/synapse-logo-horizontal-light.png Spencer Li2019-10-18 01:18:412026-08-23 21:50:20Top 3 Reasons Why Price Action is Chosen by Professional Traders
Page 24 of 25«‹22232425›

Free checklist

The 15-Minute Swing Trader’s Checklist

The daily and weekly routine I use to find, manage and review trades in about 15 minutes a day, trading since 2007.

Get the free checklist

Topics

  • Trading foundations
  • Technical analysis
  • Strategies and systems
  • Risk and money
  • Trading psychology
  • Markets and products

Synapse Trading

Swing trading for busy professionals, in 15 minutes a day.

Start free

Learn

  • Start here
  • Free trading guides
  • Blog
  • Tools and resources

Programs

  • Trading Mastery Program
  • Daily trading signals
  • Student results
  • Public trade log

Company

  • About
  • Contact me
  • Partnerships
  • Disclaimer
  • Privacy policy
  • Terms & Conditions

Synapse Trading Pte Ltd
Registration No. 201316168H
WhatsApp +65-8897-1204
info@synapsetrading.com

Contact Us

Synapse Trading Pte Ltd
Registration No. 201316168H

Whatsapp: +65-8897-1204
Telegram: @iamrecneps
Email: info@synapsetrading.com

Links

Disclaimer
Privacy policy
Terms & Conditions
Contact us
Partnerships

© 2012-2026 Synapse Trading | All rights reserved. Educational content only, not personalised financial advice. Trading carries risk, including loss of capital. Past performance is not indicative of future results. Synapse Trading is not licensed or regulated by MAS.
  • Link to Facebook
  • Link to X
  • Link to Instagram
  • Link to Youtube
  • Link to LinkedIn
  • Link to Mail
Scroll to top Scroll to top Scroll to top