
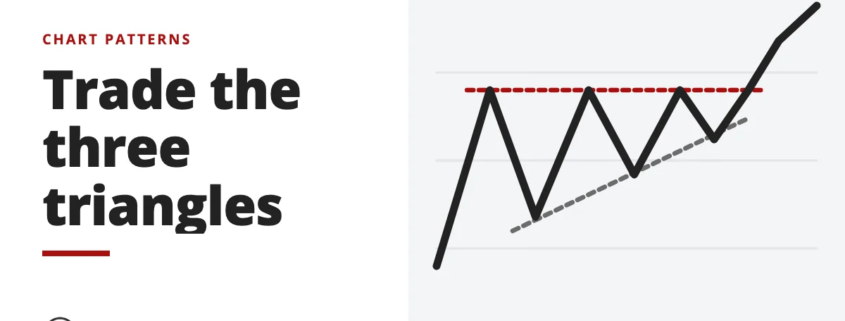
Triangle patterns compress price until it breaks out. Learn the symmetrical, ascending and descending triangles and how to trade the breakout from each.

Indicators, candlestick patterns, chart patterns and price-action method.
Indicators, candlestick patterns, chart patterns and price-action method.
Triangle patterns compress price until it breaks out. Learn the symmetrical, ascending and descending triangles and how to trade the breakout from each.
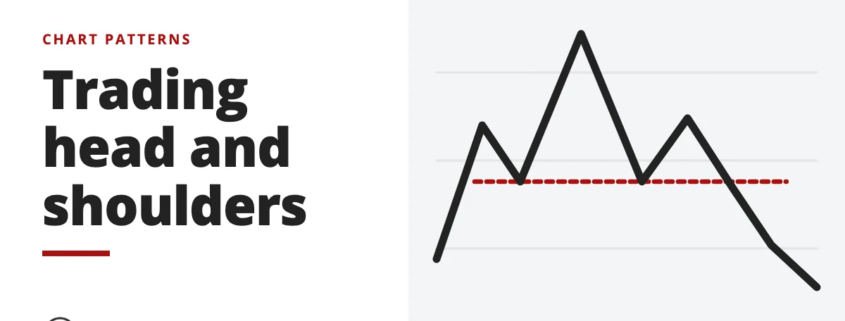
The head and shoulders is a reversal pattern found at the end of major trends. See how to spot the bearish and inverse versions and how to trade each one.
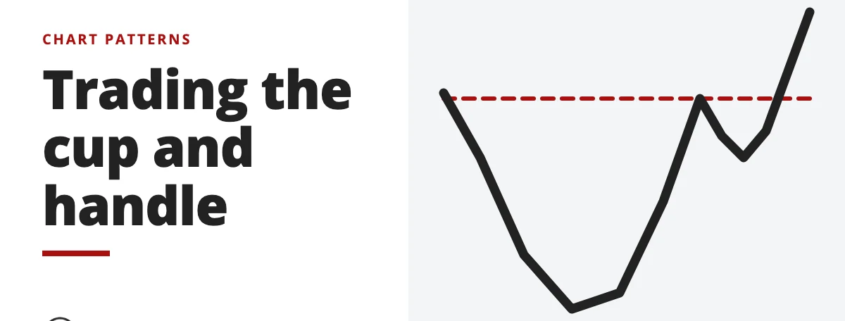
The cup and handle is an accumulation pattern that forms in long consolidations. See its two main varieties and how to trade the breakout once complete.
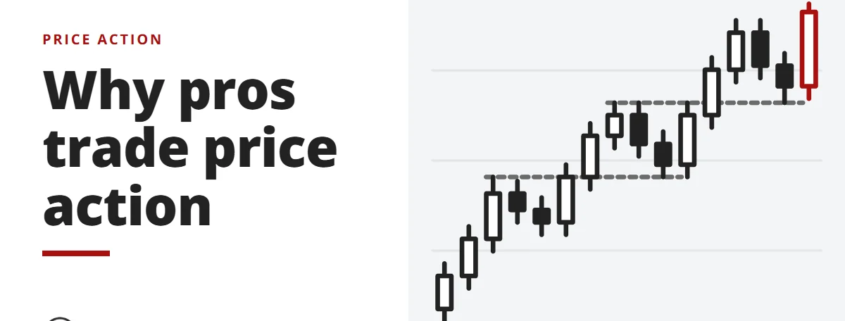
Why do professional traders read price action instead of indicators? Clarity, speed and one skill for every market, plus what price action cannot prove.
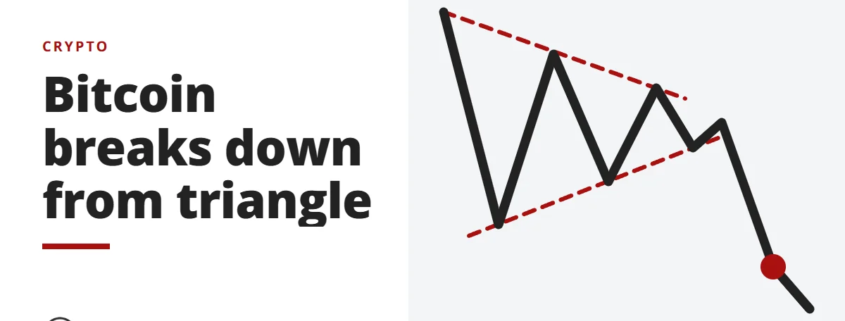
After months of consolidation, Bitcoin broke down from its triangle. The chart shows a symmetrical and a descending triangle, so the odds lean bearish.