• Link to Facebook
  • Link to X
  • Link to Instagram
  • Link to Youtube
  • Link to LinkedIn
  • Link to Mail
Free PDF: The 15-Minute Swing Trader's Checklist, the daily routine of a trader since 2007
Synapse Trading
  • Mentoring
    • Trading Mastery Program
    • All mentoring options
  • Signals
    • Daily trading signals
    • Signals trade log
  • Results
    • Student results and testimonials
    • Public trade log, losses left in
  • Free guides
    • Start here
    • Trading foundations
    • Technical analysis
    • Strategies and systems
    • Risk and money
    • Trading psychology
    • Markets and products
    • Free trading guides
    • Tools and resources
    • Blog
  • About
    • My background
    • My trading journey
    • Media and interviews
    • Travel log
  • Contact
    • Contact me
    • Partnerships
  • Start free
  • Click to open the search input field Click to open the search input field Search
  • Menu Menu

Indicators, candlestick patterns, chart patterns and price-action method.

The Synapse Network

How to Combine Candlestick Patterns with other Technical Indicators

Technical Analysis & Price Action
Candles plus indicators - candlestick patterns

Most novice traders make the mistake of treating a single candlestick pattern as a definitive trading signal.

It’s important to understand that candlestick patterns hold little value if they’re not considered within the context of overall price action.

On their own, these patterns usually lack the power to reverse a market trend.

Apart from this, combining candlestick patterns with other indicators is crucial. In fact, using multiple indicators together is a common practice among successful traders and is one of the keys to a robust trading strategy.
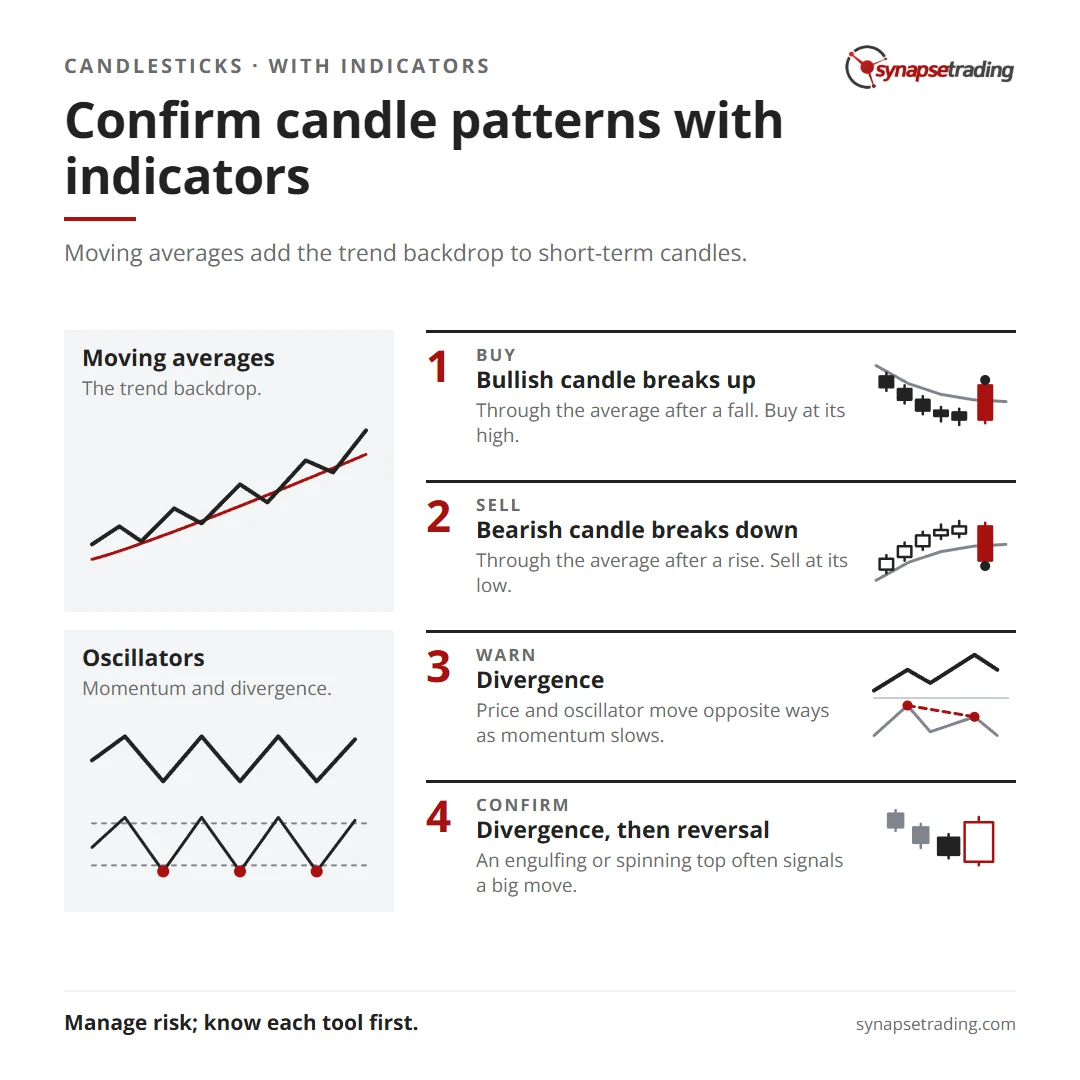
Confirm candle patterns with indicators. Summary card for the post: How to Combine Candlestick Patterns with other Technical Indicators.

Effective Combinations of Candlestick Patterns and Indicators

Here are some combinations of candlestick patterns and indicators that are widely used by many traders:

– Candlestick Patterns and Moving Averages
– Candlestick Patterns and Oscillators
– Markets are complex and rarely behave in a manner that can be predicted by a single indicator. Therefore, the more indicators you use wisely, the more accurate your predictions are likely to be. While there are various indicators you can use alongside candlestick patterns, this article will specifically focus on moving averages and oscillators.

Combining Candlestick Patterns with Moving Averages

Moving averages are among the simplest yet most powerful technical indicators available.

They provide a broader context or trend backdrop when combined with candlestick patterns, which focus more on short-term buy/sell dynamics.

This combination can help confirm trends and improve prediction accuracy.

Why Use Moving Averages?

Moving averages measure the average price of an asset over a specific period, showing market strength and the current trend.

As prices change, the moving average adapts accordingly, making it a foundational tool in technical analysis.

Traders often use moving averages as a base indicator to complement their primary trading strategy, leading to more accurate predictions.

Setting Up the Moving Averages

– Moving Average Type: Simple Moving Average (SMA).
– Moving Average Period: 30.
– Candlestick Chart: 5-minute.

Buy Setup

1. Look for a bullish candlestick that appears after a downtrend or range market.
2. Check if the candlestick breaks through the Moving Average from below.
3. Place a buy entry at the High the moment it breaks through the Moving Average.

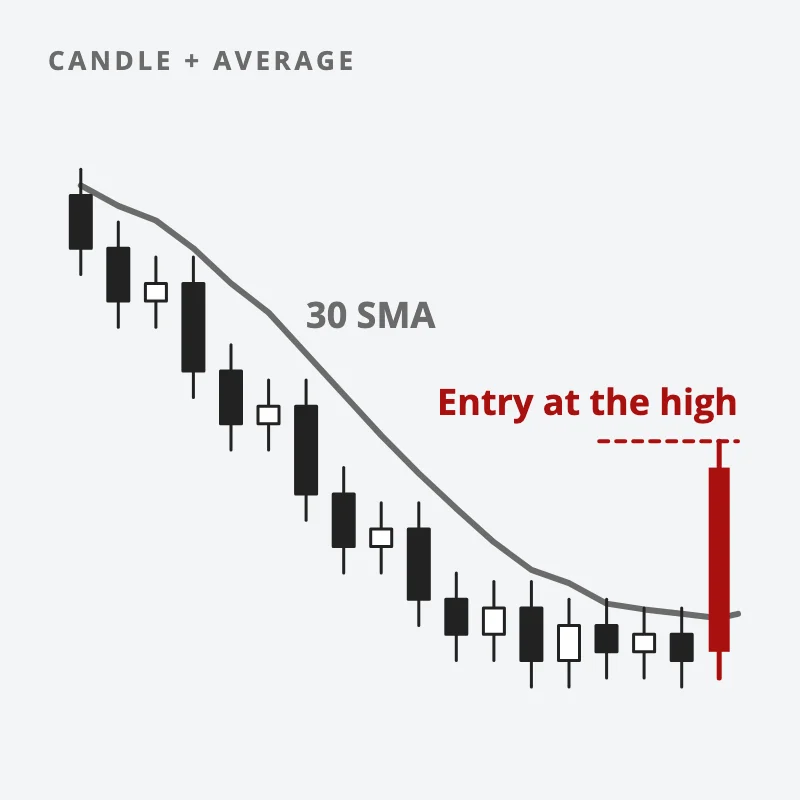
After a downtrend, a red bullish candle breaks up through the grey 30-period moving average, with the entry marked at its high
Buy when a bullish candle breaks up through the moving average, entering at its high.

Sell Setup

1. Look for a bearish candlestick that appears after an uptrend or range market.
2. Check if the candlestick breaks through the Moving Average from above.
3. Place a sell entry at the low of the price the moment it breaks through the Moving Average.

Combining Candlestick Patterns with Oscillators

While both candlestick patterns and oscillators can be used independently, combining them provides greater insight into short-term trading opportunities, market direction, and momentum.

This combination is especially useful for swing traders who rely on technical analysis to capitalize on short-term price movements.

Swing traders typically seek short-term reversals to capture upcoming price moves. They ride the wave in one direction before switching to the opposite side of the trade when the asset changes direction.

Oscillator Divergence

Divergence in oscillators occurs when the price moves in the opposite direction of the indicator, indicating a potential reversal as momentum slows.

While divergence doesn’t always signal a reversal, it often strengthens candlestick reversal patterns, leading to better trades.

Bullish and Bearish Engulfing Patterns

Engulfing patterns are prominent candlestick formations. A bullish engulfing pattern appears in a downtrend when a large bullish candle completely envelops the previous bearish candle, indicating strong buying pressure.

Conversely, a bearish engulfing pattern occurs in an uptrend, signaling strong selling pressure.

Indecision Candlesticks

Indecision candlesticks, such as spinning tops, have small bodies and long wicks, indicating market indecision.

These patterns often signal potential trend reversals, especially when multiple spinning tops occur together.

Combining Candlestick Patterns and Oscillators in Practice

When a strong divergence appears on the chart, followed by a candlestick reversal pattern like a bearish engulfing or indecision candlestick, it often signals a significant price movement in the opposite direction.

Concluding Thoughts

Combining candlestick patterns with other indicators, such as moving averages and oscillators, enhances your trading analysis and decision-making process.

While each tool can be used separately, their combination provides a more comprehensive view of market trends and momentum.

This approach helps confirm the strength and direction of trends, leading to more accurate predictions for future trades.

However, it’s essential to incorporate risk management strategies and thoroughly understand each tool before using them.

Always be prepared for unexpected market movements, and use multiple indicators to strengthen your trading strategy.


About the author. Spencer Li is The 15-Minute Trader and the founder of Synapse Trading. He is a Certified Financial Technician (CFTe) with 15+ years of trading, run from 70+ countries. He holds a B.Acc and B.BM from SMU. Every trade he takes is public, dated, losses left in. He teaches rules-based swing trading in 15 minutes a day, one system for any market.

Education, not financial advice. Synapse Trading is not licensed by MAS to advise on investment products. Trading carries risk of loss; past performance is not indicative of future results.

by The Synapse Network
https://synapsetrading.com/wp-content/uploads/2026/10/how-to-combine-candlestick-patterns-with-other-technical-indicators-card.webp 630 1200 The Synapse Network https://synapsetrading.com/wp-content/uploads/2026/10/synapse-logo-horizontal-light.png The Synapse Network2023-08-12 04:47:022026-07-20 10:26:59How to Combine Candlestick Patterns with other Technical Indicators
The Synapse Network

How to Combine Candlestick Patterns (Blended Candles)

Technical Analysis & Price Action
Blend candles into one - candlestick patterns

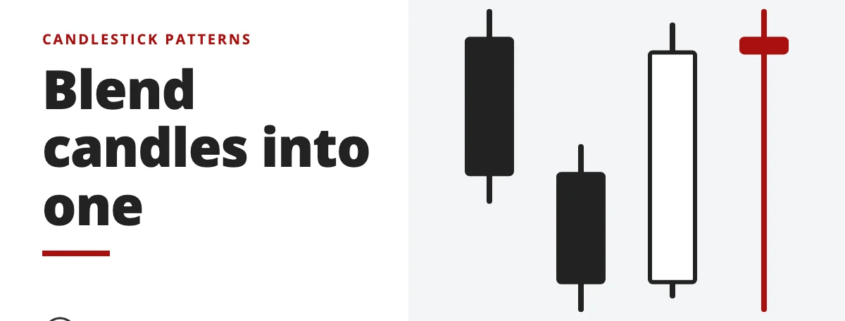
In this blog post, we introduce the concept of blending candlesticks, a technique that will be explored in greater detail in subsequent articles. Blending candlesticks involves combining adjacent candles into a single candlestick, summarizing the outcome of several periods in one candle. This technique can be applied across different time scales, such as minute-by-minute, hour-by-hour, or day-by-day candles. The purpose of blending candles is to provide a clearer insight into market activity over longer periods.
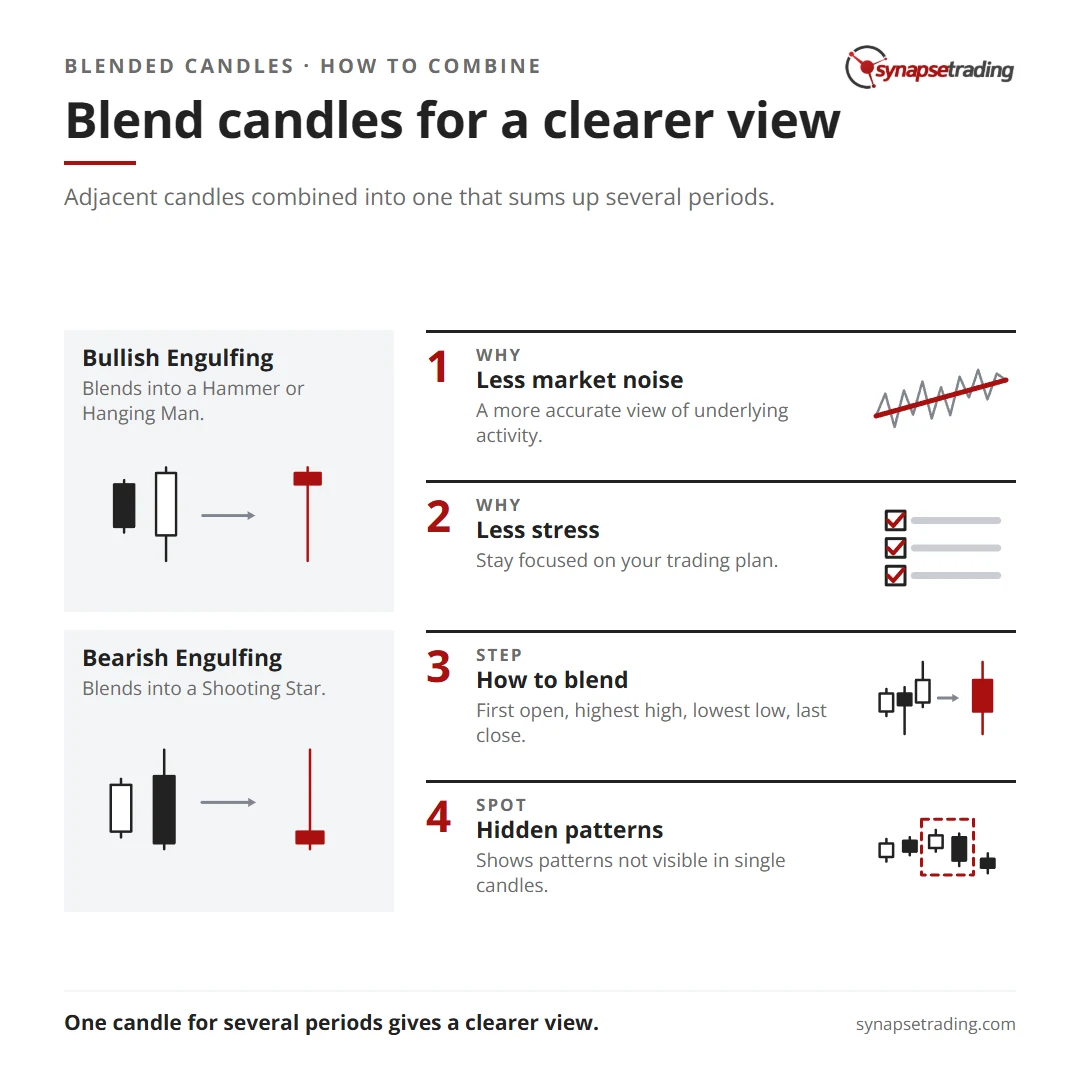
Blend candles for a clearer view. Summary card for the post: How to Combine Candlestick Patterns (Blended Candles).

Why Blend Candlesticks?

Blending candlesticks offers several advantages for traders:

– Stronger Signals: Blended candles can create a single, more robust signal, helping traders identify key market movements.
– Minimizing Market Noise: By blending candles, traders can reduce the impact of market noise, leading to a more accurate reflection of underlying activity.
– Revealing Hidden Patterns: Blending certain candles can help reveal patterns that may not be visible when analyzing individual candles.
– Reducing Psychological Stress: Watching individual candles over short periods can create stress, leading to premature exits from trades. Blending candles helps traders stay focused on their trading plan and avoid reacting emotionally to short-term price movements.

How Blending Works

The process of blending candlesticks is straightforward. First, decide how many candles you want to blend. Then, take the opening price of the first candle, the highest and lowest prices achieved across all candles, and the closing price of the last candle. The result is a single candlestick that represents the combined activity of the selected periods.

Examples of Blending Candlesticks

Hammer/Hanging Man

In Figure 1, we see the blending of two candles. The first candle is a down period with a large body, followed by a second candle with a larger body that fully engulfs the previous period. This creates a pattern known as a Bullish Engulfing pattern, which, when blended, results in a Hammer or Hanging Man candlestick. The Hammer typically signals potential bullishness after a downtrend, while the Hanging Man forms in an uptrend.

blended1

Shooting Star

Figure 2 shows the blending of a Bearish Engulfing pattern, resulting in a Shooting Star candlestick. The Shooting Star is often formed after a prolonged advance and signals a potential bearish reversal. The long upper shadow indicates that the bulls initially dominated, but the bears regained control, closing the price below the opening.

blended2

Blending Multiple Candles

Figure 3 demonstrates the blending of three candles. By blending multiple candles, traders can summarize the market’s actions over several periods, leading to more insightful market signals.

blended3

Practical Application in CandleScanner

In CandleScanner, the base time interval is crucial for blending candles. The software allows you to blend candles of the same time interval (e.g., 15 minutes, 30 minutes, etc.), ensuring accurate data representation. By blending candles, traders can build basic candles, which can serve as building blocks for more complex patterns.

Spotting Hidden Patterns

Blending candles can help identify patterns that might otherwise be overlooked. For example, a Bearish Engulfing pattern that doesn’t initially meet the criteria might become valid after blending adjacent candles, revealing market activity that was previously hidden.

Concluding Thoughts

Blending candlesticks is a powerful technique that allows traders to gain a clearer understanding of market movements by summarizing multiple periods into a single candle. This approach helps minimize noise, reveal hidden patterns, and reduce the psychological stress associated with short-term trading. As traders become more familiar with blending candles, they can enhance their trading strategies and improve decision-making in the market.

by The Synapse Network
https://synapsetrading.com/wp-content/uploads/2026/10/how-to-combine-candlestick-patterns-blended-candles-card.webp 630 1200 The Synapse Network https://synapsetrading.com/wp-content/uploads/2026/10/synapse-logo-horizontal-light.png The Synapse Network2023-08-12 04:25:352026-07-12 18:03:19How to Combine Candlestick Patterns (Blended Candles)
The Synapse Network

How to Read Candlestick Patterns Like a Pro

Technical Analysis & Price Action
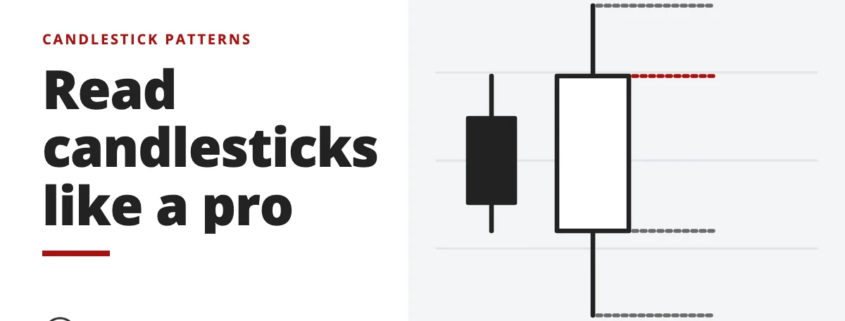
Read candlesticks like a pro - candlestick patterns

Price action trading and candlestick patterns are some of the most commonly used concepts in technical analysis.

However, misconceptions and half-truths can cause confusion and lead to poor trading decisions.

In this blog post, we’ll explore the five best candlestick patterns and provide insights on how to trade them effectively.

We’ll also address common issues traders face when working with price action trading.
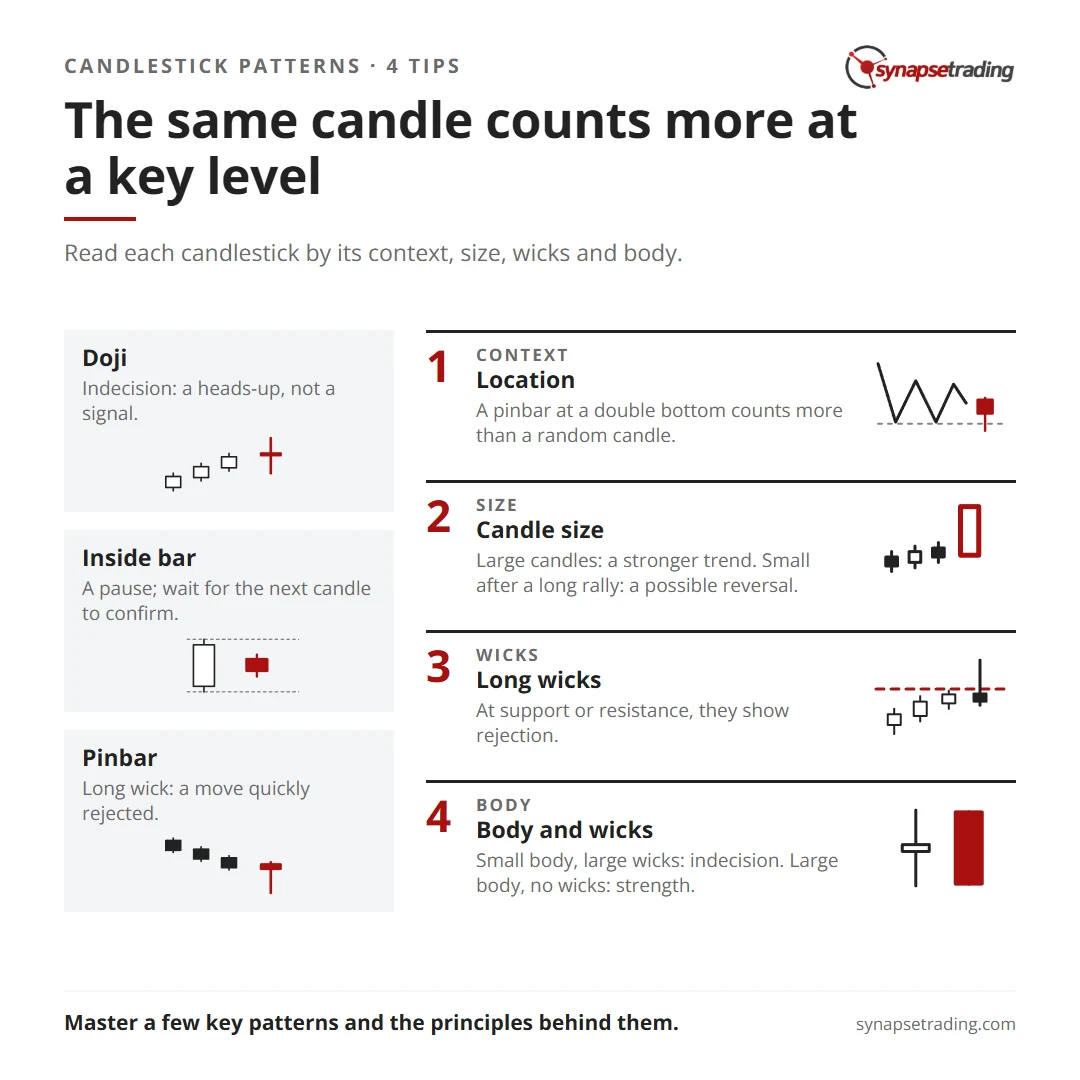
The same candle counts more at a key level. Summary card for the post: How to Read Candlestick Patterns Like a Pro.

4 Tips for Candlestick Patterns Trading


1. Context and Location

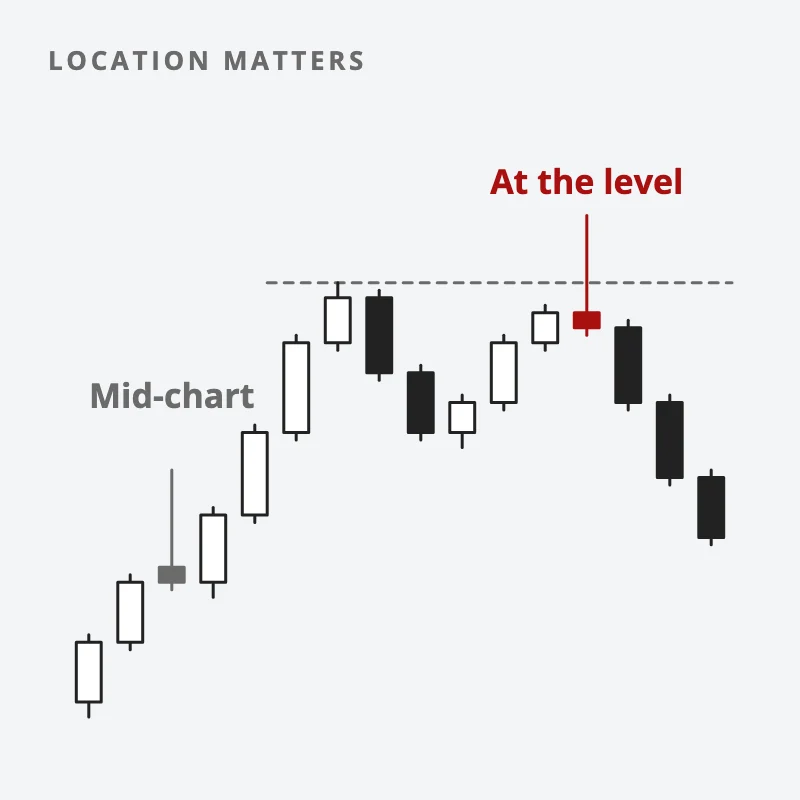
The foundation of price action and candlestick trading lies in understanding context and location. Always compare the current candlestick to recent price action to get the full picture. Focusing too much on individual candlesticks without considering the broader context can lead to mistakes. Location is equally important; candlesticks at significant price levels, such as a pinbar at a double top or bottom, carry more weight than random candlesticks in the middle of a chart.

Two identical pinbar candles: a grey one in the middle of a rally and a red one at a double-top level, where it counts
The same candle carries far more weight at a key level than mid-chart.

2. Size

The size of a candlestick can reveal a lot about the market’s strength, momentum, and trends. Larger candles often indicate a stronger trend, while small candles after a prolonged rally can signal a potential reversal or the end of a trend.

3. Wicks

Long wicks at key support or resistance levels often suggest potential reversals. Wicks indicate rejections and failed attempts to push the price higher or lower. While long wicks around double tops or bottoms can be strong signals, not all wicks indicate reversals. It’s crucial to assess the context in which they appear.

4. Body

The body of a candlestick represents the range between the opening and closing prices. The body’s size and the presence of wicks offer insights into market sentiment. For instance, a small body with large wicks shows indecision, while a large body without wicks suggests strength. Understanding the relationship between the body and wicks is key to interpreting candlestick patterns.


The 5 Best Candlestick Patterns

While there are many candlestick patterns to learn, mastering a few key ones can greatly enhance your trading strategy.

Below are five of the best candlestick patterns, explained in the context of the four principles discussed above.

#1 Abandoned Baby – Evening Star

The abandoned baby and evening star patterns are most effective on daily charts but can also appear on lower timeframes. These patterns involve a sequence of candles:
Uptrend: A long green candle followed by a small candle with a gap up, then a large red candle with a gap down.
Downtrend: A long red candle followed by a small candle with a gap down, then a large green candle with a gap up.
Key Concepts: The gap between candles is not mandatory, but the sequence is crucial. The small candle often has wicks on both sides, indicating a struggle between bulls and bears.

Meaning: This is a classic reversal pattern. After a strong trend, the price gaps but fails to maintain momentum, and the third candle confirms the reversal. Waiting for the third candle to close is essential to validate the pattern.

#2 Doji – Spinning Top

Dojis are common candlestick patterns that often signal indecision in the market. A Doji candle typically has a small body with wicks on both sides.
Key Concepts: A Doji alone is not a trading signal but a heads-up to potential market changes. They often appear after strong trends or at key support/resistance levels. The size of the wicks can indicate the intensity of the battle between bulls and bears.

Meaning: Dojis indicate a pause in the market, where buyers and sellers are reevaluating their positions. They’re an opportunity to adjust your stop-loss or take partial profits in anticipation of a possible reversal.

#3 Engulfing or Outside Bar

The engulfing bar, also known as an outside bar, is a strong signal when it appears in the right context. This pattern involves a smaller candle followed by a larger one that completely engulfs the previous candle.
Key Concepts: The pattern is more powerful when the second candle has small or no wicks and is significantly larger than the first. A rejection wick on the larger candle can further strengthen the signal.

Meaning: Engulfing bars can signal either a trend reversal or continuation, depending on the direction of the second candle. During a trend, they often mark the end of a retracement and a continuation of the trend.

#4 Inside Bar and Fakey

The inside bar pattern is a smaller candle that falls entirely within the range of the previous, larger candle. The Fakey pattern occurs when the price breaks out of the inside bar’s range, only to reverse direction immediately.
Key Concepts: Patience is crucial when trading inside bars. Wait for the candle after the inside bar to confirm the breakout before entering a trade. The Fakey pattern often exploits the impatience of amateur traders who place pending orders.

Meaning: Inside bars represent a pause in the market, often before a significant move. The Fakey pattern can indicate a false breakout, trapping traders who entered too early.

#5 Pinbar, Hammer, Kangaroo Tail

The pinbar is one of the most popular and powerful candlestick patterns, characterized by a long wick and a small body. It often indicates a potential reversal in the market.
Key Concepts: A pinbar can signal a trend reversal when it appears after a prolonged trend or during a trend when it acts as a continuation signal. The long wick usually represents the failed attempts of amateur traders to predict market movements.

Meaning: The pinbar’s wick shows where the market attempted to move but was quickly rejected, leading to a reversal. This pattern is particularly useful for identifying potential turning points in the market.

Concluding Thoughts

Understanding and applying candlestick patterns can significantly enhance your trading strategy. By focusing on the context, size, wicks, and body of candlesticks, traders can gain valuable insights into market sentiment and potential price movements. While it’s tempting to memorize numerous candlestick patterns, mastering a few key ones and understanding the underlying principles is more effective. Always remember to use these patterns in conjunction with other technical analysis tools and sound money management practices to maximize your trading success.

by The Synapse Network
https://synapsetrading.com/wp-content/uploads/2026/10/how-to-read-candlestick-patterns-like-a-pro-card.webp 630 1200 The Synapse Network https://synapsetrading.com/wp-content/uploads/2026/10/synapse-logo-horizontal-light.png The Synapse Network2023-08-11 06:30:222026-08-18 08:36:37How to Read Candlestick Patterns Like a Pro
The Synapse Network

The Wrong Way to Trade Candlestick Patterns (Common Mistakes)

Technical Analysis & Price Action
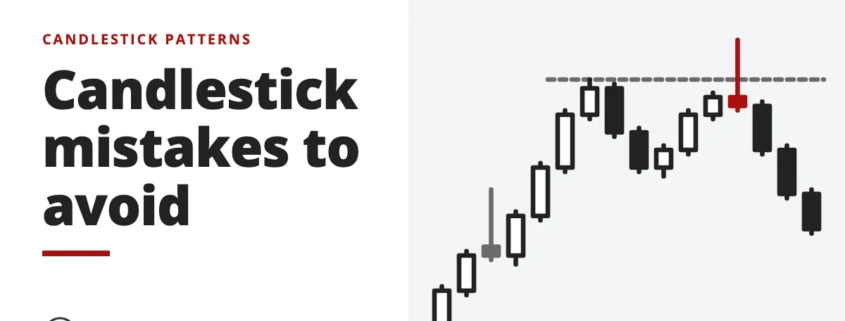
Candlestick mistakes to avoid - candlestick patterns

Japanese candlesticks are a widely used charting technique in technical analysis, offering insights into price action and helping traders predict future price movements.

While they are a powerful tool, new traders often make common mistakes when using Japanese candlesticks.

Here are some of those mistakes and tips on how to avoid them:
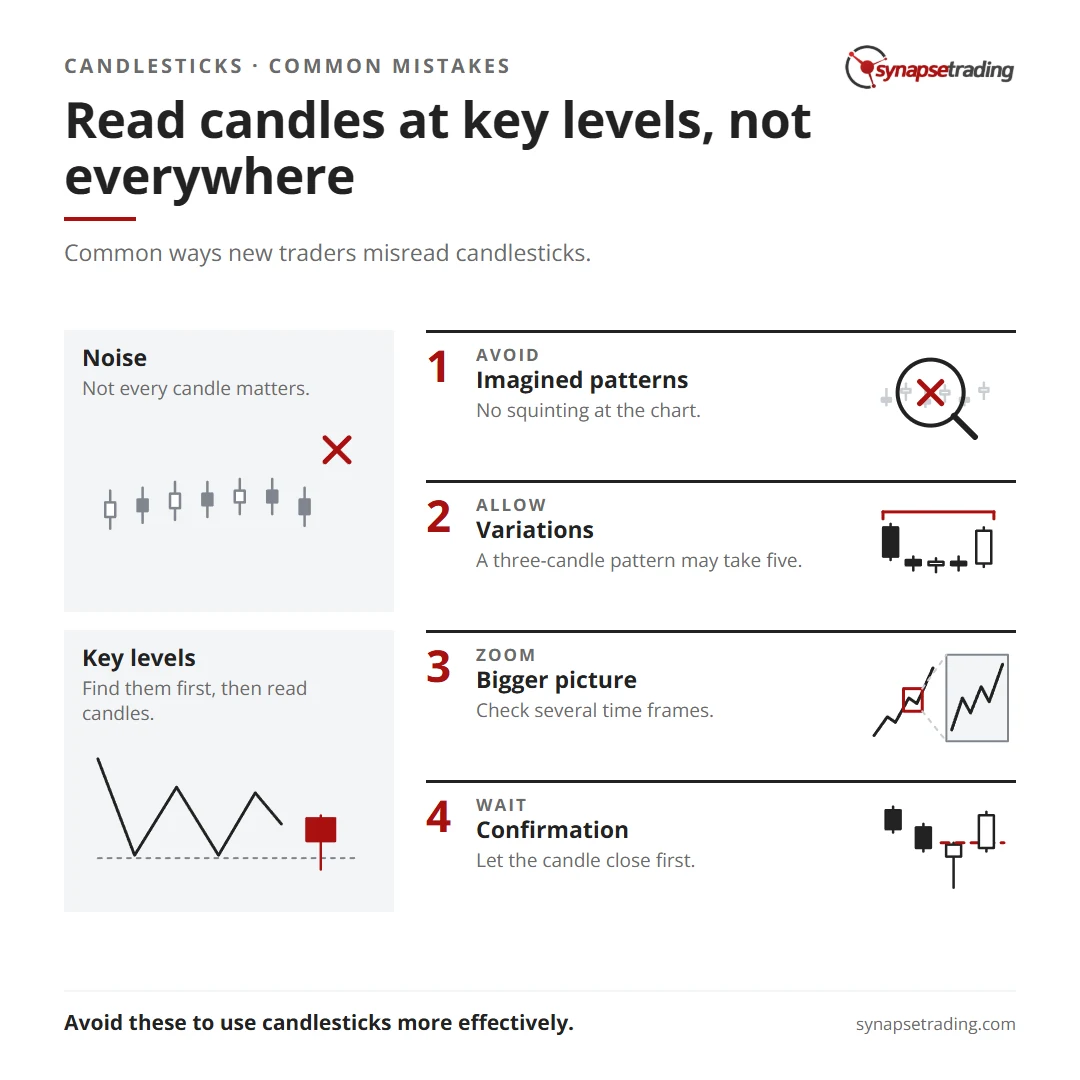
Read candles at key levels, not everywhere. Summary card for the post: The Wrong Way to Trade Candlestick Patterns (Common Mistakes).

1. Searching for Meaning in Every Candlestick

One common mistake is trying to find significance in every candlestick on the chart. Markets often produce “noise,” and not every candlestick is relevant to predicting future price movements. Instead of analyzing every candlestick, focus on those that form near critical support and resistance levels. First, identify these key levels, and then look for meaningful candlestick patterns around them.

2. Overactive Imagination

Another mistake is seeing patterns that aren’t really there. If you find yourself zooming in excessively or squinting at the chart because you think you see something, it’s likely just your imagination. You don’t need to assign a textbook label to every candlestick formation you notice. Instead, focus on identifying strong buying or selling pressure in alignment with your expected market direction.

3. Underestimating Variations in Patterns

Textbook examples of candlestick patterns often show them forming over a specific number of candles, such as three. However, in real trading, these patterns might take more candles to develop. Just because a three-candlestick pattern takes four or five candles to form doesn’t invalidate its significance. The key is to understand the price action behind the pattern rather than strictly adhering to its standard form.

4. Losing Sight of the Bigger Picture

Focusing too narrowly on short time frames, like 5-minute charts, without considering the broader context can lead to poor trading decisions. It’s essential to step back occasionally and look at the bigger picture to avoid getting blindsided by larger market trends. Balance your analysis by considering multiple time frames.

5. Failing to Wait for Confirmation

Some candlestick patterns are considered “self-confirming,” but many require additional confirmation before acting on them. Always wait for the candlestick to close and fully form before making a trade. For instance, if you spot a Tweezer Bottom, it’s wiser to wait and ensure that the candlestick following the pattern closes higher before going long. Waiting for confirmation helps validate the pattern and reduces the risk of false signals.

By being aware of these common mistakes and taking steps to avoid them, you can use Japanese candlesticks more effectively in your trading strategy.

by The Synapse Network
https://synapsetrading.com/wp-content/uploads/2026/10/the-wrong-way-to-trade-candlestick-patterns-common-mistakes-card.webp 630 1200 The Synapse Network https://synapsetrading.com/wp-content/uploads/2026/10/synapse-logo-horizontal-light.png The Synapse Network2023-08-11 06:29:102026-09-25 21:33:14The Wrong Way to Trade Candlestick Patterns (Common Mistakes)
Spencer Li

Inverted Hammer Candlestick Pattern: What It Really Means and How to Trade It Without Buying Too Early

Technical Analysis & Price Action
The inverted hammer - candlestick patterns

By Spencer Li, CFTe · Last updated: 13 July 2026

An inverted hammer is a single bullish candle that forms after a fall in price. Its real body, the part between the open and the close, is small and sits at the bottom of the session’s range. Above it is a long upper shadow, at least twice the height of the body, and below it there is little or no shadow at all. It warns that a downtrend may be ending. On its own it proves very little, so most traders wait for the next session to open above the real body, or to close higher, before they buy, and they put the stop just below the inverted hammer’s low.

It is the same shape as a shooting star, which is bearish after a rise. It also has one odd feature the other bullish candles lack. The session that forms it is bearish.
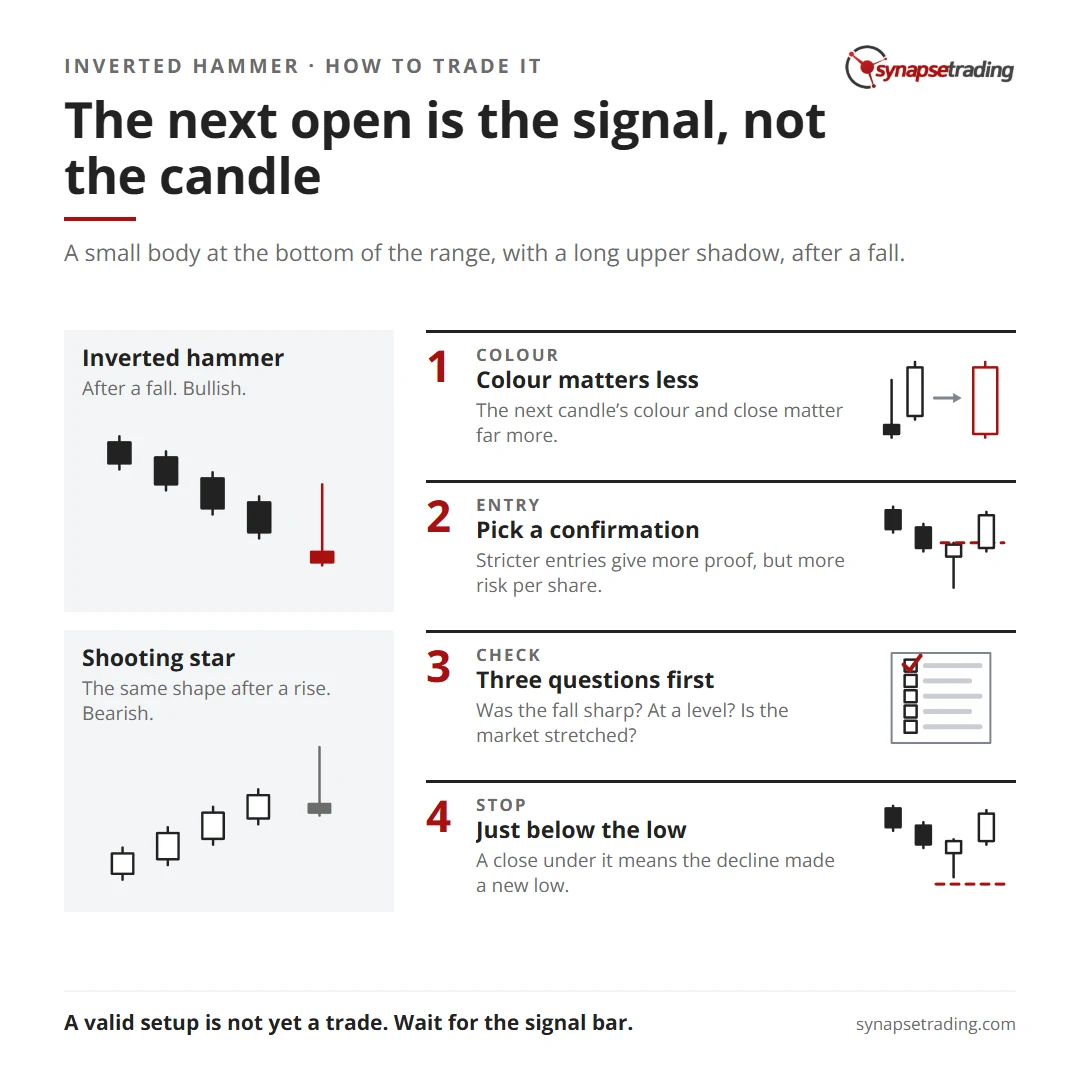
The next open is the signal, not the candle. Summary card for the post: Inverted Hammer Candlestick Pattern: What It Really Means and How to Trade It Without Buying Too Early.

Why does a bullish candle look so bearish?

Imagine a stock that has been falling for three weeks. One morning it opens near its lows, buyers push it up hard, and for a few hours it looks like the bottom is in. Then the buying fades. By the close, price is back down near where it opened.

Taken on its own, that is a failed rally. Steve Nison, whose 1991 book Japanese Candlestick Charting Techniques brought candlesticks to most Western traders, said as much, because the price action that forms an inverted hammer looks bearish. So why does every candlestick guide, his included, call it a bullish signal?

The answer arrives the next morning. Nison’s test is that the next session should open above the inverted hammer’s real body, and “the larger the gap the stronger the confirmation”.

Think about the short sellers, the traders who sold the stock on the way down hoping to buy it back cheaper. They watched yesterday’s rally fail and went to bed relieved. Now price opens above where they last saw it close, their profits are shrinking before the first coffee, and some of them start to buy back in a hurry. Nison wrote that this can “spark a short covering rally”, which then draws in the bottom pickers and can “feed upon itself”.

So the bullish news in an inverted hammer is the open that follows it. The candle only sets the scene.

Is an inverted hammer the same as a shooting star?

If the session is bearish, what stops the candle from being bearish everywhere?

The trend it lands in. After a rise, a small body at the bottom of the range with a long shadow above it is a shooting star, and after a fall the identical candle is an inverted hammer. Flip the shadow underneath the body and you get the hammer after a fall, or the hanging man after a rise.

The candlestick course I took in Singapore back in 2009 paired the inverted hammer with one more candle, for the day the open and close are equal and the body disappears. That shape is a gravestone doji.

Does the colour of an inverted hammer matter?

In June 2021, a trader on Reddit’s r/technicalanalysis who was new to technical analysis listed four candles, a red and a green hammer and a red and a green inverted hammer. They asked a question that plenty of beginners have: “which one is most bullish?”

It is a fair question, and many guides answer it with great confidence. My answer is that the colour of this candle matters less than people expect. Nison said the colour of the real body is not important on the shooting star, which is the same shape, and my 2009 course taught the inverted hammer in either colour.

The colour the course did care about was the colour of the next candle, and on the practice charts it kept asking the same thing: “how will the candle look if blended together?”

Blending squashes two candles into one, keeping the open of the first, the close of the second, and the highest high and lowest low of both.

Let me show you with made-up round numbers. Say a stock has dropped from 80 to 50 in three weeks. It prints an inverted hammer that opens at 50.20, rallies as high as 54, and closes at 50.80, with a low of exactly 50.

Suppose the next session opens at 51.50 and closes at 53.80. Blend the two days together and you get one candle that opens at 50.20 and closes at 53.80, near the top of its range. That is a big white candle, two days of buyers taking control.

Now suppose instead that the next session opens at 50.60 and closes at 50.30. Blend those and you get a candle that opens at 50.20, closes at 50.30, and still has a long shadow up to 54. That is the same failed rally, now stretched over two days.

So if I had to rank that trader’s four candles, I would rank the day after instead. Personally, I also trust an inverted hammer a little less than a hammer at the same support. Here’s why. In the course I teach, a pin bar is a long wick rejecting a level, and at support the hammer’s wick points down into that level. The inverted hammer’s wick points the other way, so the level it rejected was the higher one.

Candles like this reward checking the same few things every day, and my free 15-minute swing trader checklist is the routine I use myself.

How much confirmation is enough?

In early February 2026, gold had just fallen about 20% from its high, and silver had dropped about 40%, which I called “quite insane” in my weekly outlook on 5 February. I told viewers that, for trading, it “was kind of too fast” to take, and that what I wanted to see was a pullback that held above the low, followed by another leg up. As I put it, “we just want to make sure that we are not … catching a falling knife”.

Ten weeks later, on 15 April, I said something that sounds like the opposite. I had been adding positions as the market recovered, and I warned that “if you wait too long … for too much confirmation, then the reward to risk ratio will become worse and worse”.

Both are true. The inverted hammer just makes the trade-off unusually sharp, because so much of the candle is shadow. Here are three levels of confirmation on the same made-up stock, with the stop just under the low at 49.80.

ConfirmationWhere you buyRisk per share
Nison’s test: the next session opens above the real body51.50, at the open1.70
My 2009 course: the next session closes higher53.80, at the close4.00
A close above the whole candle, wick included54.20, at the close4.40

The strictest traders ask for a close above the whole candle, and with an inverted hammer the top of the candle is the top of that long wick.

Now say you risk the same amount of your account on each version. The strict entry buys only about 39% as many shares as Nison’s, because every share carries about 2.6 times the risk. And the target, wherever you set it, has not moved any closer.

What the strict entry buys you is proof, because by the time the market closes above 54, the buyers who failed in the inverted hammer’s session have come back and won. Which level suits you depends on how fast the decline was and how many other reasons you have to be there.

How do you trade an inverted hammer?

A trader who buys every inverted hammer gets a lot of practice at taking small losses. The candle is everywhere. So I ask three questions, in order.

  1. Was the fall sharp? A fast drop ends in a climax of selling for the candle to mark. A market that slides gently for months has no such climax.
  2. Is it at a level that matters? Think of a previous swing low, a widely watched moving average or a Fibonacci retracement. The more of them that line up, the more likely buyers are waiting there.
  3. Is the market stretched? A momentum gauge such as the RSI, which runs from 0 to 100, tells you whether the selling has gone a long way in a short time.

If all three are yes, the entry comes from the table above. The stop goes just below the inverted hammer’s low, because a close under it means the decline has made a new low and the buyers who showed up have been beaten. The first target is usually the next resistance, such as the level where the fall last paused.

The course I teach has a firm rule for the moment before entry, which is that a valid setup is not yet a trade. You wait for the signal bar, and without one there is no trade, however good the chart looks. With an inverted hammer, that wait is the whole point.

I should be honest about my own records. As at October 2026, my public trade log holds every trade, dated, losses left in, but it does not record which candle started each one, so I cannot tell you how my inverted hammers have done.

If you would rather do this checking once a day than all day, the free 15-minute swing trader checklist is the routine I run myself.

When does an inverted hammer fail?

Alex Nekritin and Walter Peters, in Naked Forex, file any signal candle that prints away from support or resistance under “simply interesting price formations”. An inverted hammer floating in the middle of a range is one of those. Nothing underneath it needs defending.

The second failure comes the next morning. If the market opens below the inverted hammer’s body, the short sellers never get the fright that the whole pattern depends on, and the trade is cancelled before it starts.

The third is momentum. In a fast, panicky decline, a market can print a perfect inverted hammer, open a little higher the next day, and then keep falling for another week, which is how bottom pickers get wiped out. That fear of the second leg is why I held back on gold and silver in February.

FAQ

Is an inverted hammer bullish or bearish?
Bullish. It forms after a fall and warns that the downtrend may be ending. It becomes a trading signal once the next session opens above its real body or closes higher.

What is the difference between an inverted hammer and a shooting star?
They are the same shape, a small body at the bottom of the range with a long upper shadow. After a fall it is an inverted hammer and bullish. After a rise it is a shooting star and bearish.

How do you confirm an inverted hammer?
Nison’s test is a next-day open above the real body, and the larger the gap, the stronger the signal. Stricter traders wait for a higher close, or a close above the inverted hammer’s high.

Where do you put the stop loss on an inverted hammer?
Just below the inverted hammer’s low. A close under it means the decline has made a new low.

Does a red inverted hammer still count?
Yes. The colour of its body matters far less than the colour and close of the next candle.


Have you ever bought an inverted hammer the moment it printed, only to watch the next day open lower? And when you wait for confirmation, which of the three levels do you use? Let me know in the comments.

For every pattern in one place, read The Definitive Guide to Candlestick Patterns. The same candle after a rise is the shooting star, and a common confirming candle is the bullish engulfing pattern. For the wider picture, start with my free trading guides.

ed seykota

If you would like to learn more about all the different candlestick patterns, also check out: “The Definitive Guide to Candlestick Patterns”

And if you want a routine that catches these turns without hours at the screen, grab the free 15-minute swing trader checklist.


About the author. Spencer Li is The 15-Minute Trader and the founder of Synapse Trading. He is a Certified Financial Technician (CFTe) with 15+ years of trading, run from 70+ countries. He holds a B.Acc and B.BM from SMU. Every trade he takes is public, dated, losses left in. He teaches low-risk swing trading in 15 minutes a day, one system for any market.

Education, not financial advice. Synapse Trading is not licensed by MAS to advise on investment products. Trading carries risk of loss, and past performance is not indicative of future results.

by Spencer Li
https://synapsetrading.com/wp-content/uploads/2026/10/inverted-hammer-candlestick-pattern-card.webp 630 1200 Spencer Li https://synapsetrading.com/wp-content/uploads/2026/10/synapse-logo-horizontal-light.png Spencer Li2023-01-01 16:02:412026-07-13 07:24:49Inverted Hammer Candlestick Pattern: What It Really Means and How to Trade It Without Buying Too Early
Page 20 of 25«‹1819202122›»

Free checklist

The 15-Minute Swing Trader’s Checklist

The daily and weekly routine I use to find, manage and review trades in about 15 minutes a day, trading since 2007.

Get the free checklist

Topics

  • Trading foundations
  • Technical analysis
  • Strategies and systems
  • Risk and money
  • Trading psychology
  • Markets and products

Synapse Trading

Swing trading for busy professionals, in 15 minutes a day.

Start free

Learn

  • Start here
  • Free trading guides
  • Blog
  • Tools and resources

Programs

  • Trading Mastery Program
  • Daily trading signals
  • Student results
  • Public trade log

Company

  • About
  • Contact me
  • Partnerships
  • Disclaimer
  • Privacy policy
  • Terms & Conditions

Synapse Trading Pte Ltd
Registration No. 201316168H
WhatsApp +65-8897-1204
info@synapsetrading.com

Contact Us

Synapse Trading Pte Ltd
Registration No. 201316168H

Whatsapp: +65-8897-1204
Telegram: @iamrecneps
Email: info@synapsetrading.com

Links

Disclaimer
Privacy policy
Terms & Conditions
Contact us
Partnerships

© 2012-2026 Synapse Trading | All rights reserved. Educational content only, not personalised financial advice. Trading carries risk, including loss of capital. Past performance is not indicative of future results. Synapse Trading is not licensed or regulated by MAS.
  • Link to Facebook
  • Link to X
  • Link to Instagram
  • Link to Youtube
  • Link to LinkedIn
  • Link to Mail
Scroll to top Scroll to top Scroll to top