The global financial markets are experiencing volatility as investors try to gauge the future path of monetary policy. The US Federal Reserve has said it may hike interest rates sooner than expected to combat rising inflation, which could have an impact on stock and bond markets. The Fed has also been discussing the possibility of reducing its bond-buying program.
In Asia, Japan’s central bank has said it will maintain its loose monetary policy, while China is considering measures to boost economic growth.
Gold prices have risen as traders assess the likelihood of interest rate hikes in the US. The precious metal is often seen as a hedge against inflation and is currently on track for its best week since mid-January. Meanwhile, the US dollar has experienced its first weekly loss since January, with traders uncertain about the Fed’s path.
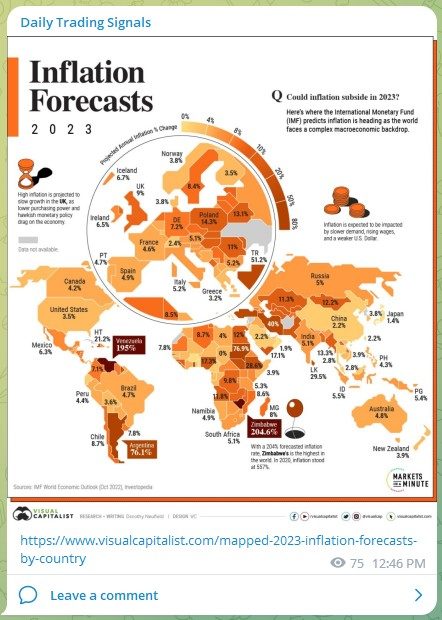
Europe is also experiencing volatility in its financial markets, with concerns over rising inflation in the eurozone. Inflation in the region hit a record high of 7.7% in February, according to Eurostat. The European Central Bank is under pressure to take action to combat inflation, but has so far maintained its stance on monetary policy.
Overall, it is a challenging time for investors as they navigate uncertainty over monetary policy, inflation, and economic growth. The situation is being closely monitored by market participants around the world.
For more market updates and real-time trading opportunities, check out our “Daily Trading Signals” Telegram channel!

[Photo: Dushanbe, Tajikistan – See my full travel photo log!]
For our weekly market wrap, we go through some of the trade calls and analysis from last week, which gives us valuable insights for the week ahead.
We cover 3 main markets with a total of 200+ counters, so we will never run out of trading opportunities:
- Forex, CFDs, commodities, bonds
- US stocks, ETFs, global stock indices
- Cryptocurrencies, crypto indices
By covering a broad range of markets, we can focus our attention (and capital) on whichever market currently gives the best returns.
Table of Contents
Weekly Market Outlook Video

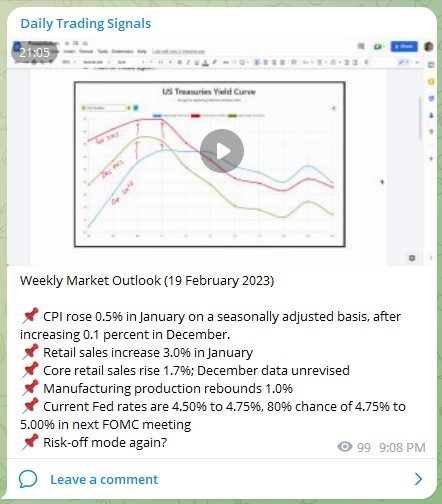
Weekly Market Outlook (26 February 2023)
Last week was great for our positioning of long USD and short equities, we could see a continue of that this week due to momentum, unless there is any major news to change the flow.
Portfolio Highlights

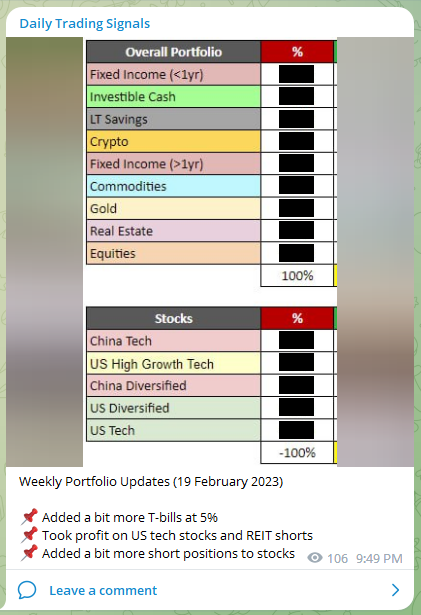
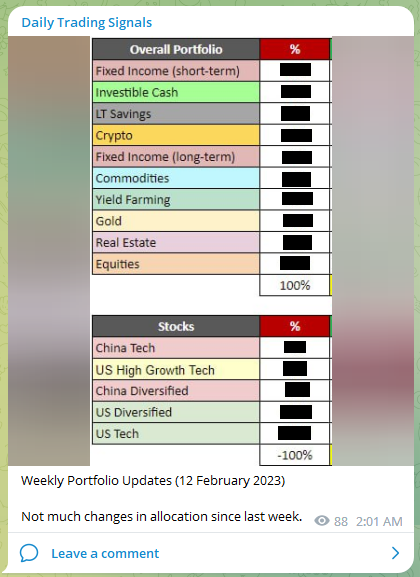
Weekly Portfolio Updates (26 February 2023)
📌 Our accumulated short positions are doing very well
📌 Added more shorts on pullbacks as the market went down
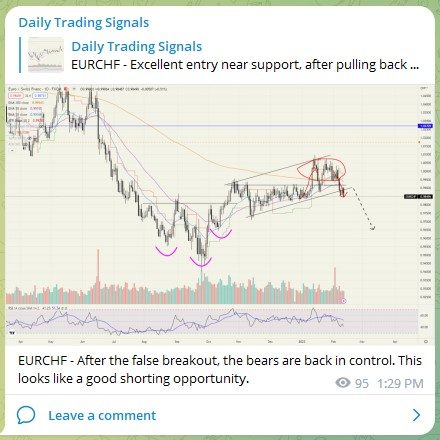
Forex & Commodities Market Highlights

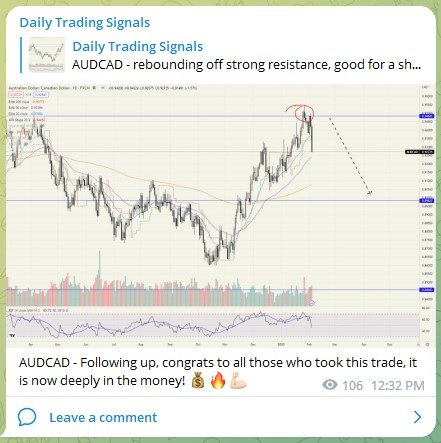
AUDCAD – Prices are falling as anticipated, congrats to those who took this short trade! 💰🔥💪🏻
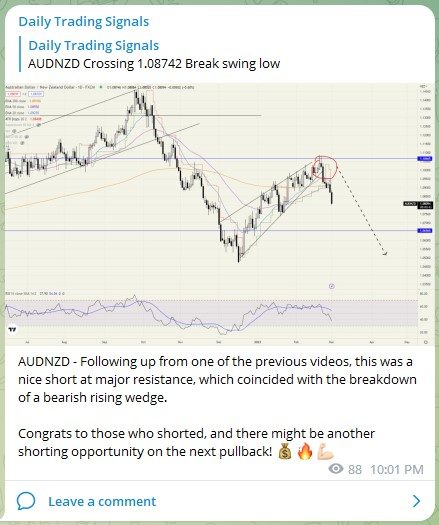
AUDNZD – Following up from one of the previous videos, this was a nice short at major resistance, which coincided with the breakdown of a bearish rising wedge.
Congrats to those who shorted, and there might be another shorting opportunity on the next pullback! 💰🔥💪🏻
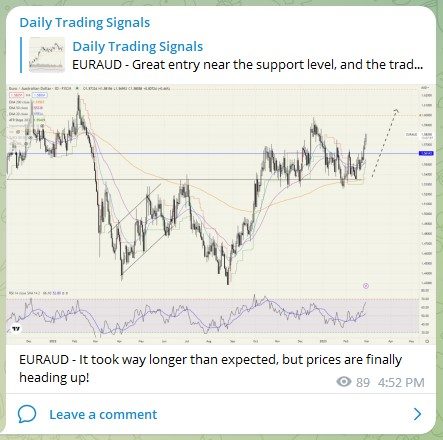
EURAUD – It took way longer than expected, but prices are finally heading up!
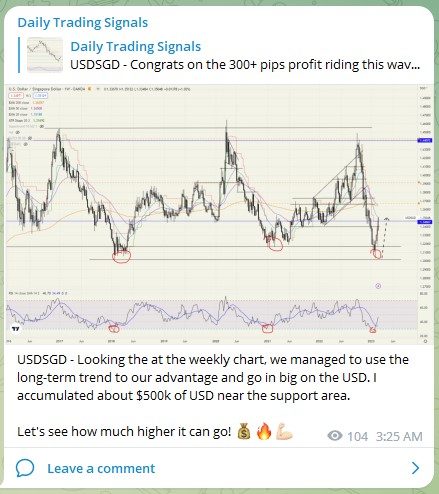
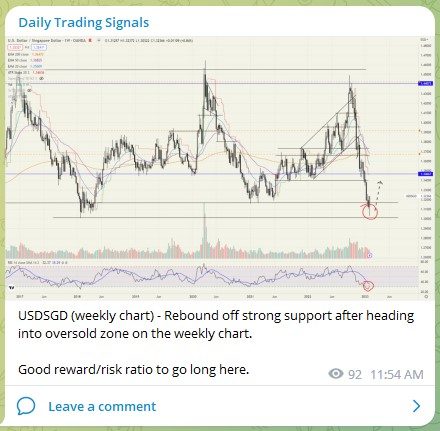
USDSGD – Looking the at the weekly chart, we managed to use the long-term trend to our advantage and go in big on the USD. I accumulated about $500k of USD near the support area.
Let’s see how much higher it can go! 💰🔥💪🏻
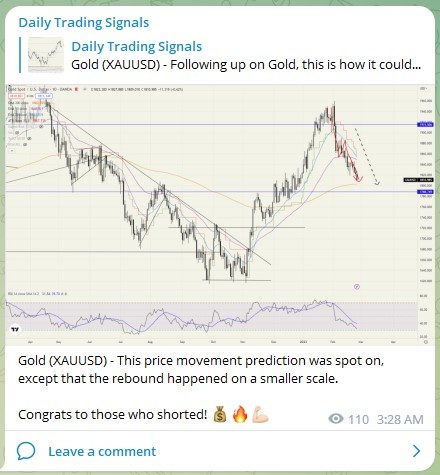
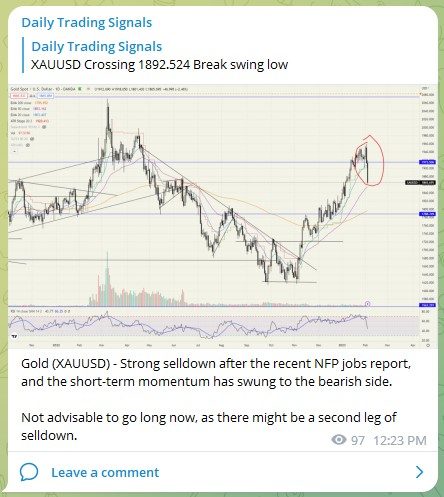
Gold (XAUUSD) – This price movement prediction was spot on, except that the rebound happened on a smaller scale.
Congrats to those who shorted! 💰🔥💪🏻

Gold (XAUUSD) – Following up from the video, we mentioned that there is likely to be a rebound this week due to prices being oversold.
Stock & Bond Market Highlights

Based on our latest market poll, there does not seem to be a clear direction, with 39% bullish vs 46% bearish, and 15% neutral.

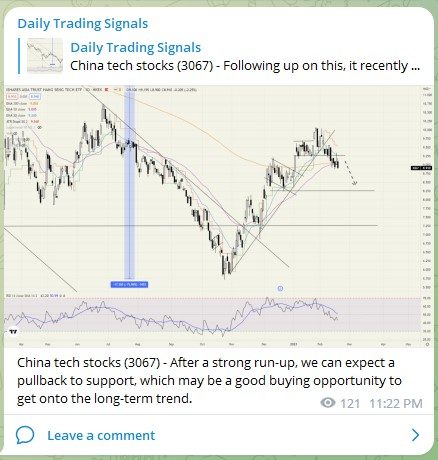
China tech stocks (3067) – Nearing our profit target for short positions! 💰🔥💪🏻
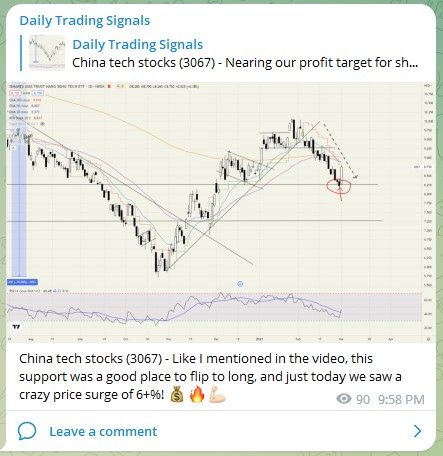
China tech stocks (3067) – Like I mentioned in the video, this support was a good place to flip to long, and just today we saw a crazy price surge of 6+%! 💰🔥💪🏻
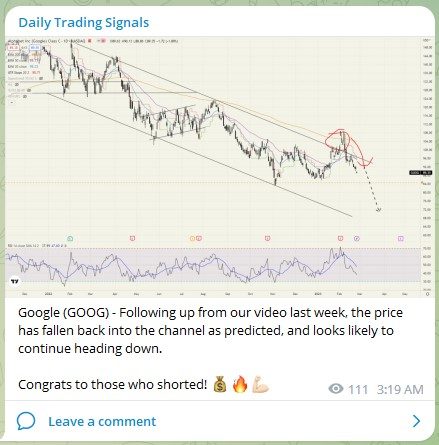
Google (GOOG) – Following up from our video last week, the price has fallen back into the channel as predicted, and looks likely to continue heading down.
Congrats to those who shorted! 💰🔥💪🏻
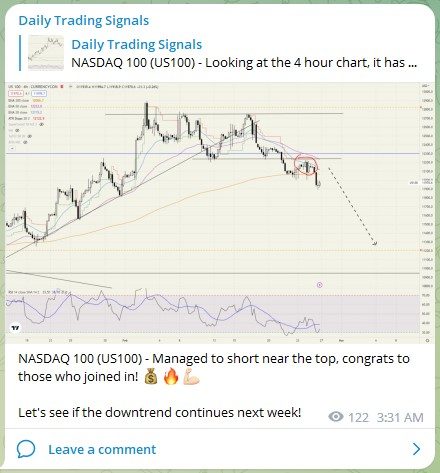
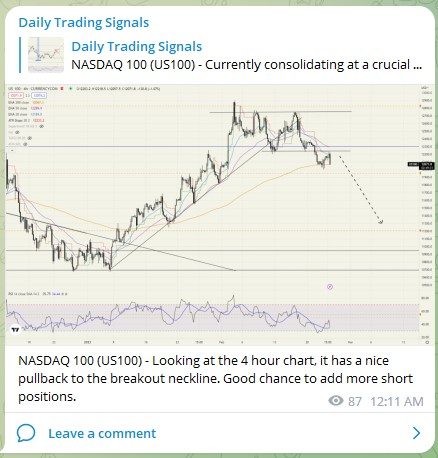
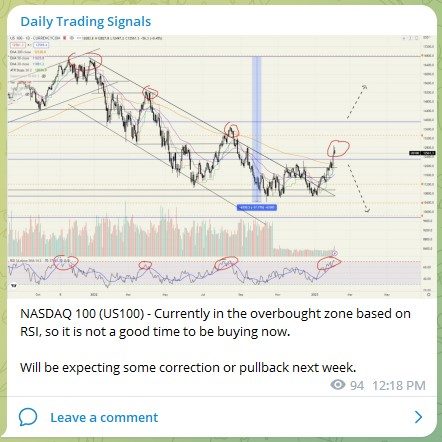
NASDAQ 100 (US100) – Managed to short near the top, congrats to those who joined in! 💰🔥💪🏻
Let’s see if the downtrend continues next week!

Singapore’s inflation is 6.7% 😕

For the first time in a long time, fixed income is more attractive than stocks. 🤩
Good luck, and may next week bring more excellent profits!