• Link to Facebook
  • Link to X
  • Link to Instagram
  • Link to Youtube
  • Link to LinkedIn
  • Link to Mail
Synapse Trading
  • Home
  • About
    • My Background
    • My Trading Journey
    • My Travel Log
    • Media & Interviews
  • Mentoring
    • Trading Mastery Program
    • Results & Testimonials
  • Signals
    • Telegram (Free to join!)
    • Daily Trading Signals
    • Daily Trading Signals (Results)
  • Resources
    • Free Trading Guides
    • Tools & Resources
    • Blog & Infographics
  • Contact
    • Contact Us
    • Partnership Opportunities
  • Click to open the search input field Click to open the search input field Search
  • Menu Menu
Spencer Li

Weekly Market Wrap: Market Rebound is Currently Overbought?

Market Analysis
Fann Mountains Tajikistan

The United States is considering sanctions on Chinese firms for their involvement in Iran’s surveillance buildup.

Despite international sanctions, Chinese state-owned companies have been shipping navigation equipment and jamming technology to Russian government-owned companies.

The United States and Brazil are joining India’s efforts to increase demand for biofuels.

Elon Musk was found not liable in a trial over his tweets about taking Tesla private, and the Federal Trade Commission is preparing a potential antitrust suit against Amazon.

Disney plans to cut 7,000 jobs and $5.5 billion in costs. Commodity trader Trafigura faces a $577 million loss after uncovering nickel fraud.

Adani plans to repay a $1.1 billion loan, while the United Kingdom’s National Health Service is in crisis due to budget cuts and the impact of Covid-19.

Chinese tech giant Alibaba is working on a rival to OpenAI’s ChatGPT.

Apple is promoting its high-end iPhones and there are signs that a stronger rebound in China will boost oil prices.

Stay tuned for more real-time updates in our “Daily Trading Signals” Telegram channel!


Fann Mountains Tajikistan

[Photo: Fann Mountains, Tajikistan – See my full travel photo log!]

For our weekly market wrap, we go through some of the trade calls and analysis from last week, which gives us valuable insights for the week ahead.

We cover 3 main markets with a total of 200+ counters, so we will never run out of trading opportunities:

  • Forex, CFDs, commodities, bonds
  • US stocks, ETFs, global stock indices
  • Cryptocurrencies, crypto indices

By covering a broad range of markets, we can focus our attention (and capital) on whichever market currently gives the best returns.

Click here to receive all these signals in real-time for only $67 a month! You will get several signals a day, and even taking just 1 trade the whole month can easily cover the fee, so what are you waiting for?


Weekly Market Outlook Video

Trading Signals Weekly Market outlook 070223

Weekly Market Outlook (05 February 2023)

Explained more about the 4 main data points:
📌 Interest rates (FOMC)
📌 Jobs data (NFP)
📌 Inflation (CPI)
📌 Company earnings


Portfolio Highlights

Trading Signals Weekly Portfolio 060223

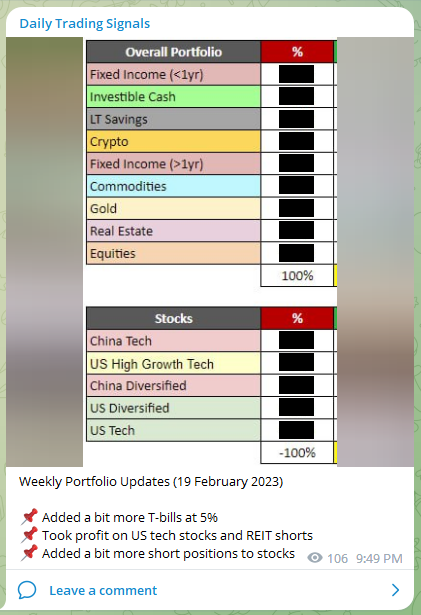
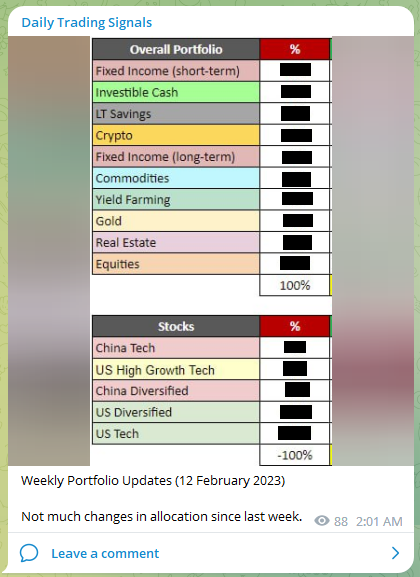
Weekly Portfolio Updates (05 February 2023)

Added the breakdown for stocks.

Positive numbers are net long and negative numbers are net short. I have a mix of both to provide some hedging.


Forex & Commodities Market Highlights

Trading Signals AUDCAD 050223

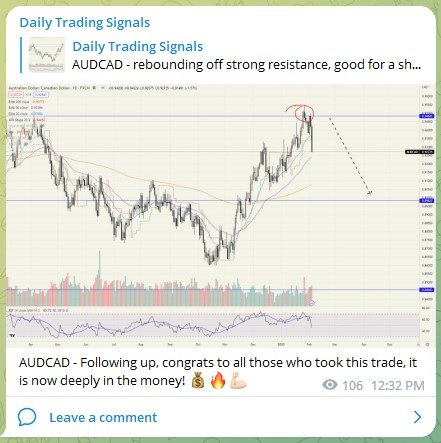
AUDCAD – Following up, congrats to all those who took this trade, it is now deeply in the money! 💰🔥💪🏻


Trading Signals CADJPY 060223

CADJPY – Watch to see if any setups develop here.


Trading Signals CHFJPY 060223

CHFJPY – Watch to see if any setups develop here.


Trading Signals USDSGD 050223

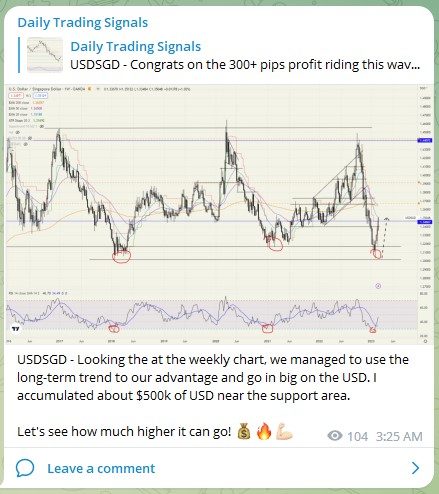
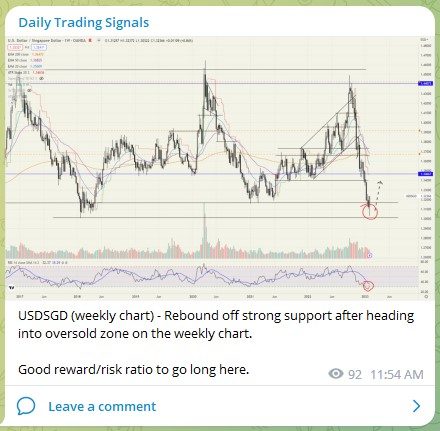
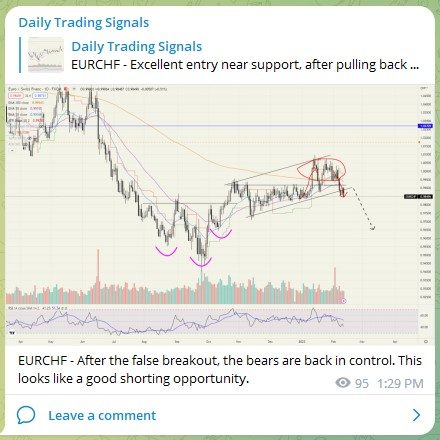
USDSGD (weekly chart) – Rebound off strong support after heading into oversold zone on the weekly chart.

Good reward/risk ratio to go long here.


Trading Signals XAUUSD 050223

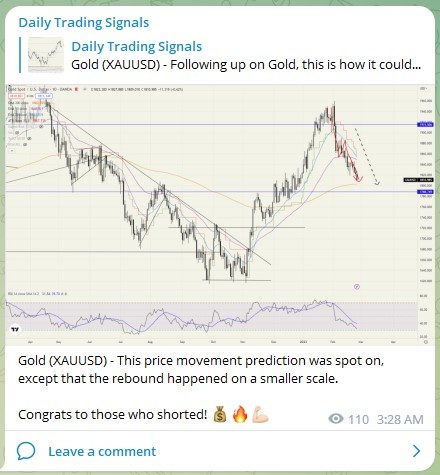
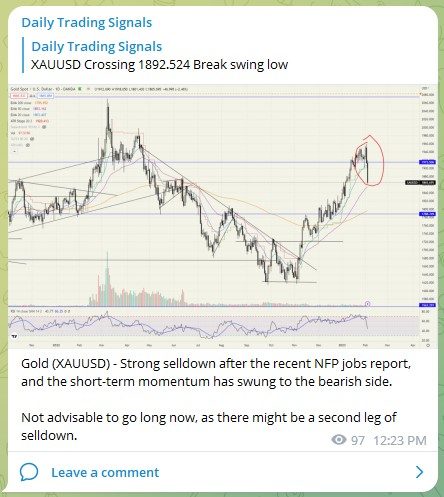
Gold (XAUUSD) – Strong selldown after the recent NFP jobs report, and the short-term momentum has swung to the bearish side.

Not advisable to go long now, as there might be a second leg of selldown.


Stock & Bond Market Highlights

Trading Signals AAPL 070223

Apple (AAPL) – After its poor earnings last week, the fundamentals show a decline in revenue for the first time in many years.

Can consider taking a medium/long-term short position and scale in.


Trading Signals NASDAQ 050223

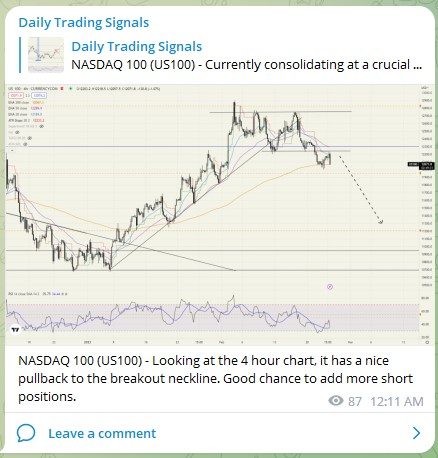
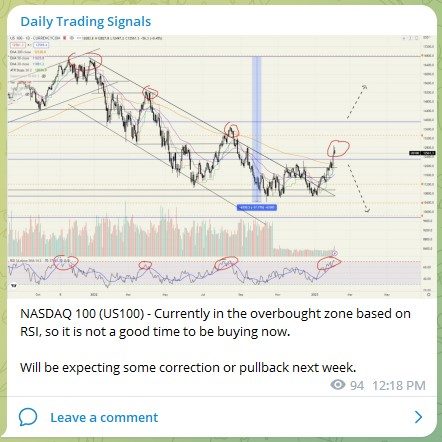
NASDAQ 100 (US100) – Currently in the overbought zone based on RSI, so it is not a good time to be buying now.

Will be expecting some correction or pullback next week.


Trading Signals Inflation Forecast 090223

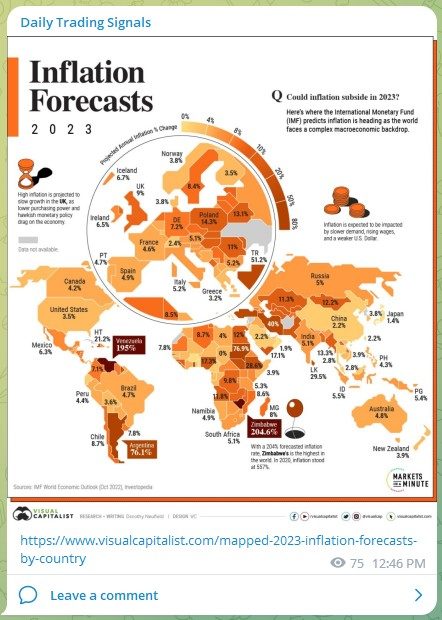
Inflation Forecasts 2023


Trading Signals Market Regime 090223

The chart above shows the TMC’s Market Regime Scrutinizer.

It measures the market-implied odds assigned to a US recession, soft landing or strong growth regime ahead.
It is derived by scrutinizing option markets in fixed income, equity, and currencies and blending the resulting market-implied probabilities in this flagship TMC indicator.


Trading Signals marketwatch 090223

Look for stocks to lose 30% from here, says strategist David Rosenberg. And don’t even think about turning bullish until 2024.


Click here to receive all these signals in real-time for only $67 a month! You will get several signals a day, and even taking just 1 trade the whole month can easily cover the fee, so what are you waiting for?

Good luck, and may next week bring more excellent profits!

0 Comments/by Spencer Li
https://synapsetrading.com/wp-content/uploads/2023/02/Fann-Mountains-Tajikistan.jpg 1536 2048 Spencer Li https://synapsetrading.com/wp-content/uploads/2019/10/logo.jpg Spencer Li2023-02-10 11:53:412023-02-24 20:34:17Weekly Market Wrap: Market Rebound is Currently Overbought?
Spencer Li

The Different Types of Oil Products & What Affects their Prices?

Economics & News Trading
Thumbnail The Different Types of Oil Products What Affects their Prices

Oil Products and Oil Prices: What Moves the Oil Market (and How to Trade It)

Last updated: 3 July 2026 · By Spencer Li, CFTe


Oil prices move because oil is priced by global supply and demand, and a short list of forces keeps shifting both sides of that balance: OPEC production decisions, geopolitical events, economic growth, government policies, inventory levels, natural disasters, and the U.S. dollar. When supply falls or demand rises, prices go up. When supply floods or demand collapses, prices fall. “Oil” is not one thing either. It trades as several regional benchmarks (Brent, WTI, Dubai, Urals, Oman, Tapis), and you can get exposure through futures, options, ETFs, OTC derivatives, and oil-linked bonds and notes. OPEC matters because its members together pump roughly 40% of the world’s oil, so when they cut or raise output, the whole market feels it.

Here is the full picture: the oil products you can trade, the financial products that give you exposure, what OPEC actually does, and the seven factors that move price, each with a real historical example.

What are the different oil products?

There are several types of crude that trade as benchmarks in global markets. Each is priced a little differently because of its density (light or heavy), its sulfur content (sweet means low-sulfur, sour means high-sulfur), and where it is produced. Lighter, sweeter crude is cheaper to refine, so it usually commands a higher price.

BenchmarkTypeSourceUsed to price
Brent CrudeLight, sweetNorth SeaAbout two-thirds of the world’s internationally traded crude
WTI (West Texas Intermediate)Light, sweetUnited StatesCrude oil in North America
Dubai CrudeLight, sourUnited Arab EmiratesCrude oil in the Asian market
Urals CrudeHeavy, sourRussiaCrude oil in Europe
Oman CrudeMedium, sourOmanCrude oil in the Middle East
Tapis CrudeLight, sweetMalaysiaCrude oil in the Asia-Pacific region

These are some of the most widely traded grades, and their prices are often used as a benchmark to price other types of crude. Brent and WTI are the two you will see quoted most. The specific characteristics of each grade (density, sulfur content, refining cost) drive its price and demand.

What are the financial products for trading oil?

You do not need a tanker to get exposure to oil. Several financial products track or hedge the oil price:

  • Futures contracts. Agreements to buy or sell a set quantity of oil at a fixed price on a future date. These trade on exchanges such as the New York Mercantile Exchange (NYMEX) and the Intercontinental Exchange (ICE).
  • Options contracts. Similar to futures, but the buyer gets the right, not the obligation, to buy or sell oil at a set price on a future date.
  • Exchange-Traded Funds (ETFs). Investment products that track the oil price by holding a basket of related securities, giving you exposure without owning the physical commodity.
  • Over-the-Counter (OTC) derivatives. Customized contracts negotiated privately between two parties, not traded on an exchange. Big oil companies and financial institutions use these to hedge against price moves.
  • Commodity-linked bonds. Bonds issued by oil companies or governments, linked to the oil price, giving exposure through a debt instrument.
  • Oil-linked exchange-traded notes (ETNs). Debt securities that track the oil price.

These let individuals and institutions get exposure to oil, or hedge against price swings. Do note that, each product carries its own terms, conditions, and risks. Understand them before you put money in. A futures contract and an ETF can both be “long oil” and behave very differently over the same month.

What is OPEC and what role does it play?

OPEC stands for the Organization of the Petroleum Exporting Countries. It is a group of oil-producing nations, including Saudi Arabia, Venezuela, Iran, and Iraq, founded in 1960 and headquartered in Vienna, Austria. (Membership has shifted over the years, so check the current count when you read this.)

OPEC’s job is to coordinate and unify its members’ oil production and sales policies. The aim is to regulate supply, keep prices stable, and ensure a fair return for oil-producing countries.

Here is why it matters to price. OPEC members together produce about 40% of the world’s oil, so by coordinating their output they can move global supply, and therefore price. If OPEC agrees to cut production, supply drops and prices tend to rise. If it agrees to raise production, supply grows and prices tend to fall. Those decisions ripple through the global economy and the budgets of every country that imports oil, which is exactly why OPEC’s meetings draw so much attention, and so much criticism.

Which factors affect oil prices?

Several forces move the oil price. Most of them work by changing one side of the supply-and-demand balance. Here they are, each paired with a real historical example of it in action.

FactorHow it moves priceReal example
Supply and demandHigh demand plus low supply lifts price; the reverse drops itThe 2008 global financial crisis crushed demand while supply stayed high, and the oil price fell sharply
Geopolitical eventsConflict in producing regions disrupts supply and spikes priceThe 1990 Gulf War disrupted Middle East production and transport, pushing prices sharply higher
Economic growthGrowing economies burn more oil, lifting demand and priceChina’s rapid growth in the early 2000s drove up oil demand and price
Government policiesTaxes, subsidies, and sanctions shift supply or demandThe 2018 sanctions on Iran cut its oil supply and pushed prices up
Inventory levelsHigh storage means lower prices; low storage means higherThe 2020 COVID-19 demand collapse filled storage, and the oil price dropped
Natural disastersStorms and quakes disrupt production and transport, spiking priceHurricane Harvey in 2017 hit Gulf of Mexico production, spiking prices
Currency exchange ratesOil is priced in U.S. dollars, so a weaker dollar tends to lift the priceThe early-2000s dollar depreciation raised the oil price for non-dollar buyers

A pattern worth noticing in those examples: every price move also moved the traders. A supply disruption did not just raise price, it pulled in speculators buying futures in anticipation of more upside. A demand collapse did not just lower price, it triggered selling as traders cut their oil exposure. Price moves the fundamentals, and the fundamentals move the crowd, and the crowd moves price again. That feedback loop is most of what you are actually trading.

Keep in mind this is not the complete list. The oil market is complex, and plenty of other forces, internal and external, feed into the price.

How do you actually trade oil with all this going on?

Honestly, you do not need to forecast OPEC’s next meeting or model the dollar to trade oil well. That is the trap most beginners fall into. They try to out-analyze the entire energy complex, freeze, and never take a trade.

Personally, I trade oil the same way I trade everything else: as a chart. All of these factors, supply, demand, OPEC, the dollar, the next hurricane, are already being priced in by the market in real time, and they show up as the structure on the chart. My job is not to predict the news. My job is to read what price is doing, find a low-risk entry, size it properly, and manage the risk if I am wrong.

Here is where the human edge comes in. An AI or a news feed can summarize every oil factor above for you in a second. That part is now free. What it will not do is tell you that the fundamentals are screaming “buy” while the chart is quietly rolling over, or stop you from over-sizing a volatile commodity because the story felt so convincing. The information is the easy part. The judgment to act on it, or to stand aside, is the part worth learning, and it is the first of the Five Edges an algorithm cannot trade for you.

FAQ

What is the difference between Brent and WTI crude oil?
Both are light, sweet crude oils used as benchmarks, but Brent is extracted from the North Sea and prices about two-thirds of the world’s internationally traded crude, while WTI (West Texas Intermediate) is produced in the United States and is the benchmark for North American crude.

Why do oil prices change every day?
Because oil is priced by global supply and demand, and a handful of forces keep shifting both sides: OPEC production decisions, geopolitical events, economic growth, government policies, inventory levels, natural disasters, and the strength of the U.S. dollar.

How does OPEC affect oil prices?
OPEC members together produce about 40% of the world’s oil, so when they coordinate to cut production, supply drops and prices tend to rise, and when they raise production, supply grows and prices tend to fall.

How can I invest in or trade oil?
You can get exposure through futures contracts, options, oil ETFs, OTC derivatives, commodity-linked bonds, and oil-linked ETNs. Each tracks the oil price differently and carries its own risks, so understand the product before you commit.

Does a weaker U.S. dollar raise oil prices?
Generally yes. Oil is priced in U.S. dollars, so when the dollar weakens, oil becomes cheaper for buyers using other currencies, which tends to lift demand and the price.


So, will you consider adding an oil product to your portfolio, and how do you think the rise of renewable energy will reshape the oil market in the years ahead? Let me know in the comments.

And if you want the broader picture of how commodities fit alongside stocks, forex, and bonds, read the pillar: The Beginner’s Guide to Commodity Trading.

Want a simple way to trade any market, including oil? Grab the free 15-Minute Swing Trading Starter Kit. It’s the exact routine I use to scan once a day and trade any market in 15 minutes.


About the author. Spencer Li is the founder of Synapse Trading and a Certified Financial Technician (CFTe) with 15 years of trading across stocks, forex, crypto, commodities, and bonds. His trade log is public, 404 trades, losses left in. He teaches low-risk swing trading in 15 minutes a day, one system for any market.

Education, not financial advice. Synapse Trading is not licensed by MAS to advise on investment products. Trading carries risk of loss; past performance is not indicative of future results.


Related

Beginner’s Guide to Commodity Trading (pillar) · How to trade gold · What is forex trading · Futures vs options

0 Comments/by Spencer Li
https://synapsetrading.com/wp-content/uploads/2023/02/Thumbnail-The-Different-Types-of-Oil-Products-What-Affects-their-Prices.png 720 1280 Spencer Li https://synapsetrading.com/wp-content/uploads/2019/10/logo.jpg Spencer Li2023-02-10 01:27:012026-07-06 02:43:33The Different Types of Oil Products & What Affects their Prices?
Spencer Li

What is Supercore Inflation and How to Trade it?

Economics & News Trading
Thumbnail What is Supercore Inflation

The Federal Reserve in the US is now using “supercore inflation” to guide interest-rate policy.
This narrow measure of inflation comprises the prices of services (e.g. barbers, lawyers, plumbers) excluding housing and energy prices.

The Fed is paying close attention to services as they tend to be driven by the cost of labor, which the Fed can more easily control with interest rates, whereas the price of goods are more affected by global factors.

The focus on supercore is expected to affect the Fed’s decisions on interest rate increases.

In this blog post, we will delve into the origin, calculation, and key numbers of supercore inflation, and explain how this data is relevant to you as a trader or investor.
 

Infographic What is Supercore Inflation and How to Trade it


What is Supercore Inflation and its Origin?

Supercore inflation is a concept in economics that refers to a persistent increase in the prices of goods and services that are considered necessities for a particular population.

It is often used to describe situations where the prices of essential goods, such as food, healthcare, and housing, increase faster than overall inflation.

The origin of the concept of supercore inflation is not well documented, but it is believed to have emerged in the late 20th century as a way to describe the experience of populations in developing countries who were facing rapid increases in the cost of living, particularly for essential goods and services.

The concept is used to highlight the disproportionate impact of inflation on low-income households and to highlight the need for economic policies that address these issues.

How is the Data Calculated?

The data for supercore inflation is typically calculated by measuring the change in prices of a basket of goods and services that are considered essential for a particular population.

This basket is created based on a survey of household spending patterns and may include items such as food, housing, healthcare, transportation, and education.

The change in the prices of these items is then compared to the overall rate of inflation to determine whether prices are rising faster or slower for essential goods and services.

To calculate supercore inflation, national statistical agencies typically use consumer price indices, which are measures of changes in the prices of a basket of consumer goods and services over time.

The basket of goods and services used in consumer price indices is updated periodically to ensure that it reflects the current spending patterns of households.

The calculation of supercore inflation can also be done by private research institutions, think-tanks or economists, who use the same data sources as national statistical agencies and may use slightly different methodologies to arrive at their results.

The goal of calculating supercore inflation is to provide a more nuanced understanding of the impact of inflation on different segments of the population.

What are the Key Numbers Measured?

In measuring supercore inflation, several specific numbers are typically looked at, including:

  • Personal Consumption Expenditures Price Index (PCE): This measures the prices of goods and services in the US economy.
  • The rate of change in prices of essential goods and services: The rate at which prices of the basket of essential goods and services are increasing or decreasing is an important indicator of supercore inflation.
  • The comparison with overall inflation: The difference between the rate of increase in the prices of essential goods and services and the overall rate of inflation is a key metric in determining supercore inflation. If the rate of increase in the prices of essential goods and services is higher than the overall rate of inflation, it is considered an instance of supercore inflation.
  • The impact on low-income households: The extent to which supercore inflation is affecting low-income households is another key metric. This is often determined by comparing the rate of increase in the prices of essential goods and services for low-income households with the rate of increase for higher-income households.
  • The duration of the increase: The length of time over which the prices of essential goods and services have been increasing faster than overall inflation is another important metric in determining supercore inflation.

By looking at these specific numbers, economists and policymakers can gain a better understanding of the impact of inflation on different segments of the population and can develop policies to address the effects of supercore inflation on low-income households.

How is this Data Relevant to Traders and Investors?

The data on supercore inflation is relevant to traders and investors because it can provide valuable insights into the current state of the economy and can help inform investment decisions.

Understanding trends in supercore inflation can help traders and investors anticipate changes in consumer behavior, interest rates, and monetary policy, which can all have a significant impact on financial markets.

For example, if supercore inflation is rising faster than overall inflation, it can signal that consumers are facing increasing financial pressures and may be more likely to reduce their spending on discretionary items.

This, in turn, can affect the demand for certain goods and services and may lead to changes in their prices.

Investors may also use data on supercore inflation to make decisions about investing in specific industries or sectors.

For example, if supercore inflation is affecting the prices of essential goods such as food, healthcare, and housing, it may be a sign that companies in these industries are poised for growth, and investors may want to consider investing in them.

Furthermore, trends in supercore inflation can also impact interest rates, which can have a significant impact on bond prices.

If supercore inflation is rising, central banks may raise interest rates in an effort to control inflation, which can have a negative impact on bond prices.

Hence, data on supercore inflation can provide traders and investors with valuable insights into the current state of the economy, and they need to be aware of these trends and take them into account when making investment decisions.

News Trading on Supercore Inflation Data

Here are some specific examples of how traders might use each of the data points from the supercore inflation report to make trading decisions:

  • The rate of change in prices of essential goods and services: Traders can use the rate of change in the prices of essential goods and services to assess consumer spending patterns. If the prices of essential goods and services are increasing rapidly, it may signal that consumers are under financial pressure and are reducing their spending on discretionary items, which could negatively impact certain industries or sectors.
  • The comparison with overall inflation: Traders can use the difference between the rate of increase in the prices of essential goods and services and the overall rate of inflation to assess the health of the economy. If the rate of increase in the prices of essential goods and services is higher than the overall rate of inflation, it may signal that the economy is facing challenges and that consumer confidence is declining. This could negatively impact financial markets and lead to a decrease in stock prices.
  • The impact on low-income households: Traders can use the data on the extent to which supercore inflation is affecting low-income households to anticipate changes in consumer behavior. If low-income households are facing increasing financial pressure, they may reduce their spending, which could negatively impact certain industries or sectors. Traders may also use this data to identify potential investment opportunities in companies that serve low-income households, such as food and healthcare companies.
  • The duration of the increase: Traders can use the length of time over which the prices of essential goods and services have been increasing faster than overall inflation to assess the sustainability of the trend. If the trend has been in place for a prolonged period of time, it may signal that the increase in the prices of essential goods and services is likely to persist, which could negatively impact financial markets and lead to a decrease in stock prices.

By understanding the trends in supercore inflation and the factors driving these trends, traders can make more informed investment decisions and maximize their returns.

Concluding Thoughts

In summary, supercore inflation is a valuable data point to keep an eye on if you are a trader or investor.

This narrow measure of inflation, which focuses on the prices of services excluding housing and energy prices, is gaining prominence as the Federal Reserve in the US uses it to guide interest-rate policy.

By tracking trends in supercore inflation, you can gain valuable insights into the current state of the economy, anticipate changes in consumer behavior, interest rates, and monetary policy, and make informed investment decisions.

With its roots tracing back to the late 19th century, supercore inflation is a well-established concept that provides a more nuanced understanding of the impact of inflation on different segments of the population.

Now that I have covered all about the importance of supercore inflation, is it something that you will add to your trading toolbox?

Let me know in the comments below.

0 Comments/by Spencer Li
https://synapsetrading.com/wp-content/uploads/2023/02/Thumbnail-What-is-Supercore-Inflation.png 720 1280 Spencer Li https://synapsetrading.com/wp-content/uploads/2019/10/logo.jpg Spencer Li2023-02-08 18:43:272023-03-28 11:33:48What is Supercore Inflation and How to Trade it?
Spencer Li

What is the CPI (Consumer Price Index) and How to Trade it?

Economics & News Trading
Thumbnail What is the CPI Consumer Price Index

What Is the CPI (Consumer Price Index), and How Do Traders Use It?

Last updated: 3 July 2026 · By Spencer Li, CFTe


The Consumer Price Index (CPI) is a monthly measure of the average change in prices that consumers pay for a fixed basket of goods and services, and it is the number traders watch most closely to read inflation. It is published by a national statistics agency (in the US, the Bureau of Labor Statistics), and the year-over-year change in the CPI is what people mean when they say “the inflation rate.” For traders, the CPI matters for one reason above all others: it shapes what the central bank does with interest rates. A hotter-than-expected CPI tends to push rate expectations up, which usually pressures stocks and bonds. A cooler-than-expected CPI tends to do the opposite. The single most useful number in the report is not the headline figure itself but how it lands versus the forecast, and that is the part most beginners miss.

Here is what the CPI is, how it is built, the numbers inside the report, and how traders actually use it on release day.

What is the CPI, and where did it come from?

The Consumer Price Index measures the average change over time in the prices paid by consumers for a basket of everyday goods and services. Divide this period’s basket price by an earlier period’s, and you get a measure of how much the cost of living has moved. When the index rises, your money buys less. That loss of purchasing power is inflation.

The CPI has been around longer than most people assume. The US Bureau of Labor Statistics (BLS) started collecting price data in the late 19th century. It was formally tasked with calculating the CPI in 1918, and the first official US CPI was published in 1919. Today most countries run their own version, and it remains the standard yardstick for inflation, purchasing power, and the cost of living.

How is the CPI calculated?

The CPI comes from a statistical survey. The agency builds a basket of goods and services meant to represent what a typical household actually buys, then tracks the prices of those items over time. The basket is refreshed periodically as spending habits change, so it does not get stuck measuring things nobody buys anymore.

The calculation runs in five steps:

  1. Select the basket. Choose goods and services that represent typical consumer spending.
  2. Collect price data. Sample prices at regular intervals (usually monthly) from retail outlets, service providers, and rental markets.
  3. Weight the prices. Give each item importance based on how much of the household budget it eats up. Housing carries far more weight than apparel, because people spend far more on it.
  4. Calculate the average. Combine the weighted prices into a single basket price.
  5. Calculate the inflation rate. Compare that basket price across periods. The percentage change is the inflation rate.

Do note that the CPI is only one way to measure inflation. Two others you will see referenced are the Producer Price Index (PPI), which tracks prices at the wholesale/producer level rather than the consumer level, and the GDP Deflator, which covers the whole economy’s output. They tell slightly different stories, which is why a sharp reading often cross-checks them.

What are the key numbers in the CPI report?

The release is not one number. It is a stack of them, and knowing which line moved tells you where the inflation is coming from. Here are the main figures, what each one measures, and why a trader cares.

NumberWhat it measuresWhy a trader watches it
Headline CPIAverage price change across the full basketThe marquee figure; sets the first market reaction
Core CPICPI excluding food and energyStrips out the volatile stuff; central banks lean on this for the underlying trend
Inflation ratePercentage change in CPI over a period (usually year-over-year)The “is inflation rising or cooling” read
Food and beverage indexPrices of food and drinksVolatile component; can swing headline without changing the trend
Energy indexGasoline, electricity, heating oilThe other volatile component; oil shocks show up here first
Housing indexRent, owners’ equivalent rent, shelterThe heaviest-weighted component; slow-moving but dominant
Transportation indexGasoline, motor vehicle insurance, public transitMixes energy and services
Medical care indexHospital, physician, prescription drug pricesA persistent, sticky-services read
Apparel indexClothing and footwearSmall weight; rarely the story

The reason core CPI (the headline number minus food and energy) gets so much attention is that food and energy prices jump around for reasons that have nothing to do with broad inflation, like a cold snap or an oil supply shock. Strip them out and you see the underlying trend more clearly. That is why a central bank, and a sharp trader, will often watch core more closely than the headline.

How do traders and investors use CPI data?

The CPI matters to markets through one main channel: interest rates. Inflation erodes the value of money, so when it runs hot, central banks tend to raise rates to cool it down. Higher rates tend to slow spending and growth, which is generally a headwind for stocks and bonds. When inflation runs cold, central banks can cut rates to encourage spending, which is generally a tailwind.

So traders read the CPI as a clue about the central bank’s next move. Rising, hotter inflation points toward higher rates ahead. Cooling inflation points toward steady or lower rates. From there, traders adjust positioning, lean their bias for stocks and bonds, and decide on the timing and size of trades around the release.

Here is the part that trips up beginners. The market does not react to whether inflation is high or low in absolute terms. It reacts to the number versus what was already expected. A high CPI that everyone forecast is mostly priced in already. The move comes from the surprise, the gap between the actual print and the consensus forecast. This is the one rule to internalize before you ever trade a release.

News trading on CPI: what actually happens at the release

On release day, two figures do most of the work: the headline CPI and the core CPI (excluding food and energy). Traders compare both against the consensus forecast and gauge the surprise, then map that to a rate expectation. Here is the simplified cheat sheet.

CPI versus forecastWhat it signalsTypical first reaction
Hotter than expectedInflation is a concern; central bank may hikeRisk-off: stocks and bonds tend to fall
In line with forecastStory unchanged; surprise is smallMuted; the move is usually small
Cooler than expectedInflation easing; central bank may hold or cutRisk-on: stocks and bonds tend to rise

Personally, I do not trade the first violent seconds of a CPI print, and I would gently steer a new trader away from it too. The spreads blow out, the initial spike often reverses, and you are competing with machines that read the number in milliseconds. The cleaner edge is in the hours and days after, once the market has digested the surprise and a real direction settles in. The release is the catalyst. Your job is to trade the move it sets up, not to outrace an algorithm to the headline.

This is where the human edge lives. A data feed will deliver the CPI number to a thousand traders at the exact same instant, and a bot will price the surprise before you have finished reading the second decimal. What the feed will not do is tell you to sit on your hands through the first whipsaw, size the trade for a volatile release, or skip the day entirely because the surprise was too small to bother with. The number is free. The judgment about whether to act on it is the part worth learning, and it is the first of the Five Edges no algorithm can trade for you.

Should you add the CPI to your trading toolbox?

For most traders, yes, but as context rather than a trigger. The CPI is one of the cleanest reads you have on inflation and, by extension, on what the central bank is likely to do next. Even if you never trade the release itself, knowing whether inflation is running hot or cooling helps you understand why the market is doing what it is doing. That context is worth far more than chasing one volatile number once a month.

FAQ

What is the CPI in simple terms?
The Consumer Price Index measures the average change in the prices of a basket of everyday goods and services that consumers buy. The year-over-year change in the CPI is what people call the inflation rate.

Why does the CPI move the stock market?
Because it shapes interest-rate expectations. A hotter-than-expected CPI raises the odds of rate hikes, which tends to pressure stocks and bonds. A cooler-than-expected CPI does the opposite. The reaction comes from the surprise versus forecast, not the absolute number.

What is the difference between headline CPI and core CPI?
Headline CPI covers the full basket. Core CPI excludes food and energy, which are volatile and can swing the headline for reasons unrelated to broad inflation. Central banks lean on core to read the underlying trend.

Is the CPI the same as the inflation rate?
Not quite. The CPI is the index (a price level). The inflation rate is the percentage change in that index over a period, usually a year. The inflation rate is derived from the CPI.

How is the CPI different from the PPI?
The CPI measures prices at the consumer level. The Producer Price Index (PPI) measures prices at the producer or wholesale level, earlier in the supply chain. PPI moves can sometimes hint at where CPI is heading.


So, is the CPI something you will add to your own trading toolbox, or do you prefer to stay out of the way on release day? Let me know in the comments.

And if you want the full framework for trading scheduled economic releases, read the pillar: The Trader’s Guide to News and Economic-Data Trading.

Want a system that does not depend on calling the next CPI? Grab the free 15-Minute Swing Trading Starter Kit. It is the exact routine I use to scan once a day and trade any market in 15 minutes, no economic-calendar gambling required.


About the author. Spencer Li is the founder of Synapse Trading and a Certified Financial Technician (CFTe) with 15 years of trading across stocks, forex, crypto, commodities, and bonds. His trade log is public, 404 trades, losses left in. He teaches low-risk swing trading in 15 minutes a day, one system for any market.

Education, not financial advice. Synapse Trading is not licensed by MAS to advise on investment products. Trading carries risk of loss; past performance is not indicative of future results.


Related

The Trader’s Guide to News and Economic-Data Trading (pillar) · How to trade the NFP (Non-Farm Payrolls) report · Understanding interest rates and central banks

0 Comments/by Spencer Li
https://synapsetrading.com/wp-content/uploads/2023/02/Thumbnail-What-is-the-CPI-Consumer-Price-Index.png 720 1280 Spencer Li https://synapsetrading.com/wp-content/uploads/2019/10/logo.jpg Spencer Li2023-02-08 18:25:132026-07-06 01:03:16What is the CPI (Consumer Price Index) and How to Trade it?
Spencer Li

Weekly Market Wrap: Rate Hikes, Big Tech Earnings, Crypto Surge!

Market Analysis
Bukhara Uzbekistan

In last week’s NFP (non-farm payroll) report, the US added 517,000 jobs in January, higher than expected and pushing the unemployment rate down to 3.4%, its lowest since 1969.

Job growth was revised higher for November and December, adding an additional 71,000 jobs.

The strong job growth may not be welcomed by the Federal Reserve, which is looking to slow job gains and wage growth to reduce inflation and pause its interest rate hike campaign.

The Federal Reserve raised its interest rate target by 0.25% last week, and plans to continue raising rates with the aim of bringing inflation down to 2%.

However, investors believe the Fed may cut rates back to current levels by the end of next year.

The recent surge in crypto saw a rebound in Bitcoin and Ether by 51% and 47% respectively.

The shift in trading patterns shows a pullback from retail investors and a rise in the influence of institutions such as hedge funds.

The Big Tech Earnings Season saw a decline in revenue growth compared to 2021 with combined growth of only 7% for Apple, Amazon, Alphabet, Microsoft, and Facebook, compared to 28% in 2021.

The companies are engaged in significant headcount reductions, costing more than 50,000 jobs.

The time for a correction or pullback may be as soon as next week.

Stay tuned for more real-time updates in our “Daily Trading Signals” Telegram channel!


Bukhara Uzbekistan

[Photo: Bukhara, Uzbekistan – See my full travel photo log!]

For our weekly market wrap, we go through some of the trade calls and analysis from last week, which gives us valuable insights for the week ahead.

We cover 3 main markets with a total of 200+ counters, so we will never run out of trading opportunities:

  • Forex, CFDs, commodities, bonds
  • US stocks, ETFs, global stock indices
  • Cryptocurrencies, crypto indices

By covering a broad range of markets, we can focus our attention (and capital) on whichever market currently gives the best returns.

Click here to receive all these signals in real-time for only $67 a month! You will get several signals a day, and even taking just 1 trade the whole month can easily cover the fee, so what are you waiting for?


Weekly Market Outlook Video

Trading Signals Weekly Market Outlook 010223

Weekly Market Outlook (29 January 2023)

📌 Wednesday: FOMC
📌 Friday: NFP


Portfolio Highlights

Trading Signals weekly portfolio updates 310123

Weekly Portfolio Updates (29 January 2023)

Not much changes, since the market has not moved much.


Forex & Commodities Market Highlights

Trading Signals AUDCAD 020223

AUDCAD – rebounding off strong resistance, good for a short trade with SL above the prior swing high.


Trading Signals AUDCHF 020223

AUDCHF – Also another short trade after running into strong resistance.


Stock & Bond Market Highlights

Trading Signals stock comparison 020223 1

Stock sector comparisons for 2022


Trading Signals fed rates 020223

The Federal Reserve raised rates. Chair Powell says it’s ‘premature’ to declare victory against inflation.


Trading Signals us inflation 310123

In 2007. the Fed and major banks were predicting a soft landing. We all know how that turned out. Will this time be different?


Trading Signals US job 020223

Wow quite a large deviation from expectations!

Wonder if this will lead to a more aggressive stance on rate hikes.


Trading Signals US treasuries 020223

Traders have never been this bearish on Treasuries.


Crypto Market Highlights

Trading Signals ETHUSD 020223

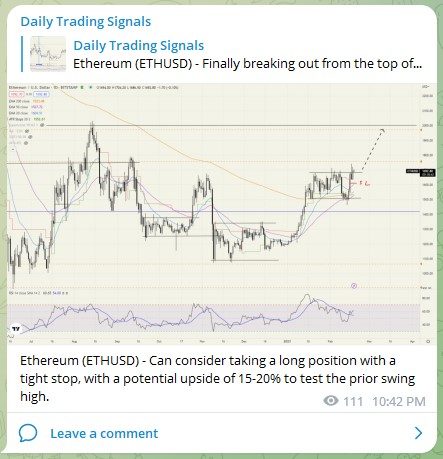
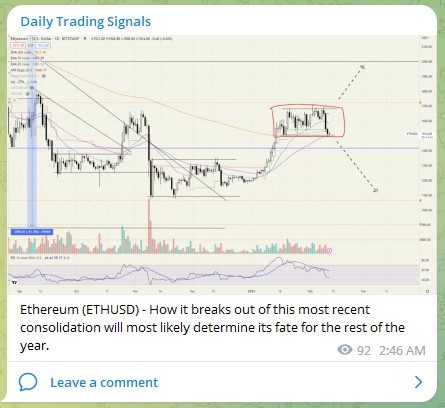
ETHUSD Crossing 1694.81
Break swing high

(Charts posted in Telegram channel)


Click here to receive all these signals in real-time for only $67 a month! You will get several signals a day, and even taking just 1 trade the whole month can easily cover the fee, so what are you waiting for?

Good luck, and may next week bring more excellent profits!


0 Comments/by Spencer Li
https://synapsetrading.com/wp-content/uploads/2023/02/Bukhara-Uzbekistan.jpg 1536 2048 Spencer Li https://synapsetrading.com/wp-content/uploads/2019/10/logo.jpg Spencer Li2023-02-04 09:44:572023-02-24 20:34:12Weekly Market Wrap: Rate Hikes, Big Tech Earnings, Crypto Surge!
Page 45 of 184«‹4344454647›»

Free Trading Guides

Free Trading Guides

Blog Categories

  • Beginner's Guide
  • Blockchain & Crypto
  • Book Summaries
  • Candlestick Patterns
  • Economics & News Trading
  • Investing & Portfolio Management
  • Living Your Best Life
  • Market Analysis
  • News & Events
  • Price Chart Patterns
  • Promotions
  • Risk & Money Management
  • Stock Trading
  • Testimonials
  • Tools & Resources
  • Trading Psychology
  • Trading Strategies
  • Trading Tips
  • Travel & Lifestyle

Free Trading Guides

Free Trading Guides

Contact Us

Synapse Trading Pte Ltd
Registration No. 201316168H

Whatsapp: +65-8897-1204
Telegram: @iamrecneps
Email: info@synapsetrading.com

Links

Disclaimer
Privacy policy
Terms & Conditions
Contact us
Partnerships

© 2012-2024 Synapse Trading | All rights reserved | - powered by Enfold WordPress Theme
  • Link to Facebook
  • Link to X
  • Link to Instagram
  • Link to Youtube
  • Link to LinkedIn
  • Link to Mail
Scroll to top Scroll to top Scroll to top