

Japanese Candlestick Charting Techniques Summary: Steve Nison’s Patterns and the Rule Behind Them
Want the daily routine? Get the free 15-Minute Swing Trader’s Checklist. Get it free →
The key patterns from the 1991 book that brought candlesticks west, what each one really signals, and the confluence rule that makes them worth trading
Published: 24 October 2026 · Last updated: 24 October 2026 · By Spencer Li, CFTe
What is Japanese Candlestick Charting Techniques about? Steve Nison’s 1991 book teaches you to read the candlestick chart. Part 1 is a dictionary of patterns: the hammer, the engulfing pattern, the stars, the doji and the windows. Part 2 is the method. A candle signal, Nison argues, gets far stronger when other tools point to the same price.
He is honest about the limits too. Candles give no price targets, and in his words they “will not provide an infallible trading tool.” This summary covers the patterns, the rule behind them, and how to use both in 15 minutes a day.
Who is Steve Nison?
Nison came from the futures markets, and his route into candles started with one word. In 1987 he got to know a Japanese broker. One day in her office she was looking through a Japanese chart book, and she said, “look, a window.” A window, she told him, was the Japanese name for a gap. Then she used words like “doji” and “dark-cloud cover”, and as he put it, “I was hooked.”
The first English booklet he found had just ten pages on candles, so he spent years drawing the charts himself. This book, published in 1991 by the New York Institute of Finance, is the result.
What is the overview of the book?
The book opens in old Osaka, where the rice trade grew into a futures market. Nison writes that the Dojima Rice Exchange’s rice receipts “became the first futures contracts ever traded.” In 1749, Osaka traded 110,000 bales of rice coupons, while all of Japan held only 30,000 bales of actual rice. That is more than 3 bales of paper per real one, a lot of rice nobody could eat.
Then Part 1 builds the candle and its patterns, and Part 2 pairs them with Western tools such as trendlines, moving averages and oscillators.
How do you read a candlestick?
A candle uses the same four prices as a bar chart. The thick real body spans the open to the close, white when the close is higher and black when it is lower. The thin shadows mark the high and the low.
So why make the body the main character? The Japanese, Nison says, “place great emphasis on the relationship between the open and close because they are the two most emotionally charged points of the trading day.” A long white body tells you the buyers ran the session. A tiny body with long shadows tells you nobody won.
What are the 10 key ideas at a glance?
| # | The idea | What it means for your trading |
|---|---|---|
| 1 | The open and close carry the emotion | Read the real body first, then the shadows |
| 2 | A “reversal” signal means the trend is likely to change | Protect gains, then wait |
| 3 | Trade reversal signals only with the major trend | A top signal in a bull market says take profits on longs |
| 4 | One candle can mean two things | The same line is a hammer after a fall and a hanging man after a rally |
| 5 | Some candles need confirmation | Wait for the next session after a hanging man or an inverted hammer |
| 6 | Candles can flag turns that bar charts miss | An engulfing pattern can signal a reversal without a new high |
| 7 | Windows (gaps) act as support and resistance | Pullbacks often return to an open window |
| 8 | A doji matters most where doji are rare | Doji also call tops better than bottoms |
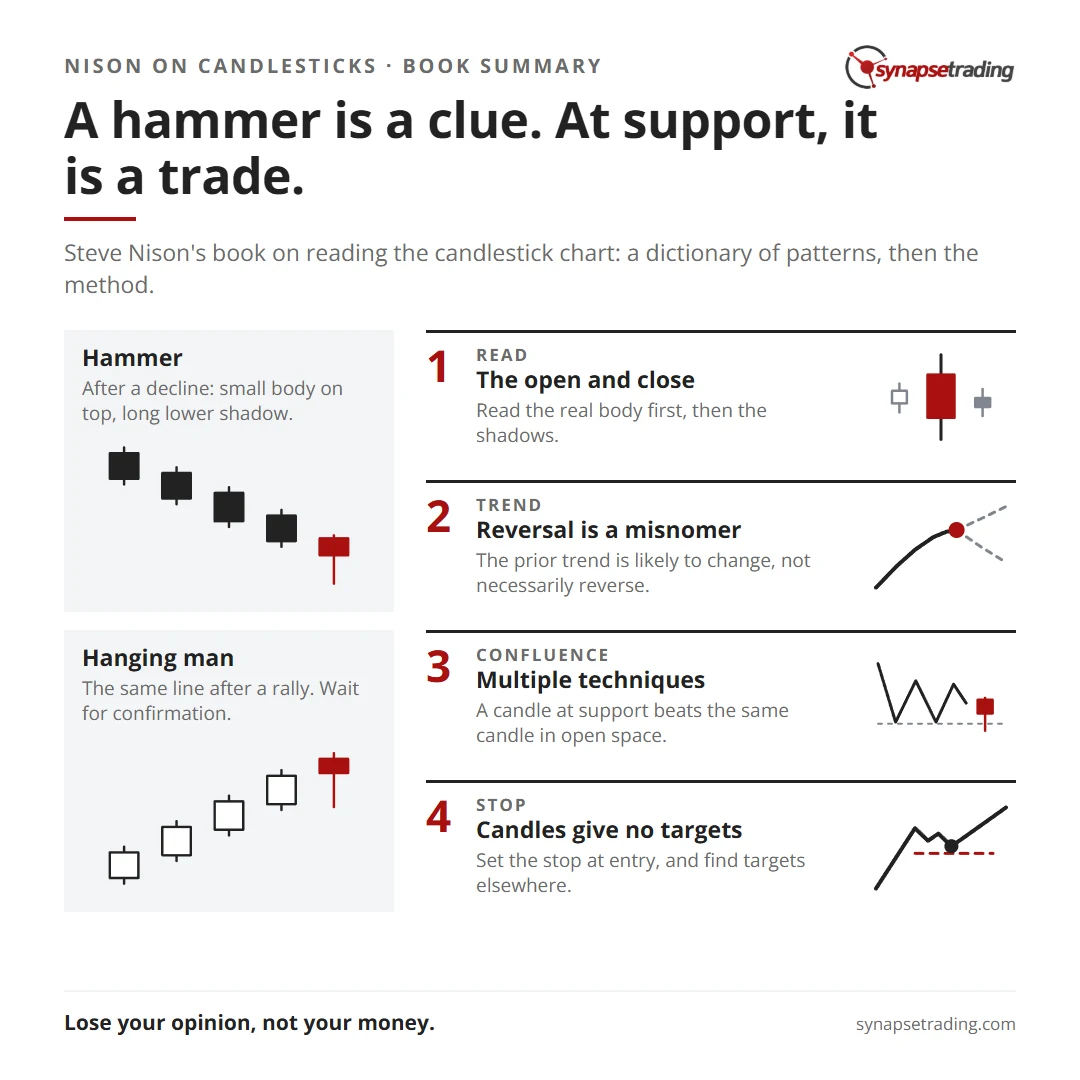
| 9 | Confluence raises the odds | A candle at support beats the same candle in open space |
| 10 | Candles give no targets, and every trade needs a stop | Set the stop at entry, and find targets elsewhere |
Why does Nison call a reversal pattern a misnomer?
This is the idea most readers skip. Nison writes that “the term ‘reversal pattern’ is somewhat of a misnomer.” A trend usually slows down before it turns.
His picture is a car driving forward. “The car’s red brake lights go on and the car stops.” The brake light told you the forward move was ending. It said nothing about whether the car would reverse or drive on again.
So “the prior trend is likely to change, but not necessarily reverse.” His rule follows from it: place a new position off a reversal signal “only if that signal is in the direction of the major trend.” Say a bearish pattern appears in a bull market. That is a reason to take profits on your longs, and a weak reason to sell short.
Which candlestick patterns should you learn first?
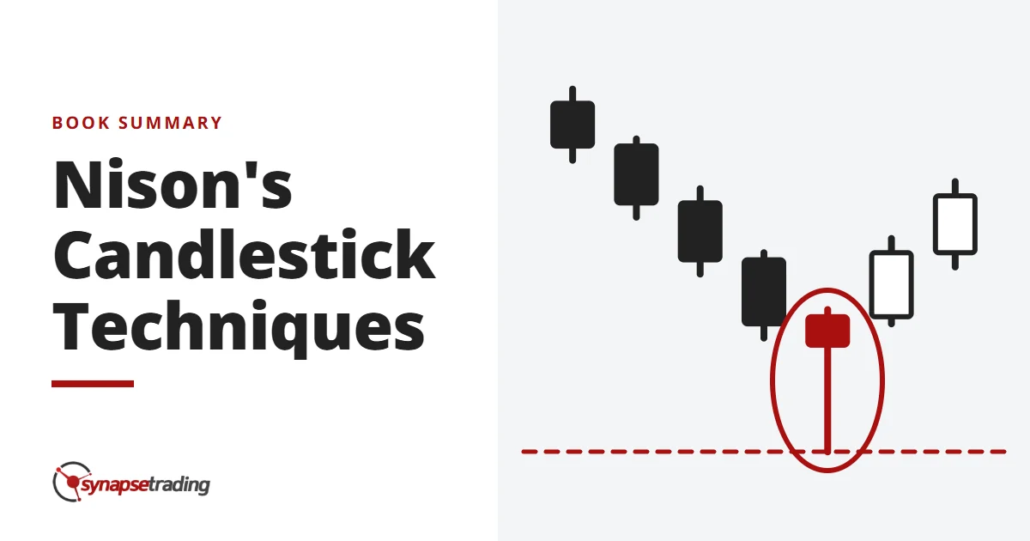
Hammer and hanging man. A small body at the top of the range with a long lower shadow, which “should be at least twice the height of the real body.” After a decline it is a hammer. After a rally the same line is a hanging man, and Nison says “it is especially important that you wait for bearish confirmation.”
Engulfing patterns. A second body wraps around the first, in the opposite colour. A bullish engulfing pattern shows “buying pressure has overwhelmed selling pressure.” Its partial cousins are the dark-cloud cover at a top and the piercing pattern at a bottom.
Stars. A small body gaps away from a long one. The morning star marks a bottom, the evening star a top, and the shooting star warns after a rally.
Harami. A small body inside a long prior body. It works like a brake, and “the market will often come to a lull.” See our bullish harami guide.
Doji and windows. “Doji sessions are important only in markets where there are not many doji.” A window is a gap, and Japanese analysis “asserts that corrections go back to the window”, so it becomes support or resistance. See the rising window and falling window.
The candlestick patterns cheat sheet sorts 50+ patterns by what they tell you.
What is the Rule of Multiple Techniques?
This is the heart of Part 2. Nison borrows the rule from Arthur Sklarew. It “states that the more technical indicators that assemble at the same price area, the greater the chance of an accurate forecast.”
Now imagine two hammers. The first forms near nothing in particular. The second forms at a support level that has held twice before, right at a 50% retracement of the last rally. Same candle. The second one has three reasons behind it, and the first has one.
Our posts on when resistance becomes support and how to combine candlestick patterns with other technical indicators show the pairing in practice.
The free 15-Minute Swing Trader’s Checklist at the end of this post turns that idea into a daily routine.
What does Nison say about stops and being wrong?
A stop “should be placed at the time of the original trade”, he writes, because that is when a trader is “most objective.” Once you are in, “there is no room for hope in the market.” And then: “The one thing worse than being wrong is staying wrong. Lose your opinion, not your money.”
He holds himself to it. “If this activity tells me I am mistaken in my opinion, I adjust to the market. I am not egocentric enough to believe that the market will adjust to me.” The same chapter says to “think of a stop as a cost of doing business.”
Here is the sum that shows why. Say you buy after a confirmed hammer, with the stop just under its low. That distance is 1R, and you risk 1% of your account on it. The nearest resistance is 2.5 times further away, so a win pays 2.5R. Now suppose only 4 trades in 10 work.
4 wins × 2.5R = +10R
6 losses × 1R = −6R
That nets +4R, roughly 4% on the account, from a pattern that failed more often than it worked. Hold the losers past the stop out of hope, and the sum falls apart. Our guide on where to put your stop loss and take profit shows how to place both on structure.
What are the limits of the book?
Candles “do not, however, provide price targets”, so the target has to come from support and resistance or retracements.
A candle also needs a close. “You may have to wait for the close to get a valid trading signal,” and a hammer an hour before the close can still finish as a plain black candle. See why you wait for the candle to close.
And it is a 1991 futures book, so open interest and pit-era notes take up space a stock trader may skim. More in the limitations of candlestick patterns.
Where the human edge comes in
A screener can now flag every hammer across thousands of charts in minutes. That is the cheap part, and Nison keeps asking for the expensive one. On one lumber chart he marks four hammers. Hammers 1 and 3 called bottoms. “Hammer 4 did not work,” because a pattern “should be viewed in the context of the prior price action.” The session before it was a long black candle that opened on its high and closed on its low, and hammer 4 itself broke old support.
A scanner sees four identical shapes. A trader has to ask what came before each one, whether the trend agrees, and whether the stop can be honoured without flinching. That last question is about fear and regret, and it stays with the person pressing the button.
Should you read Japanese Candlestick Charting Techniques?
Yes, if you trade off charts. It sits fourth in the ten books I would give a beginner first, listed in my reading list as “the source on candlesticks, from the man who brought them west.”
Read Part 1 with a chart open, one pattern family at a time, and look for the formations that “work best for that market.” Then read Part 2 slowly, because that is where the patterns become a method. The wider shortlist is in the best investing and trading books of all time.
Concluding thoughts
The book gives you a vocabulary for the emotions on a chart, then tells you never to trust a single word of it alone. A hammer is a clue. A hammer at support, with the trend behind it and a stop under its low, is a trade. For the full library, start with the definitive guide to candlestick patterns.
So the next time a perfect-looking candle shows up on your screen, which other reason is standing at that price?
FAQ
What is the main idea of Japanese Candlestick Charting Techniques?
That a candle signal is most reliable when other tools confirm it at the same price.
Is Steve Nison’s book good for beginners?
Part 1 is. Part 2 assumes you know trendlines, moving averages and oscillators, so it lands better after some practice.
What is the difference between a hammer and a hanging man?
The shape is identical. After a decline it is a bullish hammer. After a rally it is a bearish hanging man, which needs confirmation in the next session.
Go deeper
Nison’s rule is to set the stop when you enter. The free 15-Minute Swing Trader’s Checklist shows how to do that daily: the scan, the questions to ask before you enter, and the rules that keep each loss small. Get it from the form below this post.
About the author. Spencer Li is The 15-Minute Trader and the founder of Synapse Trading. He is a Certified Financial Technician (CFTe) with 15+ years of trading, run from 70+ countries. He holds a B.Acc and B.BM from SMU. Every trade he takes is public, dated, losses left in. He teaches rules-based swing trading in 15 minutes a day, one system for any market.
Educational content only, not personalised financial advice. Trading carries risk, including loss of capital. Past performance is not indicative of future results. Synapse Trading is not licensed or regulated by MAS.
Want the daily routine? Enter your email for the free 15-Minute Swing Trader's Checklist.
Free 5-page PDF, then occasional trading emails. Education only, not financial advice. Unsubscribe anytime. Kit stores your email in the US: see our privacy policy.
Want to learn the full method? The Trading Mastery Program teaches the 4 strategies I have traded since 2011. It suits beginners and experienced traders.
Rather follow the trades as they happen? Daily Trading Signals is our Telegram channel: my trade ideas with entry, stop and exit, and every trade is public.
Questions about this post? Ask in the free Telegram channel →
Educational content only, not personalised financial advice. Trading carries risk, including loss of capital. Past performance is not indicative of future results. Synapse Trading is not licensed or regulated by MAS.
