the 4 main types of trading strategies

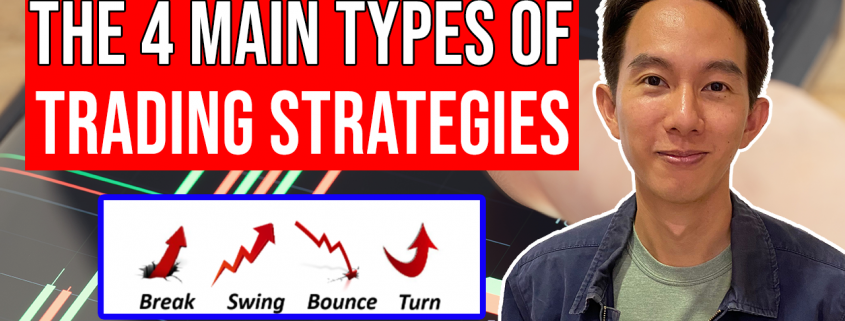
In trading, despite the countless different strategies and setups that are used by traders all over the world, all these strategies can actually be traced back to these 4 core types:

  • Break (trading breakouts)
  • Swing (trend-following)
  • Bounce (counter-trend, mean reversion)
  • Turn (market reversals)

Each strategy type has its pros and cons, so in the future, when someone shares a trading strategy with you, you will instantly be able to see which category that trading strategy falls under, and hence deduce the pros and cons of the strategy.


types of trading strategies

1. Break (Trading Breakouts)

Breakouts happen when the market is in the ranging phase, and there is no clear trend in the market. As both the bulls and bears fight to gain control of the market, at some point either side wins, and prices break out of the sideways range and starts moving explosively in one direction.

2. Swing (Trend-following)

When the market is trending or starting to trend, it makes sense to ride the trend. Trend-following strategies are designed to detect the start of such trends, and get you in on them, as well as getting you out once the trend is over.

3. Bounce (Counter-trend, Mean Reversion)

Occasionally, there might be exceptionally strong short-term movements in the markets, such as a price spike on a news announcement, or a climatic buying or panic selling. When that happens, prices usually become overbought/oversold, and prices will have a rebound back to “normal” levels.

4. Turn (Market Reversals)

All markets and products follow certain large economic or trend cycles, which means that no matter how strong the trend, at some point it will exhaust the move and lead to a change in direction. This usually results in major turning points in the markets.


thumbnail beginner guide to trading and TA

If you would like to learn how to get started in trading, also check out: “The Beginner’s Guide to Trading & Technical Analysis”


The Different Styles of Trading Holding Period Timeframe Products etc

There are 3 main styles of trading, and by styles, I mean the way you approach trading, and this in turn will determine your holding period, timeframe, time commitment, and the products you trade.

Here are the 3 main styles:

  • Short-term
  • Medium-term
  • Long-term

Different Styles of Trading


Short-term Trading

Short-term trading is mainly for people who are doing it full time, and includes day trading (closing all positions by the end of the day) and scalping (taking extremely short-term positions which can last seconds).

Traders will mainly be using 5-minute or 15-minute charts, or even shorter timeframes, so this means that they will need to check their computer screens every few minutes, or stare at it constantly. This can be quite stressful for beginners, hence it is strongly not recommended.

The products traded will tend to be very liquid, have low commissions, and have significant price movements during the course of a day. These include forex, futures, and larger stock markets.

Medium-term Trading

Medium-term trading is the most ideal for part-time traders, as it does not require much monitoring of the markets. It is also known as swing trading, as it captures the “swings” in the markets.

Traders will mainly be using the 4-hour or daily chart, so they will only need to check their charts every few hours or even once a day, making it ideal for people who have full-time jobs and do not want to spend too much time looking at charts.

The products traded will tend to be those more customised to retail traders, such as forex, CFDs, and stock markets that do not have too high transaction costs.

Long-term Trading

Long-term trading is suited for people who do not have any time at all, and this includes position traders and investors who take long-term positions that can last weeks or months.

Traders will mainly be using the daily chart or weekly chart, meaning they will probably only be checking up on their positions weekly, monthly, or even quarterly. This is the most hands-off option, but it also requires a lot of patience, and is not suitable for people with little capital since your capital is going to get locked up for long periods of time.

The products traded will tend to be more asset-based, such as stocks, ETFs, REITs, or other assets which can appreciate over time and pay dividends.


thumbnail beginner guide to trading and TA

If you would like to learn how to get started in trading, also check out: “The Beginner’s Guide to Trading & Technical Analysis”

EXOTIC UNCOMMON TECHNICAL ANALYSIS METHODS

In addition to the mainstream methods used by professionals, you might also come across online some exotic and unorthodox methods:

  • Fibonacci analysis
  • Elliot wave theory
  • Gann theory
  • Harmonic patterns
  • Dow theory
  • Ichimoku Kinko Hyo (Cloud charting)
  • Volume Spread Analysis (VSA)
  • Market profile
  • Pitchfork analysis
  • Point and Figure (P&F)
  • Cycle analysis

Many of these theories were very popular at some point of time in the past, but after the hype died down, or newer methods replaced them, their use was mainly confined to hobbyists or niche bloggers.

I have read and studied all of them previously, so if time permits in the future, I might do some fun guides for some of them.


thumbnail beginner guide to trading and TA

If you would like to learn how to get started in trading, also check out: “The Beginner’s Guide to Trading & Technical Analysis”

the 3 main types of technical analysis

There are 3 main categories of technical analysis methods that are used by all traders:

Since I will be doing separate guides for each of these methods, for now I will be briefly going through each one.


Types of Technical Analysis


1. Classical Charting

These were the very first tools developed by traders, back when there were no computers and charts had to be plotted and analysed manually.

They include things like swing counts, support and resistance levels, trendlines, channels, price patterns, etc.

Even today, most traders still use these methods, usually in conjunction with other methods.

2. Technical Indicators

With the advent of computers, traders started using them to crunch numbers, and by applying mathematical formulas (using the open, high, low, close, volume data) were able to add another dimension of analysis which was not always obvious by visual observation.

There are thousands of indicators, but the common ones used are moving averages, MACD (moving average convergence divergence), RSI (relative strength index), Stochastics, Bollinger Bands, etc.

3. Price Action

Price action is a pretty broad category, but the main idea is to study the movement of price, while understanding the underlying reasons for such moves.

In the past, one such method was tape-reading, which has now evolved to reading the price ladder and order flow. but these are more for intraday traders on very short timeframes. I used to do that when I was trading for funds.

For retail traders, the more common approach is to study candlestick patterns, which is to identify unique clusters of bars, but for more advanced price action, it involves studying every single individual bar.

Most traders will use a combination of all 3 methods, since they are not mutually exclusive. The idea is to find a combination of tools that can enable you to find good trading opportunities with the least amount of effort.


thumbnail beginner guide to trading and TA

If you would like to learn how to get started in trading, also check out: “The Beginner’s Guide to Trading & Technical Analysis”

How to Read Price Bars Candlestick Charts

Now that we have learnt how to read price charts, the next step is for us to zoom in on the individual bars that make up the price charts.

Since these charts are called candlestick charts, the individual bars are called candlestick bars. For convenience, most people will also refer to them simply as price bars.


reading candlestick bars

Each candlestick bar consists of 4 data points:

  • Open – this is the opening price of the bar, which refers to the first transaction which occurred in this time period.
  • Close – this is the closing price of the bar, which refers to the last transaction which occurred in this time period.
  • High – this refers to the highest transaction price which occurred in this time period.
  • Low – this refers to the lowest transaction price which occurred in this time period.

Based on these 4 data points, all candlestick bars will have 2 components:

  • Body – this is the “fat” part of the candle, and its length is determined by the distance between the open and close.
    • White body – If the closing price is higher than the opening price, it means that prices moved up, and it represents bullishness.
    • Black body – If the closing price is lower than the opening price, it means that prices moved down, and it represents bearishness.
  • Shadow – this shadow is the “thin” part of the candle, and represents the extreme moves of prices within the bar.
    • Short shadow – this signals low volatility and less uncertainty.
    • Long shadow – this signals high volatility and more uncertainty.

I will be covering more of this in my price action trading guide, so for now here are some simple rules for analysis.

Bullish factors:

  • A lot of long white bars
  • Short or no shadows on the top of bars
  • Long or no shadows on the bottom of bars

Bearish factors:

  • A lot of long black bars
  • Short or no shadows on the bottom of bars
  • Long or no shadows on the top of bars


thumbnail beginner guide to trading and TA

If you would like to learn how to get started in trading, also check out: “The Beginner’s Guide to Trading & Technical Analysis”