

Monthly Market Wrap (September 2026)
Join our Telegram channel for more market analysis & trading tips: t.me/synapsetrading
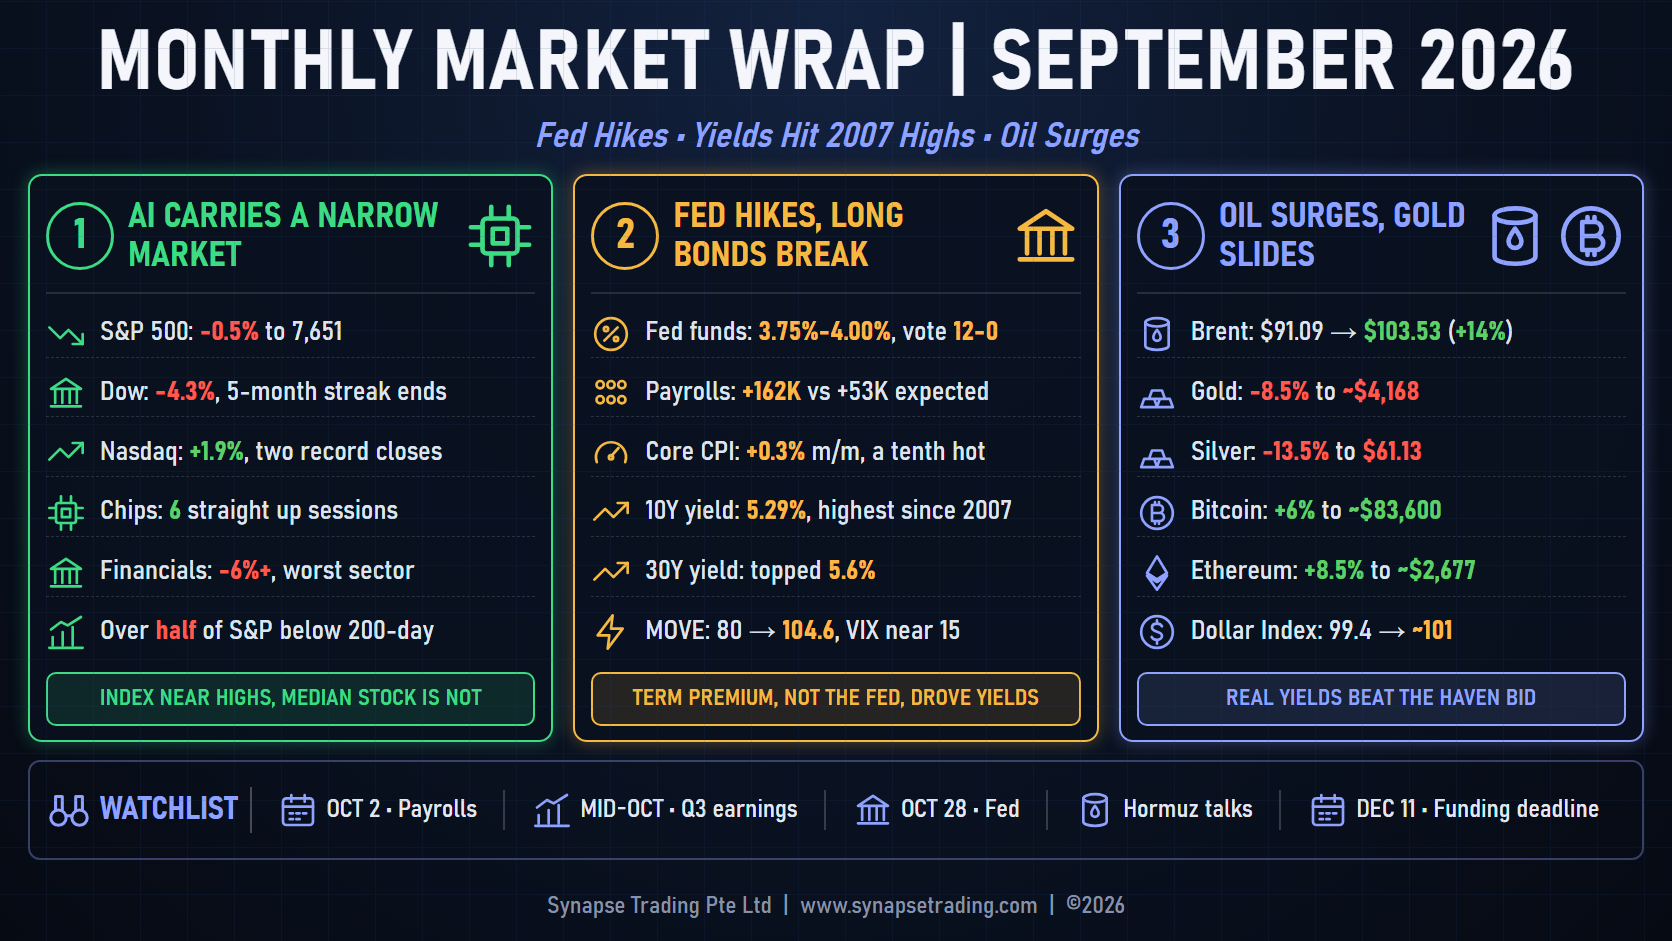
Have you ever watched a central bank raise rates for the first time in three years, the 10-year Treasury yield climb to a level last seen in 2007, oil gain 14%, and the Nasdaq still set a record close? That was September 2026. The S&P 500 slipped about half a percent to 7,651, the Dow fell about 4.3% to end a five-month winning streak, and the Nasdaq added almost 2% with two record closes along the way. Underneath, the Fed hiked to 3.75% to 4.00% on a 12 to 0 vote, the 30-year yield briefly topped 5.6%, gold lost more than 8%, and Bitcoin quietly logged a fourth green September in a row. So let’s go through what actually happened, and what I’m watching into October.
Table of Contents
Table 1: September 2026 in numbers
| Measure | September 2026 |
| S&P 500 | 7,651.54, down about 0.5% |
| Dow Jones | 50,906.05, down about 4.3% |
| Nasdaq Composite | 26,861.06, up almost 1.9% |
| Fed funds rate | 3.75% to 4.00%, the first hike since July 2023 |
| 10-year Treasury yield | 5.29%, the highest since 2007 |
| Brent crude | $103.53, up about 14% |
| Gold | about $4,168 an ounce, down about 8.5% |
| Bitcoin | about $83,600, up about 6% |
Global Stock Market Trends
The month opened on the back foot. US stocks fell four sessions in a row into 10 September, the S&P 500’s longest losing run since March, and the Dow posted its worst first ten days of a September since 2008. On the worst of those days only 12% of stocks closed higher, and for once megacap tech led the decline rather than cushioning it.
Then came the odd part. Hot inflation data on 11 September pushed Fed hike odds to nearly 90%, and the S&P 500 rose 0.9% anyway. Why would stocks rally on a locked-in hike? Because it was already priced, and a day of relief in oil mattered more. The same thing happened on 16 September, the day of the hike itself. The Dow dropped 631 points and the S&P 500 closed at 7,551.81, its low for the month, then took the whole drop back in one session the next day.
From there the AI trade carried everything. On 21 September the Nasdaq Composite jumped 2.26% to 27,122, its first record close since June, with AMD up about 10% to cross $1 trillion in market value, Arm up 17%, Intel up 12% and Meta up 11%. A second record followed at 27,244 the next day, and the semiconductor index rose six sessions straight, its longest run since April. Do note that on the day of that second record, more than half of S&P 500 members still traded below their 200-day moving average. The index was at a high and the median stock was not, and that gap is the most important feature of this market right now.
Leadership rotated almost weekly. On 14 September, after Anthropic’s Dario Amodei published an essay calling for a slower pace of frontier AI development, the semiconductor gauge fell 5.9% while software rallied. A week later chips were setting records again. By sector, financials were the worst of the month, down more than 6%, and technology was the only S&P sector to finish higher. Everything that depends on borrowing costs, from REITs to utilities to small caps, kept making lows while the index held up.
Outside the US it was weaker. Europe’s STOXX 600 fell more than 2%, ending five straight monthly gains. Japan’s Nikkei 225 closed the month at 66,754, a small gain but its first quarterly decline since early 2025. China was the soft spot: the Shanghai Composite fell about 3.6%, the Shenzhen Component about 8% and the Hang Seng roughly 4%.
Macroeconomic and Central Bank Developments
So what did the Fed see that made it move? The labour market stopped cracking. August payrolls, released on 4 September, showed 162,000 jobs added against a forecast of 53,000, the strongest month since March, with unemployment steady at 4.1%. Two days earlier ADP had reported just 38,000 private hires, so the market was braced for weakness and got the opposite. In this cycle a hot jobs print is the hawkish outcome, and that inverted reaction function has defined the whole year.
Inflation did the rest. August producer prices rose 5.4% year on year against 5.3% expected, with the energy component up 24%. Headline CPI then rose 0.4% on the month and 3.4% on the year, both in line, but core rose 0.3% on the month, a tenth above forecast, with the annual core rate at 2.4%. Gasoline alone was up 27.4% from a year earlier and accounted for more than a third of the monthly increase. Hike odds went from about 70% to close to 90% in a day.
On 16 September the Fed delivered: a quarter point to 3.75% to 4.00%, its first increase since July 2023, on a 12 to 0 vote. The dot plot showed 12 of 18 officials pencilling in one more hike this year, 4 wanting two, and 2 wanting none. Kevin Warsh, in his first press conference at a live decision, called inflation the committee’s predominant concern. President Trump, who picked Warsh expecting cheaper money, posted that the Fed should “LOWER THE INTEREST RATES FOR THE UNITED STATES OF AMERICA, AND FAST”. A unanimous hike from a handpicked chairman is about as clear a statement of independence as a central bank can make.
Fed speakers lined up behind the move, with Philadelphia’s Anna Paulson saying “some modest further tightening may be warranted”, and by 25 September futures priced roughly a 76% chance of another hike on 28 October. Then the last data point of the month pulled the rug. August PCE inflation came in at 3.4% against 3.7% expected, with core at 3.0% against 3.3%, much of it down to a new statistical method for pricing software and services. Traders cut October hike odds to about 37%. And yet the 10-year yield rose to a new 2007 high the same day. When yields rise on soft inflation data, the bond market is telling you the problem is supply, and the Fed has less say over that than people assume.
The consumer looks tired. Conference Board confidence fell to 81.9, its lowest since 2014, and the average 30-year mortgage rate reached about 7.5%. On the other side, jobless claims dropped to 197,000 and the flash composite PMI jumped to 58.4 against 55.3 forecast. Hard data hot, soft data cold. That is a K-shaped economy, and the Fed is setting policy for the top of the K.
It was not only the Fed. The ECB raised its deposit rate to 2.50% on 10 September, its second hike of the year, with Christine Lagarde calling the move a “no brainer” as euro zone inflation hit 3.3%. The Bank of Japan hiked to 1.25% on 18 September, its highest since 1995, but the vote was 7 to 2 and Governor Ueda promised nothing further, so the yen weakened to around 157 per dollar despite the hike. Australia’s central bank raised to 4.60%, its fourth hike this year. Four major central banks tightened in one month, into an energy shock. None of us have traded through that before.
Geopolitical Developments
If August was hope, stalemate and escalation, September was the month the Iran conflict reached a second chokepoint.
It opened with US strikes on Iranian targets around the Strait of Hormuz after attacks on two tankers, Iranian retaliation against American bases in the Gulf, and WTI up 5.2% to $90.22 on 1 September. Washington adopted a “tanker for tanker” policy, an Iranian attack on a Saudi tanker killed two Filipino sailors, and Trump rejected talks.
On 8 September Houthi missiles and drones struck Saudi Aramco’s 400,000 barrel a day Jazan refinery, wounding at least 73 people. Three days later the Houthis seized Perim Island after Yemeni government forces withdrew, completing their control of both lanes of the Bab el-Mandeb strait. That hands Iran and its proxies leverage over two of the world’s most important oil corridors at once. The same day, drone attacks blamed on Iraqi militias shut the 1,200 kilometre East-West pipeline, the route that carries Gulf crude to the Red Sea and bypasses Hormuz entirely. Saudi Arabia suspended loadings at Yanbu, Brent settled at $109.21 on 15 September, physical dated Brent cleared $130, and US diesel hit a record $6.26 a gallon. By 18 September Aramco was telling European refiners they would get no crude at all in October.
Then it eased. The pipeline restarted on 22 September, and Middle East crude exports actually rose to 12.8 million barrels a day for the month, the most since February. Iran floated a seven-day plan to reopen Hormuz, Reuters reported the two sides discussing a phased deal, and Brent fell five sessions straight to below $100. On 28 September Trump rejected Iran’s proposal and Brent jumped back to about $107. Two days later he denied reports that Washington would ease sanctions. The obstacle, per Reuters sources: neither side wants to give up its leverage first. Hormuz traffic still runs at roughly a dozen transits a day against well over a hundred before the war.
Trade stayed busy. Canada’s retaliatory tariffs took effect on 8 September, hitting about $20 billion of US imports at 15% to 50%. Copper broke on 10 September after Reuters reported the White House still had not decided on a 15% levy on refined imports, and Freeport-McMoRan fell 7.2% in a day, yet by 22 September copper had risen six sessions straight to $14,797 a tonne on the LME, within sight of its record. Xi Jinping’s state visit on 23 to 25 September extended the US-China tariff truce to 10 January, and both sides published lists for a “30 for 30” deal, each cutting tariffs on about $30 billion of goods, with semiconductors left out and no start date given. And Congress passed a stopgap on 1 September funding the government through 11 December. One risk removed from October and planted in December.
Corporate Earnings and Stock Market Movers
September is quiet on the earnings calendar, but the reports that landed showed exactly how the market is sorting the AI trade. A beat on its own was not enough. The companies that got paid showed AI revenue with clean balance sheets. The ones that got sold showed AI revenue with a financing question attached.
Table 2: September 2026 Earnings Movers
| Company | Revenue | Adjusted EPS | Stock reaction |
| Dell | $46.97 billion, up 58% | $7.04 | up 16% next day |
| Broadcom | $29.6 billion, up 86% | $3.32 | down 6% to about $346 |
| Oracle | $19.3 billion vs $19.1 billion expected | $1.92 vs $1.74 | down about 7% on the week to $139.54 |
| Adobe | $6.76 billion, up 13% | $6.13 vs $6.07 | down about 2% after hours |
| Costco | $95.72 billion vs $94.97 billion | $6.75 vs $6.54 | up 0.3% after hours |
| Carnival | $8.44 billion vs $8.39 billion | $1.43 vs $1.35 | up 13.4% to $25.11 |
| Micron | $54.23 billion vs $51.07 billion | $33.42 vs $31.61 | down about 1% after hours |
Dell set the tone on 1 September. Revenue came in at $46.97 billion, up 58%, with adjusted earnings of $7.04 per share, far above consensus. AI server revenue doubled to $16.4 billion, AI orders hit a record $60.9 billion and the backlog reached $95 billion. Management raised full-year revenue guidance by $25 billion to $192 billion and earnings guidance to $25.50 per share. The stock surged 16% the next day.
Broadcom showed the other side a day later. Fiscal third-quarter revenue was a record $29.6 billion, up 86%, with adjusted earnings of $3.32 per share, up 96%. AI semiconductor revenue reached $16.7 billion, up 221%, and management raised the full-year AI outlook to $58 billion. So why did the stock fall 6% to about $346? Because the current-quarter revenue guide of $34.8 billion came in under the $35.03 billion analysts wanted. A $230 million shortfall on a $35 billion number was enough.
Oracle was the most instructive story of the month. Fiscal first-quarter revenue rose 30% to $19.3 billion against $19.1 billion expected, adjusted earnings were $1.92 per share against $1.74, cloud infrastructure revenue more than doubled to $7.4 billion, and remaining performance obligations hit $664 billion. The stock rose 6% early the next day, then turned negative by the afternoon. What changed? Investors looked past the backlog to the bill: capital spending of $28.5 billion in one quarter against $8.5 billion a year earlier, negative free cash flow of $5.4 billion and about $125 billion of debt. On 24 September Oracle issued a force majeure notice on Project Jupiter, its $18 billion New Mexico data centre for OpenAI, citing delays in securing power and permits. The stock fell about 7% on the week to $139.54, its credit default swaps hit a record, and the project’s loans traded at 89 to 91 cents on the dollar. The AI build-out is now a credit story as much as an equity story.
Adobe beat and was sold anyway. Third-quarter revenue was a record $6.76 billion, up 13% and about $70 million ahead of estimates, with adjusted earnings of $6.13 per share against $6.07. The company raised its full-year outlook to $26.58 to $26.63 billion of revenue and $24.45 to $24.50 per share. On the same call it announced that Shantanu Narayen will hand the chief executive role to Anil Chakravarthy on 1 December. The stock slipped about 2% after hours to around $243.50. Markets rarely like a CEO change they did not ask for, however orderly.
Costco delivered exactly what was priced. Fiscal fourth-quarter earnings of $6.75 per share beat the $6.54 consensus, revenue of $95.72 billion beat $94.97 billion, and comparable sales rose 9.4% against a 9% forecast, with digital comps up 19.5%. Stripping out gasoline and currency, comps grew 6.7%, and 15 cents of the earnings came from one-off tariff refunds. The stock rose 0.3% after hours. Compare that with Walmart’s warning in August about customers trading down against fuel prices and you can see both halves of the American consumer in one month.
Carnival had the month’s best reaction. Earnings of $1.43 per share beat the $1.35 expected on revenue of $8.44 billion against $8.39 billion, with record net income of $1.9 billion. Despite a $150 million fuel headwind, the company raised full-year earnings guidance to $2.24 per share from $2.22, and 2027 bookings are at record occupancy and pricing. The stock jumped 13.4% to $25.11 on 29 September. People are still spending on experiences, even at $100 oil.
Micron closed the month on 30 September after the bell. Revenue was $54.23 billion against $51.07 billion expected, nearly four times the $11.32 billion of a year earlier, with adjusted earnings of $33.42 per share against $31.61. Data centre revenue rose 11-fold. Guidance for the current quarter was about $61.5 billion against roughly $57 billion expected. And the stock slipped about 1% after hours, because management guided gross margins to about 86%, a point under estimates. A stock up more than 500% in a year needs everything to go right.
Outside the earnings calendar, the biggest single-stock story was Fair Isaac. It fell almost 17% on 4 September after regulators let all mortgage lenders use the rival VantageScore system, then plunged 27% on 29 September, its worst day in more than 30 years, when Fannie Mae and Freddie Mac moved to a single pricing grid for both scores. A monopoly priced as a monopoly has a long way to fall when it stops being one.
A few others worth noting. MongoDB fell about 26% after its chief executive left for Meta. Nvidia added $150 billion to its buyback, the largest increase on record, and rose more than 3%. Generac jumped more than 30% after hours when Amazon took warrants tied to a supply deal worth up to $8 billion for data centre generators. And Nike quietly exited the S&P 100 on 21 September after 18 years, with the shares down about 43% for the year near $38.
Commodities, Bonds, and Other Assets
If you only read one section of this wrap, make it this one. The bond market was the story of September, and it was not a Fed story.
The 10-year Treasury yield started the month at 4.76%. It cleared 4.90% on 10 September for the first time since November 2023, touched 5.04% on 15 September for its highest since 2007, dipped under 5% for two sessions after the Fed decision, and then never looked back. It closed the month at 5.29%, within a couple of basis points of its 2007 peak. The 30-year did more, rising from 5.25% to 5.64% and briefly topping 5.6% on 29 September, a level last seen in June 2002.
Now, here’s what makes this different from a normal tightening cycle. On 9 September the Treasury tripled its long-dated bond buybacks to $6 billion, and yields rose anyway. A 20-year auction cleared at 5.42% and three note auctions in the final full week drew weak demand. When an enlarged buyback cannot hold the long end, the problem is term premium: investors want more compensation for lending to the government for 30 years, whatever the Fed does overnight. The 10-year real yield rose roughly 44 basis points in September, the fastest monthly rise in four years. The MOVE index of bond volatility went from about 80 to a peak of 104.58 on 24 September. Equity volatility slept through it, with the VIX near 15 at month end. One of those two markets is going to be wrong.
And it is global. UK 30-year gilt yields reached 5.89% on 1 September, the highest since 1998, and Japan’s 10-year yield touched 3.00% the same day for the first time since 1996. Rising Japanese yields pull Japanese capital home, which lifts borrowing costs everywhere else. The dollar index rose from about 99.4 to around 101.
Oil finished September up about 14% at $103.53 for Brent, but the path was wild. Brent went from $91.09 at the end of August to a $107.63 settle on 10 September, up 6% in a day, with WTI above $100 for the first time since May. It peaked at $109.21 on 15 September, fell five sessions straight to $98.74 as the pipeline restarted, jumped back to about $107 when Trump rejected Iran’s plan, and settled at $103.53 on the last day. Do note that the rally happened while physical supply was improving. The price carries a geopolitical premium, not a shortage, and premiums can leave as fast as they arrive.
Gold had a rough month. It started near $4,470, fell 2.8% into a war escalation on 1 September, which is the opposite of what a haven is supposed to do, and closed near $4,168, down about 8.5%. Silver ended at $61.13, down about 13.5%. What happened? Real yields rose 44 basis points and the dollar rose 1.5%, and that combination beats the haven bid every time. Gold fell on the very days oil rose, so the market is treating it as a rates trade and not a war trade right now. It is still up substantially for the year, so this reads as a correction inside a trend, but the trend has stopped being easy.
Bitcoin and Ethereum
Bitcoin spent September doing two things that are not supposed to happen together. It rose while the Fed hiked and yields hit 19-year highs, and it shrugged off the death of its own regulatory bill.
It started the month near $78,500 and fell with everything else, trading below $77,000 by 11 September. Then on 15 September the Senate voted 49 to 50 against advancing the Clarity Act, which needed 60 votes, ending market-structure legislation for the year. Bitcoin dropped about 4.2% to roughly $75,850, and Coinbase, Circle and Bullish fell with it.
That was the low. Three days later it was back above $81,000 as traders looked past the defeat to the SEC’s new innovation exemption, which opens a route for tokenised stock trading. On 21 September it cleared $86,000, its highest since January and roughly 50% above its low of two months earlier, with close to $900 million of leveraged positions wiped out in 24 hours, $648 million of them bets against the price. Spot Bitcoin ETFs took in $999 million that day, their largest intake since October 2025, and Bitcoin touched about $87,300 the next day. Late in the month the exchange Bitget lost about $352 million to hackers and Bitcoin barely moved. It finished near $83,600, up about 6%, its fourth green September in a row, though still well below its record near $126,000 from last October.
Ethereum did a little better, rising from about $2,467 to about $2,677, a gain of roughly 8.5%, after clearing $2,600 on 20 September for its highest level since the start of the year.
Concluding Thoughts
September leaves the S&P 500 inside a range, and I think that range is the clearest way to see this market. The floor is 7,551.81, the closing low on the day of the Fed hike. The ceiling is the record close of 7,798.99 from 13 August. Above it, the AI trade has carried the index to within 2% of a record while more than half its members sit below their 200-day averages. Below it, the median stock is already in a downtrend. The breakout direction decides which reading was right.
What breaks the range? Most likely the bond market. If the 30-year closes back under 5.30% after the 2 October payrolls report, the pressure on everything rate-sensitive eases and the ceiling comes into play. If it holds above 5.45%, the stocks that have been making lows will eventually drag the index with them. Third-quarter earnings start in mid-October, the next Fed meeting is on 28 October, and the Hormuz talks could land a deal or collapse on any given day.
I’m often asked whether a Fed hike means the bull market is over. My honest answer is that I don’t know, and this month argues both ways: the economy added 162,000 jobs while consumer confidence sits at a 12-year low. What I do know is that when bond volatility doubles and equity volatility sleeps, one of them is about to catch up. In 1987 bonds broke in April and stocks topped in August. The lead can be months, so I’m not calling a top, but I am paying attention.
Personally, I’ve spent the month doing less. When leadership rotates every week and the index hides what the average stock is doing, the edge goes to whoever is still around when the trend becomes clear again. Position sizes stay small enough that a 400-point gap in either direction is an annoyance rather than a disaster. I let the price action tell me when the range resolves, instead of guessing which way it goes.
If you’d like to follow these moves as they happen, with analysis of what they actually mean for your trading, come join us in our trading community. See you inside!
Want our free trading resources by email? Leave your address below.
 Our flagship mentoring program is suitable for both beginners and advanced traders, covering the 4 strategies which I used over the past 15 years to build up my 7-figure personal trading portfolio.
 If you're looking for the best trading opportunities every day across various markets, and don't want to spend hours doing the research yourself, check out our private Telegram channel!








Leave a Reply
Want to join the discussion?Feel free to contribute!