

Monthly Market Wrap (August 2026)
Join our Telegram channel for more market analysis & trading tips: t.me/synapsetrading
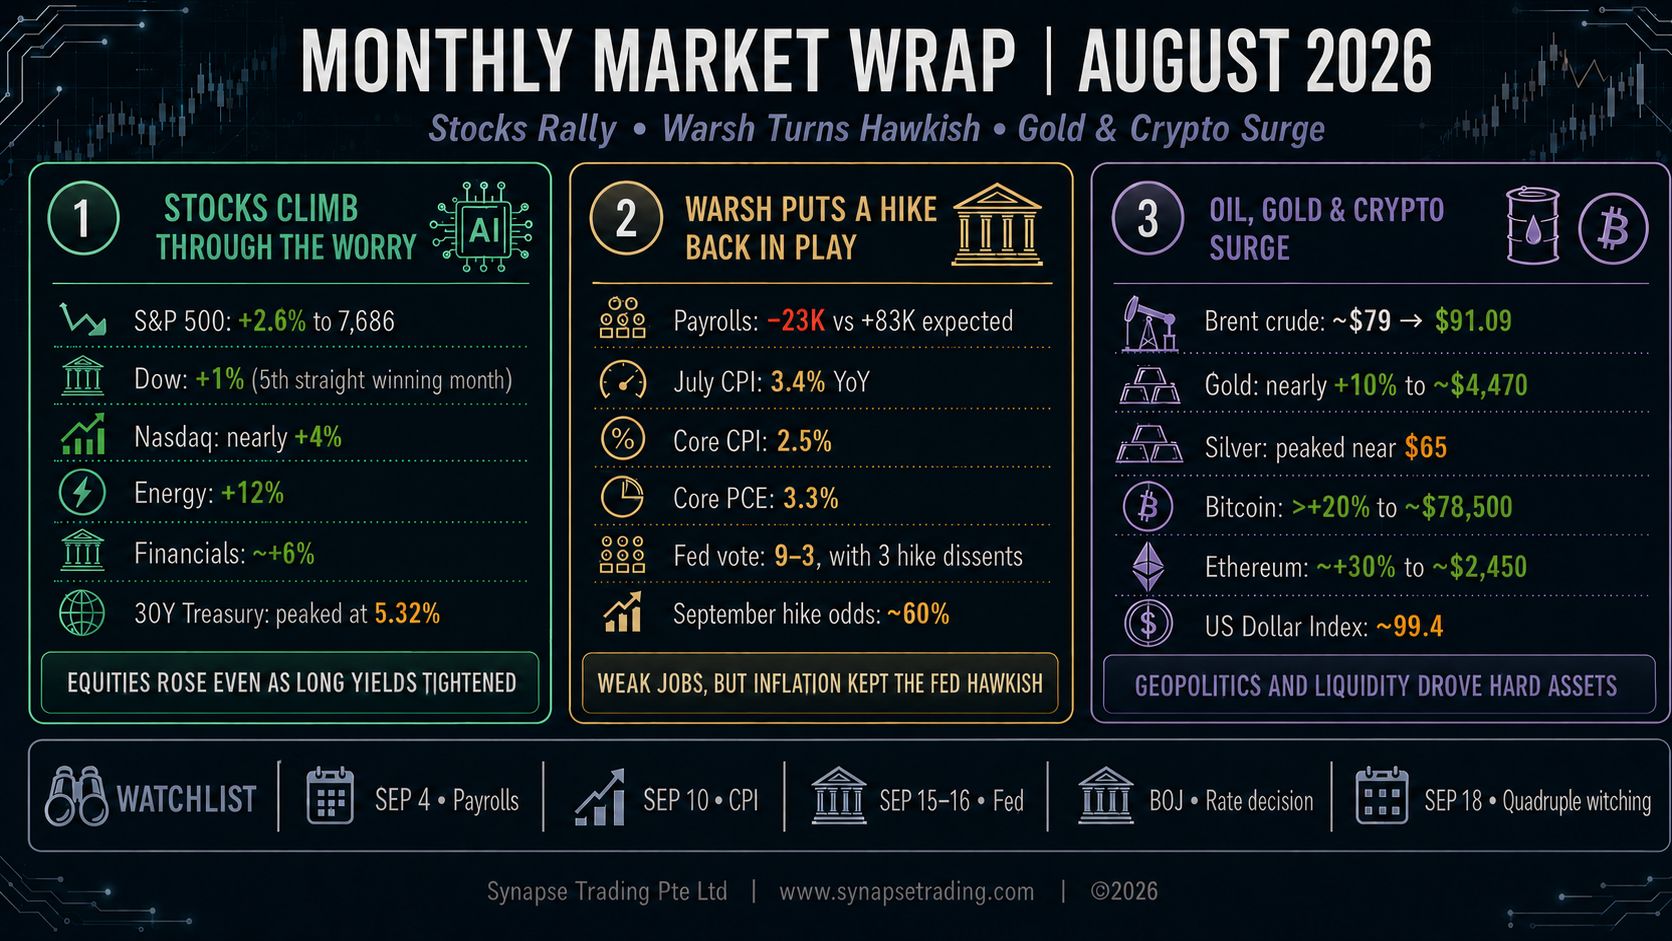
August 2026 presented investors with an unusually contradictory market environment. U.S. equities continued to advance despite weakening labor-market conditions, elevated long-term Treasury yields, persistent inflation pressure, and an increasingly hawkish Federal Reserve. The S&P 500 gained approximately 2.6% during the month and the Nasdaq Composite rose close to 4%, while the Dow Jones Industrial Average recorded its fifth consecutive monthly gain.
Beneath the headline strength, however, volatility remained elevated across asset classes. The United States reported its first monthly job loss since February, Federal Reserve Chairman Kevin Warsh placed a September rate hike firmly back on the table, Brent crude traded between approximately $79 and $94 as tensions with Iran intensified, and Bitcoin surged more than 20% in its strongest monthly performance in over a year.
The central theme of August was therefore not simply risk-on sentiment, but the market’s willingness to look through deteriorating macroeconomic indicators while continuing to reward specific sectors and companies capable of delivering earnings growth. At the same time, the sharp rise in long-term global bond yields created an increasingly restrictive financial backdrop that investors will have to confront heading into September.
Table of Contents
1. Global Equity Markets: Rallying Through Macro Uncertainty
U.S. equities spent August climbing what was effectively a wall of worry. The month began with a broad rally as investors reacted positively to hopes that the Strait of Hormuz might eventually reopen. The Dow Jones Industrial Average recorded record closing levels across three consecutive sessions during the first week of August.
The rally accelerated following the release of cooler inflation data. On 13 August, the S&P 500 moved above the 7,800 level for the first time in its history, reaching an intraday record before closing at 7,798.99.
Momentum weakened during the middle of the month as the 30-year U.S. Treasury yield climbed above 5.3%, its highest level since 2007. The move forced investors to reassess whether equity valuations could continue expanding while long-term borrowing costs remained historically elevated.
Sentiment improved again during the final week following Nvidia’s earnings announcement. The reaction was notable not only because Nvidia itself rallied sharply, but because capital rotated into software and cybersecurity stocks, suggesting that investors were beginning to broaden the artificial-intelligence trade beyond semiconductor infrastructure.
Table 1: Major Equity Market Performance (August 2026)
| Index / Market | August Closing Level | Monthly Change | Primary Market Driver |
| S&P 500 | 7,686 | Approx. +2.6% | AI earnings strength and resilient risk appetite |
| Nasdaq Composite | 26,371 | Nearly +4% | Technology, software and AI-related gains |
| Dow Jones Industrial Average | 53,186 | Just over +1% | Fifth consecutive positive month |
| STOXX Europe 600 | Record near 660 before retreat | Mixed | Higher European bond yields |
| South Korea Kospi | Highly volatile | Mixed | Semiconductor boom and shareholder-return announcements |
| Japan Nikkei 225 | Broadly sideways | Mixed | Rising Japanese government bond yields |
Sector leadership was unusual for an advancing market. Energy was the strongest major U.S. sector, gaining approximately 12% as crude oil prices rose on geopolitical tensions. Financial stocks followed with gains of around 6%, benefiting from higher yields and expectations that interest rates could remain elevated.
International markets were more mixed. The STOXX Europe 600 briefly reached a record near 660 early in the month before declining across five consecutive sessions as European bond yields increased.
South Korea experienced particularly extreme volatility. The Kospi surged 5.9% in a single session after SK Hynix announced a 40 trillion won share buyback, only to fall 3.1% several days later after Samsung failed to meet investor expectations for additional shareholder returns. The Bank of Korea also raised its policy rate to 3.00%, marking its first back-to-back rate increase since 2023.
2. U.S. Labor Market Weakness and the Federal Reserve Policy Dilemma
The macroeconomic story of August unfolded in three distinct stages: weakening employment, moderating inflation, and then a renewed hawkish shift from the Federal Reserve.
The Labor Market Cracks
July payroll data released on 7 August showed the U.S. economy losing 23,000 jobs, dramatically below expectations for an increase of approximately 83,000. It represented the first outright monthly employment decline since February.
Financial markets initially interpreted the report as strongly dovish. Expectations for a September Federal Reserve rate hike fell from approximately 57% to around 44%, as investors assumed that weakening employment would discourage additional monetary tightening.
Inflation Provides Temporary Relief
Inflation data initially reinforced that interpretation. July headline CPI came in at 3.4%, broadly matching expectations, while core CPI was reported at 2.5%. Producer prices were flat on the month and the annual producer-price inflation rate declined from 5.5% to 4.7%.
However, other economic indicators pointed toward weakening consumer conditions. July retail sales fell 0.6%, representing the largest decline in approximately one year. University of Michigan consumer sentiment fell to 51.0, while Chicago PMI declined to 47.1, its weakest level of 2026.
Table 2: Key U.S. Macroeconomic Indicators (August 2026)
| Indicator | Reported Value | Forecast / Previous | Market Implication |
| Nonfarm Payrolls | -23,000 | +83,000 forecast | First monthly job contraction since February |
| Headline CPI | 3.4% | In line with consensus | Inflation remained elevated but stable |
| Core CPI | 2.5% | Broadly expected | Moderating underlying inflation |
| Producer Prices | Flat MoM / 4.7% YoY | 5.5% previous annual rate | Reduced near-term inflation concern |
| Retail Sales | -0.6% | Weakest in around one year | Consumer spending deterioration |
| University of Michigan Sentiment | 51.0 | Lower | Weak household confidence |
| Chicago PMI | 47.1 | Below 50 | Weakest reading of 2026 |
| Core PCE | 3.3% | Fourth consecutive month near this level | Persistent inflation pressure |
3. Jackson Hole and the Federal Reserve’s Hawkish Reversal
The market’s dovish interpretation was overturned during the second half of August. Minutes from the July Federal Open Market Committee meeting showed officials voting 9-3 to maintain the federal funds rate at 3.50% to 3.75%, with three policymakers preferring an increase.
The decisive event came on 28 August, when Federal Reserve Chairman Kevin Warsh delivered his first Jackson Hole keynote. Warsh emphasized that policymakers still had “work to do” on inflation and argued that current financial conditions were “not restrictive.” He also suggested that traditional forward guidance had overstayed its usefulness.
Warsh specifically highlighted core PCE inflation, which had remained around 3.3% for four consecutive months. Markets reacted immediately. The two-year Treasury yield jumped 13 basis points during the session as investors rapidly rebuilt expectations for additional monetary tightening.
By the end of August, markets were assigning approximately a 60% probability to a Federal Reserve rate increase at the September meeting.
The resulting policy environment is particularly unusual. The Federal Reserve is considering tighter policy even as employment contracts and consumer indicators weaken. This combination introduces a genuine stagflationary risk: growth is slowing, but inflation remains sufficiently persistent to prevent policymakers from easing.
4. Geopolitical Risk: Iran, Hormuz and the Return of the Oil Premium
Geopolitical developments remained one of the dominant drivers of global markets throughout August. The situation surrounding Iran and the Strait of Hormuz progressed through three phases: optimism over a potential reopening, diplomatic stalemate, and renewed military escalation.
The month began with President Trump claiming that an agreement had been reached to reopen the Strait of Hormuz. Iranian authorities disputed that claim through multiple state channels. The existing ceasefire framework subsequently expired on 17 August without a final agreement.
Washington shifted toward additional economic pressure, including a naval blockade of Iranian ports and a sanctions package announced on 24 August under the name “Operation Economic Outcast.” Approximately 60 entities were reportedly covered, including secondary sanctions without an exemption for China.
Shipping activity through the Strait remained severely disrupted. At certain points during the month, only approximately eight vessels per day were transiting the waterway, compared with roughly 130 to 140 before the conflict.
Table 3: Oil and Geopolitical Market Developments (August 2026)
| Event / Asset | August Level / Date | Market Impact |
| Brent Crude – Early August | Approx. $79 | Initial optimism over Hormuz reopening |
| Brent Crude – Escalation Peak | Near $94 around 20 August | Renewed geopolitical risk premium |
| Brent Crude – Month End | $91.09 | +3.4% on final trading day |
| Hormuz Vessel Traffic | As low as approx. 8 vessels/day | Severe disruption versus 130–140 pre-conflict |
| 24 August Sanctions | Approx. 60 entities | Additional economic pressure on Iran |
| Final-Day Military Exchange | US strikes / Iranian missile response | Renewed direct conflict premium |
Brent crude approached $94 per barrel around 20 August before retreating toward $88 when markets interpreted additional sanctions as a potential substitute for further military escalation.
The situation changed again on the final trading day of the month. U.S. forces struck Iranian rocket launchers on Larak Island, and Iran responded with missiles aimed at U.S. bases in Jordan. Brent crude jumped 3.4% to $91.09.
September therefore begins with a persistent geopolitical premium embedded in energy prices. Until shipping traffic through Hormuz returns to normal, the oil market is likely to remain highly sensitive to diplomatic and military developments.
5. Trade Policy and the Expansion of the U.S. Tariff Regime
Trade policy remained another source of inflationary pressure. A broad new U.S. tariff framework took effect on 1 August, introducing baseline tariffs of approximately 10% to 12.5% across roughly 60 trading partners, with substantially higher country-specific rates in selected cases.
Canada subsequently faced additional measures. The U.S. announced plans to impose 50% tariffs on Canadian automobiles, trucks, automotive parts and steel beginning in January 2027.
Prime Minister Mark Carney responded with retaliatory tariffs covering approximately C$27.6 billion of U.S. goods, scheduled to take effect on 8 September.
The expansion of tariffs adds another complication for central banks. Even if domestic demand continues to slow, higher import costs could prevent goods inflation from falling quickly enough to justify easier monetary policy.
6. Corporate Earnings: AI Leadership Broadens Beyond Semiconductors
Second-quarter corporate earnings remained strong at the headline level. S&P 500 earnings were tracking approximately 50% year-on-year growth according to FactSet, representing the strongest pace since 2021.
However, August demonstrated that beating analyst expectations alone was no longer sufficient. Investors increasingly differentiated between companies able to generate measurable AI-related revenue and companies whose valuations already reflected extremely optimistic assumptions.
Nvidia Remains the Central AI Bellwether
Nvidia reported revenue of $96.2 billion, more than double the previous year’s level and above expectations of approximately $92.2 billion. Earnings per share reached $2.22 compared with analyst expectations of $2.10.
Management guided the following quarter to approximately $108 billion in revenue, above consensus estimates near $104 billion.
The initial reaction was negative because Nvidia projected gross margins declining from approximately 75% toward 71% to 72% by year-end as memory costs increased.
The market reversed its interpretation the following session. Nvidia surged 8.7%, adding approximately $440 billion in market capitalization in a single trading day, the second-largest one-day increase in corporate market value on record. Nvidia’s market capitalization returned to above $5.5 trillion.
Table 4: Major Corporate Earnings and Stock Reactions (August 2026)
| Company | Key Result / Development | Stock Reaction | Primary Theme |
| Nvidia | $96.2B revenue; $2.22 EPS; $108B guidance | +8.7% following earnings | AI demand remains strong despite margin pressure |
| Salesforce | $5.90 EPS vs $3.27 expected; Anthropic partnership expanded | +22% | AI monetisation in enterprise software |
| Okta | $805M revenue; $1.05 EPS; raised outlook | Approx. +28% | Cybersecurity rebound |
| CrowdStrike | Revenue +26% to $1.47B | Best day on record | Cybersecurity / AI revenue |
| Palantir | Revenue +93%; US commercial sales +149% | Nearly +30% | Rapid AI-driven commercial growth |
| AMD | $11.5B record revenue; data-center sales doubled | More than -8% | Valuation expectations too high |
| Marvell | $2.74B revenue, +37%; approx. $18B FY guidance | -8% | Selective semiconductor valuation pressure |
| Cisco | $17.3B record revenue; $9.3B AI orders | -8% | Strong numbers insufficient for hardware investors |
The broader message was that the artificial-intelligence trade began to rotate away from the companies supplying computing infrastructure and toward companies capable of demonstrating actual AI-driven revenue growth.
Salesforce jumped 22%, Okta gained approximately 28%, CrowdStrike recorded its strongest session on record, and Palantir climbed nearly 30%. Software had previously been one of the market’s weakest groups, falling roughly 19% at one stage of the year, making the August reversal particularly significant.
7. Consumer Companies Reveal Growing Household Pressure
Consumer-related earnings painted a less optimistic picture. Walmart reported adjusted earnings of $0.81 per share, above the $0.74 expected, but U.S. comparable sales increased only 2.6% compared with expectations of 3.7%.
Management noted that customers were increasingly trading off discretionary purchases against higher fuel costs. Walmart shares fell approximately 9%.
Target reported earnings of $4.11 per share against expectations of $2.33, while comparable sales increased 3.8%. However, almost $1 billion of tariff refunds contributed to the result, reducing the quality of the earnings beat in investors’ eyes.
Home Depot increased sales by 5.7% to $47.9 billion and maintained its full-year guidance. However, customer transactions fell approximately 1%, while the entire comparable-sales increase came from a higher average transaction value.
The underlying message was important: consumers were not necessarily purchasing more goods. In many categories, they were simply paying more for them.
Table 5: Significant U.S. Stock Moves (August 2026)
| Company | Approx. Stock Move | Reason for Move |
| Salesforce | +22% | Strong earnings and expanded Anthropic partnership |
| Okta | +28% | Revenue beat and raised outlook |
| Palantir | Nearly +30% | 93% revenue growth and 149% US commercial growth |
| Workday | Nearly +20% | Reports of potential Silver Lake takeover |
| Dick’s Sporting Goods | -31% | Sharp reduction in company outlook |
| Walmart | Approx. -9% | Weak comparable sales and consumer pressure |
| AMD | More than -8% | Valuation concerns despite record revenue |
| Marvell | -8% | Strong results but elevated AI expectations |
| Cisco | -8% | Hardware stocks failed to receive earnings premium |
Other notable moves included Dick’s Sporting Goods, which declined approximately 31% after reducing its outlook, while Moderna approximately doubled following positive melanoma vaccine trial data before giving back 24% the following day.
Microsoft also lost approximately $112 billion in market capitalization during one session after Morgan Stanley questioned whether AI-generated revenue was growing quickly enough to justify the extraordinary level of AI capital expenditure.
8. Fixed Income: Long-Term Bond Yields Become the Market’s Main Constraint
The bond market was arguably the most important underlying story of August. U.S. long-term Treasury yields moved to levels not seen in almost two decades as investors demanded greater compensation to hold long-duration government debt.
The 30-year Treasury yield reached approximately 5.32% during the middle of the month, its highest level since 2007. By month-end, the U.S. 10-year yield stood near 4.76% while the 30-year finished around 5.25%.
The pressure became significant enough that the U.S. Treasury announced plans to at least double its repurchases of 10- to 30-year bonds beginning in September. Federal government debt also exceeded $40 trillion during the month.
Table 6: Global Bond Market Levels (August 2026)
| Bond Market | August Yield / Level | Significance |
| U.S. 2-Year Treasury | Sharp +13 bps move on Jackson Hole day | Reflects renewed September hike expectations |
| U.S. 10-Year Treasury | Approx. 4.76% | Elevated long-term financing costs |
| U.S. 30-Year Treasury | Approx. 5.25% | Reached 5.32%, highest since 2007 |
| Japan 10-Year Government Bond | Approx. 2.95% | Highest level since 1996 |
| German 30-Year Bonds | Highest borrowing cost since 2011 | European long-duration pressure |
The bond sell-off was global rather than purely American. Japan’s 10-year government bond yield reached approximately 2.95%, a level last seen in 1996. Markets were assigning approximately an 87% probability to a Bank of Japan rate increase in September.
German 30-year borrowing costs also reached their highest level since 2011.
The simultaneous tightening of major global bond markets represents an increasingly important constraint on equity valuations. Higher sovereign yields increase corporate borrowing costs, reduce the present value of long-duration earnings, and provide investors with more attractive alternatives to equities.
9. Commodities: Gold Surges While Oil Retains Its War Premium
Gold delivered one of its strongest monthly performances of the year, gaining close to 10%. The metal began August near $4,000 and climbed to approximately $4,730 on 25 August, its highest level in more than three months.
Warsh’s hawkish Jackson Hole speech triggered a sharp reversal. Gold fell approximately 2.7% in a single session before finishing the month near $4,470.
Silver reached approximately $65, its highest level in 14 years, before retreating alongside gold and other hard assets.
An important cross-asset relationship emerged on Jackson Hole day. Gold, silver, gold-mining shares and Bitcoin all declined simultaneously as interest-rate expectations increased. The move suggested that investors were temporarily treating the entire hard-asset complex as one large directional trade on monetary policy.
Table 7: Commodities and Alternative Asset Performance (August 2026)
| Asset | August Closing / Key Level | Monthly Change | Primary Driver |
| Gold | Approx. $4,470 | Nearly +10% | Inflation, geopolitics and rate expectations |
| Silver | Peak near $65 | Strong positive month | Hard-asset demand and inflation hedge flows |
| Brent Crude | $91.09 | Approx. +3% | Iran conflict and Hormuz disruption |
| U.S. Dollar Index | Approx. 99.4 | Slight decline | Mixed growth and rate expectations |
| Bitcoin | Approx. $78,500 | More than +20% | ETF inflows, short squeeze and policy optimism |
| Ethereum | Approx. $2,450 | Approx. +30% | Broad crypto-market recovery |
10. Digital Assets: Bitcoin’s Best Month in More Than a Year
Bitcoin began August near $63,000, still approximately 27% lower for the year and trapped in a relatively narrow trading range.
The market changed dramatically during the second half of the month. On 20 August, Bitcoin broke above $72,000 in what became the largest cryptocurrency short squeeze since 2021. Approximately $3 billion of leveraged positions were liquidated, with roughly 92% of those positions reportedly being short positions.
The rally accelerated from there. Bitcoin gained approximately 22% in a single week, its strongest weekly advance in more than two years, and subsequently broke above $80,000 for the first time in over three months. The month’s peak was approximately $81,200.
Spot Bitcoin ETF inflows reached approximately $1.92 billion during one week, the largest weekly inflow in around ten months.
Drivers of the Bitcoin Rally
Several developments contributed to the move. The U.S. Treasury’s decision to increase long-term bond buybacks was interpreted by some investors as a positive liquidity signal. President Trump publicly encouraged Congress to pass the Clarity Act, which would provide a clearer regulatory framework distinguishing cryptocurrencies treated as securities from those classified as commodities.
Proposed regulatory changes from the Securities and Exchange Commission were also interpreted positively by digital-asset markets.
Warsh’s Jackson Hole speech temporarily interrupted the rally. Bitcoin fell below $77,000 and approximately half a billion dollars of leveraged positions were liquidated. However, Bitcoin subsequently recovered to finish the month near $78,500, representing a monthly gain of more than 20%.
Ethereum performed even better on a percentage basis. ETH began August around $1,870, climbed above $2,500 late in the month, and closed near $2,450. That represented an increase of approximately 30%.
11. September 2026: A Concentrated Calendar of Market Risk
August leaves investors facing a highly unusual setup. Equity indices remain near record territory, but the macroeconomic backdrop includes weakening employment, stubborn inflation, historically elevated long-term bond yields, persistent geopolitical risk and the possibility of simultaneous tightening by two major central banks.
Table 8: Key Market Events to Watch in September 2026
| Date | Event | Primary Market Risk |
| 4 September | U.S. Payrolls | Determines whether July’s job contraction was temporary or structural |
| Around 10 September | U.S. CPI | Critical input for September Fed expectations |
| 15–16 September | Federal Reserve FOMC Meeting | Potential interest-rate increase |
| Following Fed Meeting | Bank of Japan Meeting | Markets expect a high probability of a rate increase |
| 18 September | Quadruple Witching | Potential increase in equity and derivatives volatility |
The rapid changes in Federal Reserve expectations during August illustrate how uncertain the market environment has become. The probability of a September rate increase moved from approximately 57% to below 35%, before climbing back toward 60% by the end of the month.
This lack of conviction means September’s economic releases have the potential to produce unusually large moves across bonds, equities, commodities and currencies.
12. Summary of Market Drivers and Strategic Outlook
August 2026 was defined by a widening disconnect between financial markets and the underlying macroeconomic environment. U.S. equity indices continued to rise even as payrolls contracted, consumer indicators weakened, inflation remained above target and long-term interest rates moved to multi-year highs.
The artificial-intelligence investment cycle also entered a new phase. Nvidia continued to demonstrate extraordinary demand for AI infrastructure, but the strongest incremental market reactions shifted toward software and cybersecurity companies capable of showing measurable AI-related revenue. At the same time, companies such as AMD, Marvell and Cisco demonstrated that strong results alone were no longer sufficient when valuations already embedded aggressive growth expectations.
The consumer picture was less encouraging. Walmart, Target and Home Depot all provided evidence that higher prices and elevated fuel costs are influencing household behavior. Consumers are increasingly making trade-offs, while revenue growth in some categories reflects higher prices rather than higher transaction volumes.
Outside equities, the bond market remains the principal constraint. U.S., Japanese and European long-term borrowing costs are rising simultaneously, increasing the hurdle rate for every other financial asset. If those yields continue to rise, equity markets will eventually have to justify valuations against an increasingly attractive risk-free alternative.
Geopolitical risk also remains unresolved. Oil retains a substantial premium because of continued disruption through the Strait of Hormuz, while renewed direct military exchanges between the United States and Iran mean September begins with the possibility of additional escalation.
Digital assets were among August’s strongest performers. Bitcoin’s move above $80,000 and Ethereum’s approximately 30% monthly gain demonstrated renewed institutional appetite for cryptocurrencies, although both assets remain highly sensitive to liquidity and interest-rate expectations.
Heading into September, the most important question is therefore not whether investors can predict the exact Federal Reserve decision. The more important issue is whether markets can continue absorbing higher interest rates, weaker employment and geopolitical instability without a broader repricing of risk.
The appropriate response in such an environment is disciplined risk management rather than aggressive prediction. Position sizes should remain manageable, major macro events should be allowed to pass before adding substantial exposure, and price action should take priority over narratives.
The market will ultimately reveal whether August’s rally represented continued resilience or merely the final extension of a trend before a more difficult September. Our job is to observe that evidence, manage risk accordingly, and remain positioned to respond when the next direction becomes clear.
Want the daily routine? Enter your email for the free 15-Minute Swing Trader's Checklist.
Free, 5 pages, PDF. You get the checklist, then my occasional trading emails. Education only, not financial advice. Unsubscribe anytime.
Where your details go: Kit, our email provider, stores your email address in the United States. Our contract with Kit lets it use your address only to send our emails, and requires Kit to keep it secure. The United States has no national privacy law like Singapore's, so that contract is the main protection. More in our privacy policy.
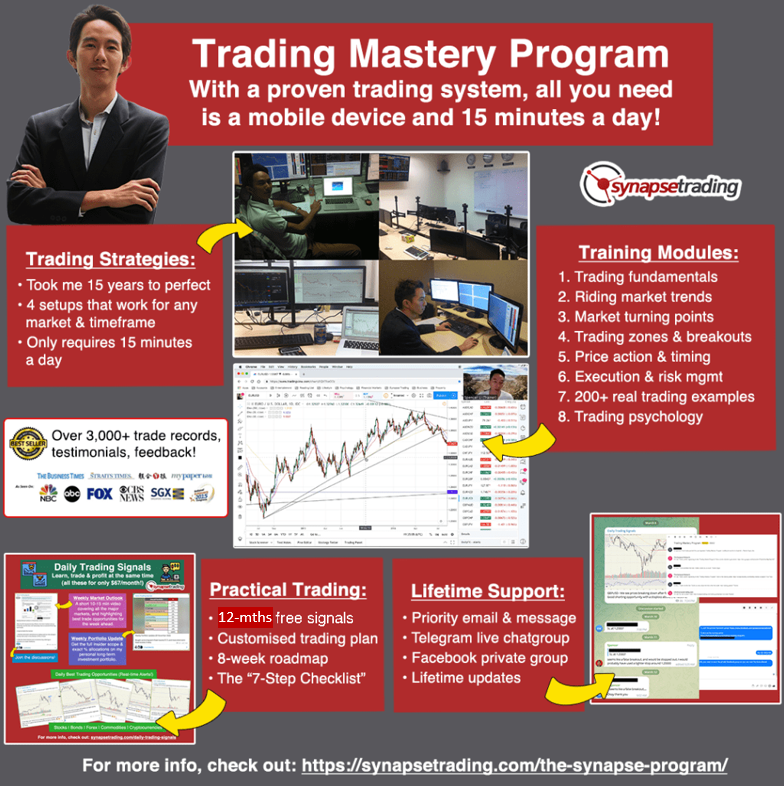 Our flagship mentoring program is suitable for both beginners and advanced traders, covering the 4 strategies which I used over the past 15 years to build up my 7-figure personal trading portfolio.
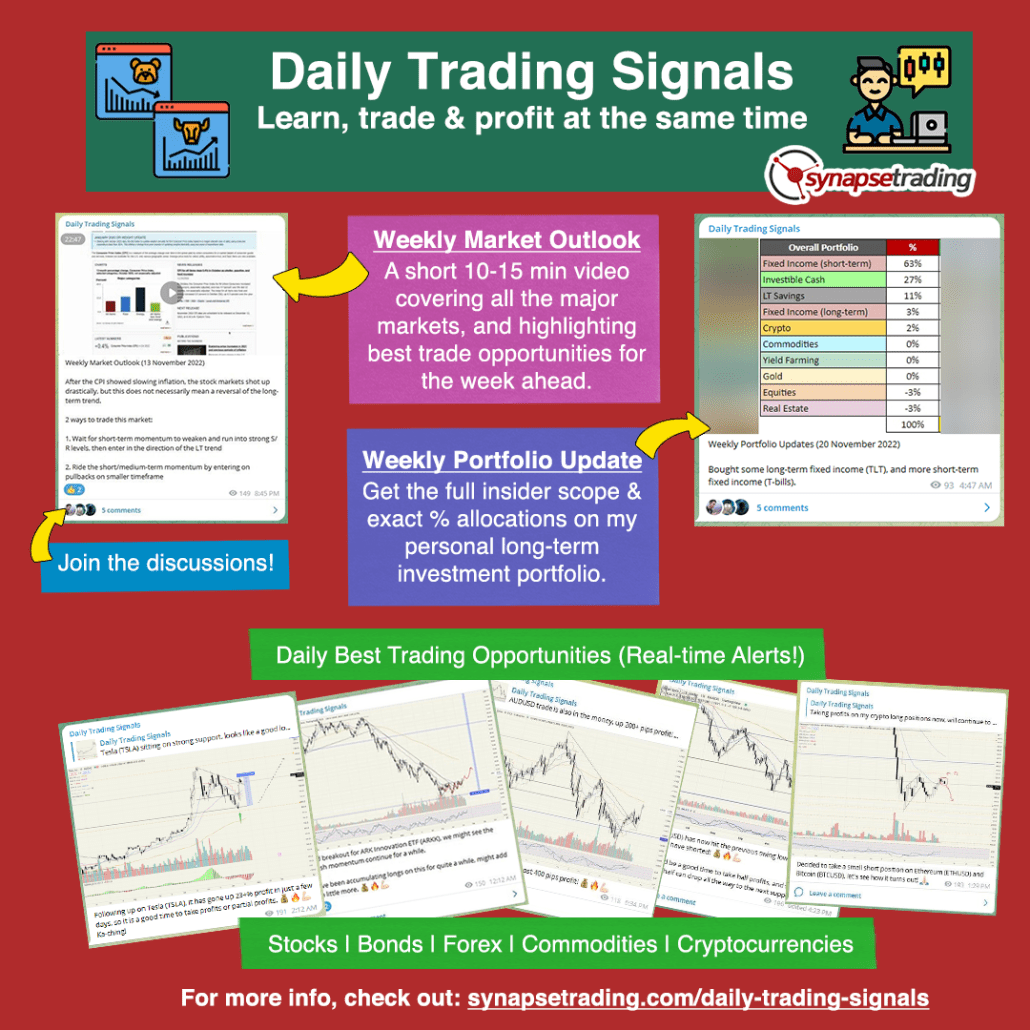 If you're looking for the best trading opportunities every day across various markets, and don't want to spend hours doing the research yourself, check out our private Telegram channel!


Leave a Reply
Want to join the discussion?Feel free to contribute!