Learn more about trading strategies, products, analysis, tools to help you supercharge your trading results!

The point of a resume is to provide your future employer or headhunter a glimpse of your achievements and skill sets, and the purpose of this is to stand out sufficiently, so as to get an opportunity for an interview.

Resume-Tips

After looking through many resumes and talking to many employers, I have a pretty good idea of what they are looking out for, and what should be avoided in your resume. Here are some of my personal guidelines:

      • Keep your resume to ONE single-sided page. Employers have piles of resumes to look at. They will only spend a few seconds scanning your resume to decide if you are worth a shot. They do not have time to scan two pages.
      • Use a decent template. A resume with ugly formatting may get tossed away before getting read.
      • A photo is optional, but if you are including one, make sure it is a professionally taken portrait shot, and not one simply taken using your webcam.
      • Provide relevant data, but not more. Relevant data includes your name, address, mobile number and email address. Irrelevant data includes your birthday, height, weight, race/religion, horoscope, next-of-kin, favourite colour, etc
      • Have a professional-sounding email address. School email addresses are acceptable, but for personal email addresses, please use one that resembles your name, eg. john_tanxx@gmail.com, instead of something like cute_boi88@gmail.com. You get the idea.
      • Put in only the best stuff. Given the space limitations, and considering the few seconds of attention that will be given to your resume, you want to make sure they read the good stuff, so don’t dilute and bury it within other less important experiences. This is not an autobiography, so it is not necessary to write in every single experience you have been through. Write only what is relevant to the job, and things that will possible enable you to stand out. Hint: no one really cares about the medal you won in primary/secondary school.
      • Categorise your experiences. Common categories include “Education”, “Awards & Honours”, “Leadership & Activities”, “Professional Certifications”, “Skills & Interests”
      • Include the time periods for each work and education experience
      • After stating each work experience, include two or three bullet points of elaboration to give a brief description of what you did and what you achieved

If you have any additional tips to share, feel free to add them in the comments below.
Good luck! 😀

There is a general misconception that chart-reading and technical analysis are only for short-term traders, but this is not true. Investors who learn to read charts and adopt long-term trend-following techniques can achieve superior returns to a pure buy-and-hold investor with the added benefit of taking on less risk.


Superior Long-term Investing: How to Catch the BIG Swings

Superior Long-term Investing: How to Catch the BIG Swings


Why the traditional buy-and-hold strategy fails

A buy-and-hold strategy only works in a prolonged bull market, or if you are fortunate enough to buy in at the start of a short bull market. As long as people keep buying a particular stock, the stock price will continue to rise, thus buy-and-hold enthusiasts will sit through minor corrections or occasional bad news, because these small events do not affect the strong fundamentals of the company.

However, when the economy turns bad, and the stock market plunges, all stock prices will plunge together. A stock with stronger fundamentals may plunge to a lesser degree, but losing less money is not the same as making money.  In a prolonged bear market, the stock beomes cheaper and more under-valued as prices fall. Many investors go on a buying spree until they run out of capital, and become locked-in, waiting for prices to “revert to true value” while the market continues to fall. It could take years for them to breakeven, let alone profit.

In such scenarios, does it make sense to hold onto long-term investments for the next few years as losses accumulate, or to add more positions since stocks are now “cheaper”? Is there a better way to avoid this pain? This brings us to the new idea of trend-following investing.

Case Study of Buy-and-hold vs. Trend-following Investing

Let us examine the chart below. This is a weekly chart of the Straits Times Index, showing the period from 2003 to 2008. This is a hypothetical case study showing 2 investors – investor A and investor B.


Case Study of "Buy-and-hold" vs. "Trend-following"

Case Study of “Buy-and-hold” vs. “Trend-following”


Both investors managed to buy near the start of the bull market, near 2003. Investor A is die-hard Warren Buffett fan, adopting a pure buy-and-hold mentality, believing that “a good company is one that can be held forever.” Note that the Straits Times Index is made up of the 30 strongest blue-chips. Investor B is an investor who uses charts to time the big market trends, willing to take profits based on charts and turn short when the charts give a clear signal.

After 5 years, investor A finds that he has made a measly 10% return, having given back most of his profits while holding on though the decline. I did not include dividends here,because investor B would also have got those dividends, for the sake of fair comparison. Investor B, having locked in a 200% return (this is not picking the top, notice that he did not sell at the exact top), goes short and makes another 50% on the decline,raking in a grand total of 200%.

Since our goal in the market is to make money, it makes sense to adopt the approach that gives us the maximum returns within our time horizon and within our risk appetite. This means acquiring skills that give us an edge over the markets.

“I believe there are no good stocks or bad stocks; there are only money-making stocks.” – Jesse Livermore. Do you agree that for any stock, regardless of its fundamentals or value, if you buy and sell at the right time, you can make money from it?

The random walk theory, which started off from academic offshoots, put forth the idea that one should give up trying to predict or beat the markets because it was impossible to do so. In theory, this theory sounds plausible, but in practice, financial history has proven otherwise, with both investors and traders consistently beating the markets.


The Random Walk Myth: Theory vs. Practice

The Random Walk Myth: Theory vs. Practice


The random walk  theory states that price history is not a reliable indicator of future price direction because price changes are “serially independent”. In other words, there is no definable relationship between the direction of price movement from one day to the next. This does not mean that prices meander aimlessly or irrationally, but it means that prices have no patterns of order within the chaos.

We know that prices are determined by a balance between supply and demand. Random walk theory asserts that prices reach that equilibrium level in an unpredictable manner, moving in an irregular response to the latest information or news release. New information, being unpredictable in content, timing and importance, is therefore random in nature. Consequently, the theory puts forth that price changes themselves are random.

Try this interesting optical illusion:

The Random Walk Myth - Can you see the pattern here amid the "randomness"?

The Random Walk Myth – Can you see the pattern here amid the “randomness”?

While price changes might seem random in nature, the trend of prices themselves are not. In reality, price movements contain well-known components of trend, seasonality and cycles which are not random in nature. Although these are mostly clear when prices are considered over the long-term, if one observes prices very closely in the short-run, price trends or patterns are also readily recognisable.

Technical analysis and chart-reading analyses the impact and action of market participants in response to the latest news or information. As a result, it is possible to understand what the different market participants are doing, and which way the market is likely to trend next. Besides, the market is not perfectly efficient, and reading the actions of the smart money will often alert traders to what is happening in the markets.


“The illusion of randomness gradually disappears as the skill in chart reading improves.” – John Murphy

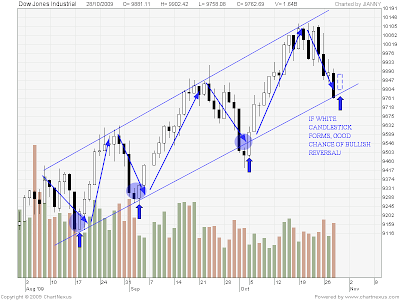
20091030 Dow Jones Industrial 800x600

Price action and volume lies at the core of technical analysis, since that is all the data a market technician works with. Almost all technical methods, such as chart patterns, candlestick patterns or even Elliot wave are studies of price action. Indicators like RSI, Stochastics or MACD are all calculated from price data as well. To understand the big picture, it pays to first understand the building blocks.

Volume Spread Analysis - Spotting the Hidden Clues in Volume

Volume Spread Analysis – Spotting the Hidden Clues in Volume

At the most basic level, price action is the movement of a security’s price. This encompasses all technical and classical pattern analysis, including swings, support and resistance, trends, etc. The most commonly known tools are candlestick and price bar patterns, which are ways of cataloging common price action patterns.

However, the crux about price action is not about memorising patterns and names. It is about understanding. That is what professional traders do. No two people will analyze every bit of price action the same way, and that is why a lot of traders find the concept of price action so elusive. That is why it takes experience to read price action.

Below is a useful picture summary of essential candlestick patterns:

candlesticks patterns

Volume is the number of shares or contracts that trade hands from sellers to buyers during a period of time, and serves as a measure of activity. If a buyer of a stock purchases 100 shares from a seller, then the volume for that period increases by 100 shares based on that transaction.

Hence, volume is energy. It represents the level of commitment and participation by buyers and sellers, hence it indirectly indicates the supply/demand equation. Volume at times also serves as a leading indicator, because large movements in the market are due to the actions of market-movers (also known as the professionals or smart money), and these actions will show up in volume and price. At times,either of these two could provide the leading clues to future market movement.

The level of volume marks the significance of events – for example a breakout, a gap movement, or breaking a key support, etc. The higher the volume, the more significant these events are, because it shows more participation by smart money. In general, volume should be rising n the direction of the trend and decreasing on corrections, which would also be useful for identifying pullbacks in a trend. Watch out for unusual climatic moves in volume, for a climax usually results in a swift reversal or rebound.

The key is understanding the relationship between price and volume.

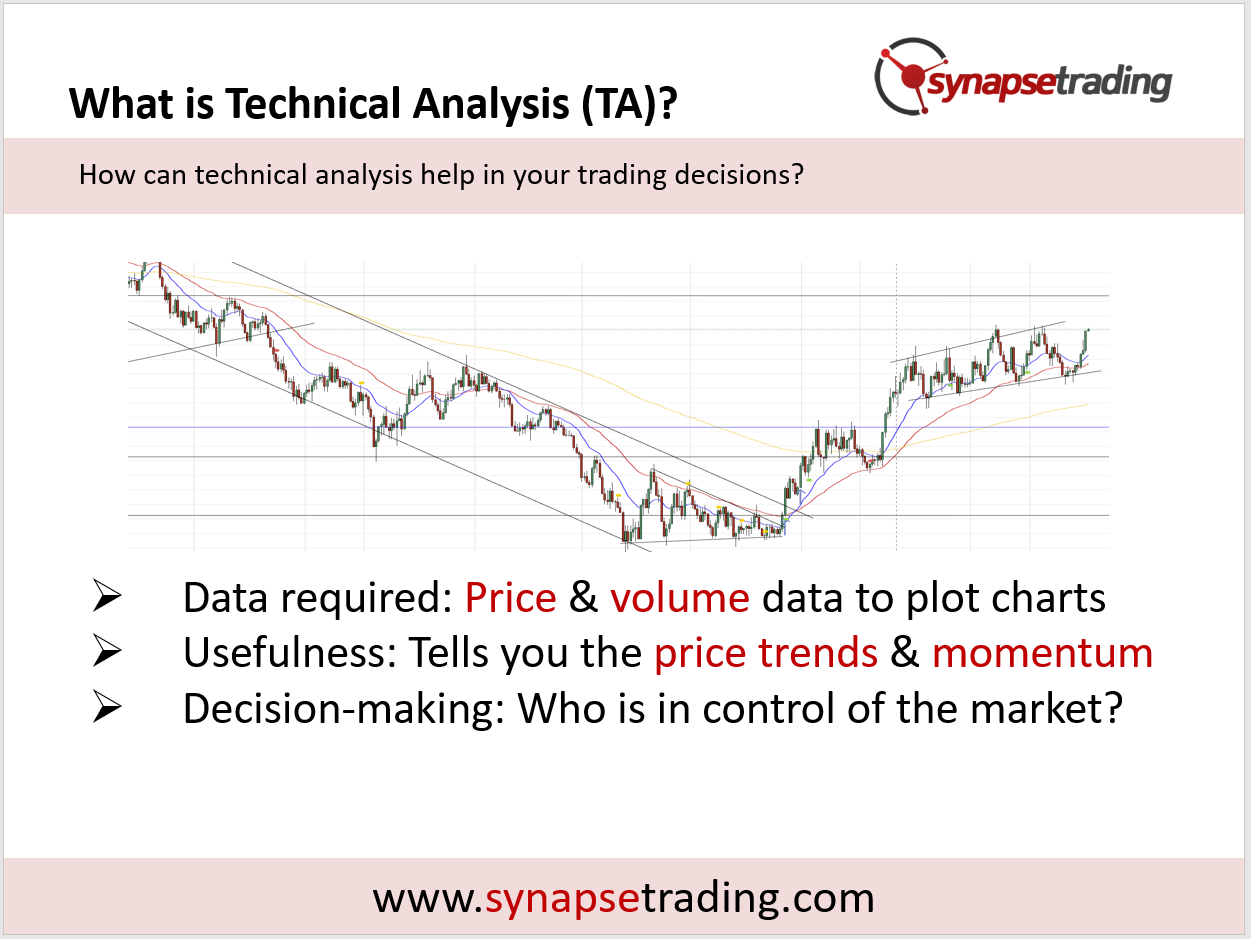
What is Technical Analysis

Technical Analysis is the study of price patterns and trends in the financial markets so as to exploit those patterns. It is in effect applied mass psychology, for it studies the collective action of all market participants.

There are 2 main schools of thought – the classical approach vs. the statistical approach.

The classical approach came about before there were computers, when people manually plotted charts on graph paper, and drew lines (support, resistance, trendlines, channels) to identify behavioral patterns and price chart patterns. Even now, it is still widely popular.

The statistical approach uses data and mathematical formulas (indicators, algorithms) to find mathematical patterns and predict probabilities.

Personally, I find the current best approach is to use a combination of both. Just like in driving, you can rely on the autopilot to help you do calculations and provide useful input, but in certain scenarios it is better to manually take over.

What is Technical Analysis


In applying technical analysis, the same skills can be applied almost universally across different charts and markets, for example a head and shoulders pattern on a stock chart can be interpreted in a similar way to one one a forex or commodity chart.

This is useful if you need an immediate opinion on a market that you know nothing about. The reason technical analysis works so well across different markets universally is because it analyses market psychology, which is the collective psychology of individual market participants.

In contrast with fundamental methods, technical analysis is much less time consuming, for example it can take as little as five minutes to analyse a chart, while doing a valuation on the same stock may take days.

This is possible because market technicians believe that market action discounts everything, so instead of trying to figure out the “true” value of a stock by valuation, the technician allows the market to do that for him, by looking at the consensus of all market participants.

In addition, technical analysis provides great timing and price projection tools, which cannot be found in the fundamentals.

Technical analysis is part art and part science, which is why both its branches complement each other in analysis.

For the classic method, there is some subjectivity involved, since different technicians can interpret the same charts in different ways. In addition, charts cannot be used to predict sudden positive or negative fundamental events, for example earnings, rights issue, M&A, employment data, etc.

Therefore, it is also importance for technicians to keep track of relevant fundamental news, since these act as price catalysts.

Fundamentals and technicals are not mutually exclusive.

One way to visualise this relationship is to think of fundamentals as the cause (economic reasons why a market moves), and technicals as the effect (the actual moving of the market price).

In the short run, the cause and effect might conflict, and it is almost impossible to attribute the infinite different causes to the observed effects. However, in the long-run, they tend to converge.

For example, in stock investing, only the insiders in the company know almost everything about the company. For us, who are outsiders, although we may have gathered extensive sources of information on the company, industry, country, we may still be wrong.

Thus, it is wise to couple technicals (price consensus of all market participants) with fundamentals (specific knowledge of industry & company) to increase the probability of earning a positive return on your investments.

Technical analysis is used to find opportunities when the probabilities are in your favour, and project possible paths and key levels that prices will reach. It is using past data to make a calculated guess of the future. It is NOT a crystal ball that can forecast the future.