

Is the Stock Market a Random Walk? Random Walk Theory vs Practice, Explained for Traders
Want the daily routine? Get the free 15-Minute Swing Trader’s Checklist. Get it free →
By Spencer Li, CFTe · Last updated: 26 October 2026
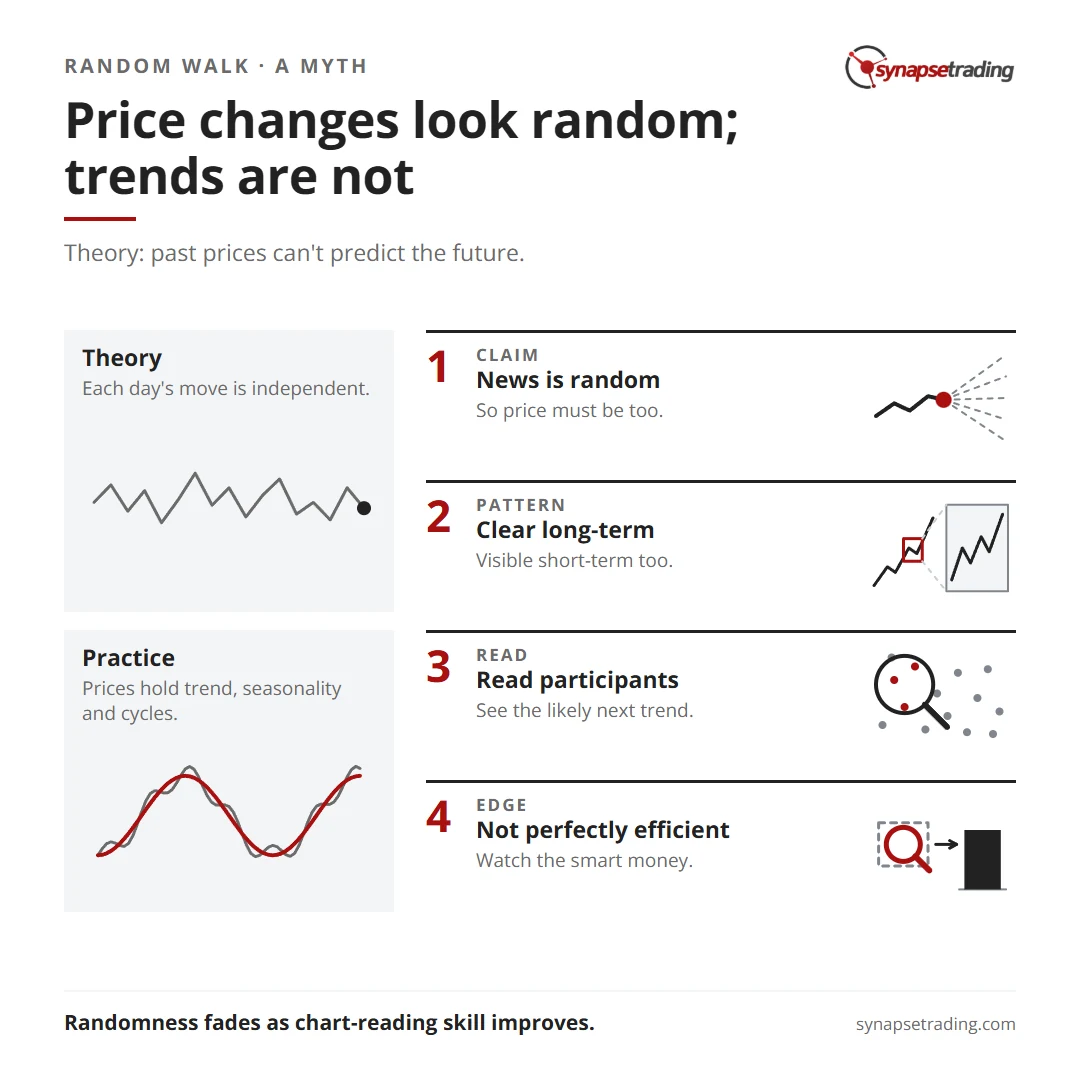
The random walk theory says that price changes are “serially independent”, so yesterday’s move tells you nothing about tomorrow’s, and studying past prices to beat the market is a waste of time. In practice it is about half right. Over a few days or weeks, price changes really are close to unpredictable, and the research behind that is strong. Over longer stretches, prices show trends and momentum that the strict version of the theory struggles to explain, and some of the theory’s own champions have said so in print.
So the market is noisy up close. Further out, it has more structure. Most of a trader’s work is telling the two apart, and John Murphy put it in one line in Technical Analysis of the Financial Markets: “The illusion of randomness gradually disappears as the skill in chart reading improves.” I first wrote about this on the blog in 2010. I still agree with him. But I now carry one warning I did not have back then.
Why did the Nobel committee reward both sides in 2013?
In 2013, the economics Nobel went to three people at once: Eugene Fama, Lars Peter Hansen and Robert Shiller. Fama is the name most linked with efficient markets. Shiller showed in a 1981 paper that stock prices move much more than the dividends behind them can explain. To a casual reader, the committee had just handed the same prize to a theory and to its loudest critic.
The committee saw no contradiction, and its summary said why:
“There is no way to predict whether the price of stocks and bonds will go up or down over the next few days or weeks. But it is quite possible to foresee the broad course of the prices of these assets over longer time periods, such as, the next three to five years.”
So is the market random? It depends on the clock. That one paragraph settles more of the random walk argument than most textbooks do.
What does the random walk theory actually say?

The Random Walk Myth: Theory vs. Practice
The random walk theory says that price history is not a reliable guide to future price direction, because each price change is independent of the one before it. There is no definable link between the direction of today’s move and tomorrow’s. The theory does accept that prices move for reasons. Its claim is that no order hides inside those moves that you could profit from.
The argument runs through news. Prices settle where supply meets demand, and they move when new information arrives. New information is unpredictable in its content, its timing and its importance, which makes it random by nature. And if the input is random, the theory says, the price changes it produces must be random too.
The idea is surprisingly old. The Nobel committee traces its origin to Bachelier’s Théorie de la spéculation, published in Paris in 1900. Maurice Kendall’s 1953 study of prices, Harry Roberts in 1959 and Fama’s 1965 paper “The Behavior of Stock Market Prices” all found support for it. Then in 1970 Fama pulled the research together and split efficiency into three forms. The weak form says you cannot systematically beat the market using historical prices, which makes it the one aimed straight at chart readers like me.
The theory reached ordinary investors in 1973, when Burton Malkiel published A Random Walk Down Wall Street. In a 2003 paper he retold its best-known line: “a blindfolded chimpanzee throwing darts at the Wall Street Journal could select a portfolio that would do as well as the experts.” His actual advice was less zoological. Buy a broad, low-cost index fund and hold it.
That advice has aged well. The theory overreaches at the next step, the claim that nobody can read anything useful from price at all. If you want a daily routine built on the parts of price that are not random, my free 15-minute swing trader checklist is the one I use.
Where does the random walk theory crack?
The first serious crack came from a test with a dry name. In 1988, Andrew Lo and Craig MacKinlay published “Stock Market Prices Do Not Follow Random Walks” in the Review of Financial Studies. They compared how weekly returns varied with how returns over longer periods varied, which is a tidy way of asking whether moves pile up in the same direction more often than chance allows. They do. For US stocks from 1962 to 1985, the random walk model was, in their words, “strongly rejected”. In 1999 they turned the work into a book whose title teased Malkiel’s, A Non-Random Walk Down Wall Street.
The second crack was momentum. In 1993, Jegadeesh and Titman found that stocks which had done well over the past 3 to 12 months tended to keep doing well over the following year, and the losers kept losing. The Nobel committee’s background paper calls it “a more serious challenge to informational efficiency”, and quotes Fama himself: “Of all the potential embarrassments to market efficiency, momentum is the primary one.”
My favourite version of this story comes from Cliff Asness, who wrote his thesis at Chicago under Fama. As he tells it in Lasse Pedersen’s Efficiently Inefficient, he found strong momentum in stock returns and was nervous about telling a professor who was “a big believer in efficient markets”. He fully expected to be sent back to the drawing board. Fama said, “If it is in the data, pursue it!” That is about as gracious as anyone can be about evidence against their own life’s work.
In 2010 I pointed to three things in price that are not random: trend, seasonality and cycles. Perry Kaufman adds a statistical reason in Trading Systems and Methods. Prices do not have a normal distribution. Their fat tails show “much longer runs than can be explained by a normal distribution”, and a trend is exactly that, a run longer than a fair coin should produce.
Are chart patterns just faces in the clouds?
On 7 June 2020, a trader on Reddit’s r/stocks asked whether support and resistance were just an illusion, and then ran an experiment. They used a spreadsheet to flip a virtual coin, with heads as a step up and tails as a step down. The chart showed what looked like a support level and a trading range. It was pure chance. If the random walk is true, they wrote, “technical traders are basically Captain Hindsights.”
They have a point. Harry Roberts, a statistician, showed the same thing in 1959, and his random-walk charts displayed head-and-shoulders tops, triangles, triple bottoms and trend channels. In Evidence-Based Technical Analysis (2007), David Aronson describes what happened when expert chartists were shown real charts mixed with random ones. They were “no more accurate at telling the real from the fake than a guess”. Aronson then tried it on his own graduate students, straight after a course in technical analysis, and their accuracy was “consistent with guessing”.

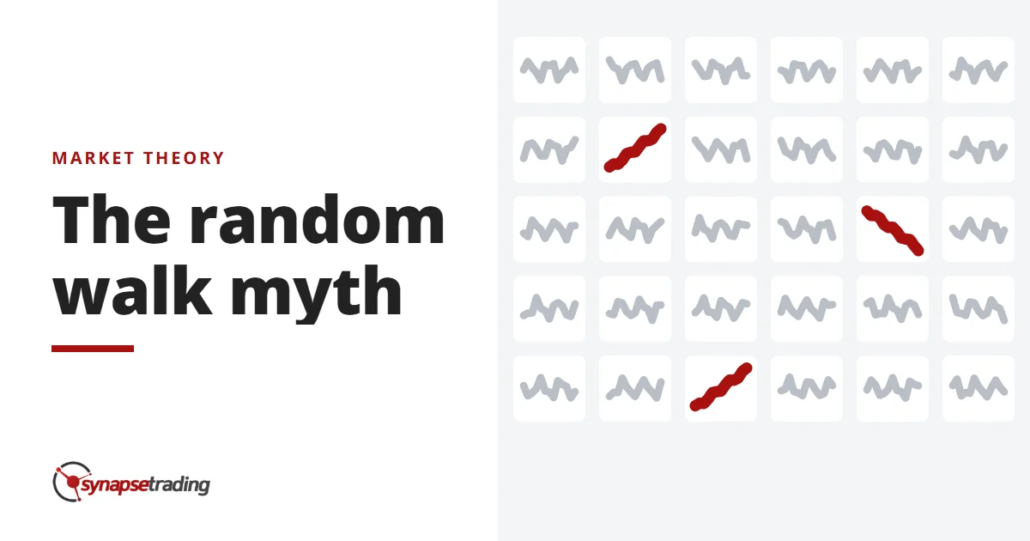
The Random Walk Myth – Can you see the pattern here amid the “randomness”?
There is a psychology lesson underneath this, and it is the warning I did not have in 2010. When people are asked to imagine a run of coin tosses, they picture far more back-and-forth than real chance produces. Real randomness streaks. Six heads in a row is exactly as likely as heads, tails, heads, tails, heads, tails. Only the second one looks random to us. So a random chart throws up streaks that the eye reads as trends, and the brain happily fills in a story about buyers, sellers and smart money that never happened. Murphy’s illusion of randomness has a twin, the illusion of pattern. Practice at chart reading cures the first one far more easily than the second.
The theory’s defenders also have a fair point about money. In the same 2003 paper, Malkiel argued that the momentum in these studies was statistically real but “extremely small”, too small to beat buy-and-hold once you pay trading costs. He noted that momentum strategies did well in some periods of the late 1990s and then lost heavily in 2000. Lo and MacKinlay’s own rejections came largely from small stocks, which are the costliest to trade. A pattern can be real on paper and still be wiped out by spreads and commissions.
So where does that leave a chart reader? The market is not a pure random walk, and that is now in the textbooks. But your eyes are a poor judge of which patterns are real. The fair test of any chart idea is a written rule, applied the same way across many trades, with the losses counted alongside the wins.
How do you trade a market that is half random?
In my weekly outlook on 20 November 2025, I talked about gold after a sharp correction. I had expected it to consolidate and dip again, it bounced instead, and then it fell back once more. I told viewers it was “somewhat unpredictable price action”, with “large moves in either direction”, which signalled “quite a bit of uncertainty”. So rather than guess, I said I would prefer to see either a sideways consolidation first or a deeper correction before getting involved.
That is the random walk theory put to use. When price is bouncing around with no structure, it really is close to a coin flip, and a coin flip is a poor place to risk money. When a trend is in place, the odds tilt a little. A small tilt, repeated over many trades with the losses kept small, is all a swing trader needs.
On 24 March 2026, I described the same habit as “a strategic waiting game”, rather than “trying to chase the market or guess what is going to happen in the news”. Waiting is boring. Boredom tempts you to trade anyway. But the waiting is how you avoid paying the market for its noise.
Personally, I treat the random walk theory as a humility check. Tomorrow’s candle is mostly noise. No single trade proves anything. And fear and greed feel far louder on a five-minute chart than they look on a weekly one. If you want to see how I tell a trending market from a choppy one, I wrote about it in trend vs range, and the four strategy types I tag my trades with are in types of trading strategies.
Reading a half-random market every day is easier with a short routine, and the free 15-minute swing trader checklist is mine.
FAQ
Is the random walk theory true?
Partly. Over days and weeks, price changes are close to unpredictable, and the research behind that is strong. But studies such as Lo and MacKinlay (1988) and Jegadeesh and Titman (1993) found more persistence than a pure random walk allows, and the 2013 Nobel committee said the broad course of prices over three to five years is “quite possible to foresee”.
Who came up with the random walk theory?
The idea goes back to Bachelier’s Théorie de la spéculation in 1900. Fama tested it in the 1960s and pulled the research together in 1970, and Burton Malkiel’s A Random Walk Down Wall Street followed in 1973.
What is the difference between the random walk theory and the efficient market hypothesis?
The random walk theory says successive price changes are independent. The efficient market hypothesis says prices already reflect available information, and its weak form says you cannot systematically beat the market with past prices. They are close cousins, and both say chart reading should not work.
Does the random walk theory mean technical analysis is useless?
It means chart reading by eye is unreliable, because people see patterns even in coin-flip charts. A rule tested over many trades, with costs and losses counted, is a fairer test than the eye.
Can anyone beat a market that is close to random?
Perry Kaufman points to trading strategies that have worked for upwards of 40 years. Malkiel’s reply is that the edges in academic studies are small and trading costs eat much of them. Both can be true, which is why low costs and small losses matter more than any single pattern.
Have you ever spotted a pattern on a chart that turned out to be noise, or tried the coin-flip test yourself? Let me know in the comments.
If you are new to charts, my free trading guides start from the basics, and What Is Technical Analysis? explains how chart reading works. Aronson’s tests are covered in my summary of Evidence-Based Technical Analysis.
And if you want a routine that trades the structure and skips the daily noise, grab the free 15-minute swing trader checklist.
About the author. Spencer Li is The 15-Minute Trader and the founder of Synapse Trading. He is a Certified Financial Technician (CFTe) with 15+ years of trading, run from 70+ countries. He holds a B.Acc and B.BM from SMU. Every trade he takes is public, dated, losses left in. He teaches rules-based swing trading in 15 minutes a day, one system for any market.
Education, not financial advice. Synapse Trading is not licensed by MAS to advise on investment products. Trading carries risk of loss, and past performance is not indicative of future results.
Want the daily routine? Enter your email for the free 15-Minute Swing Trader's Checklist.
Free 5-page PDF, then occasional trading emails. Education only, not financial advice. Unsubscribe anytime. Kit stores your email in the US: see our privacy policy.
Want to learn the full method? The Trading Mastery Program teaches the 4 strategies I have traded since 2011. It suits beginners and experienced traders.
Rather follow the trades as they happen? Daily Trading Signals is our Telegram channel: my trade ideas with entry, stop and exit, and every trade is public.
Questions about this post? Ask in the free Telegram channel →
Educational content only, not personalised financial advice. Trading carries risk, including loss of capital. Past performance is not indicative of future results. Synapse Trading is not licensed or regulated by MAS.

