• Link to Facebook
  • Link to X
  • Link to Instagram
  • Link to Youtube
  • Link to LinkedIn
  • Link to Mail
Synapse Trading
  • Home
  • About
    • My Background
    • My Trading Journey
    • My Travel Log
    • Media & Interviews
  • Mentoring
    • Trading Mastery Program
    • Results & Testimonials
  • Signals
    • Telegram (Free to join!)
    • Daily Trading Signals
    • Daily Trading Signals (Results)
  • Resources
    • Free Trading Guides
    • Tools & Resources
    • Blog & Infographics
  • Contact
    • Contact Us
    • Partnership Opportunities
  • Click to open the search input field Click to open the search input field Search
  • Menu Menu

Market analysis, insights and trading ideas on various markets and products!

The Synapse Network

Bullish Gapping Play & Bearish Gapping Play

Market Analysis

Bullish Gapping Play

Definition

A bullish gapping play structure is comprised of three Japanese candlesticks.

The first two are small and bullish (green), indicating hesitation.

The opening of the third candlestick occurs with a bullish gap, and this candlestick must be large.

Illustration

bullish caping

Characteristic

A bullish gapping play follows a period of hesitation, represented by small candlesticks, after a significant increase characterized by several large green Japanese candlesticks.

The small candlesticks before the gap must remain in the upper area of the last large candlestick.

Significance

A bullish gapping play is a continuation pattern, serving as a strong signal that the bullish movement will continue.

Note

A bullish gapping play is considered stronger if the candlestick before the gap is red.

Invalidation

If the next candlestick is not bullish or does not open with a bullish gap, the bullish gapping play structure is invalidated.

Bearish Gapping Play

Definition

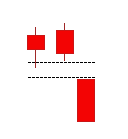
A bearish gapping play structure is comprised of three Japanese candlesticks.

The first two are small and bearish (red), indicating hesitation.

The opening of the third candlestick occurs with a bearish gap, and this candlestick must be large.

Illustration

bearish gaping

Characteristic

A bearish gapping play follows a period of hesitation, represented by small candlesticks, after a significant decline characterized by several large red Japanese candlesticks.

The small candlesticks before the gap must remain in the lower zone of the last large candlestick of the descent.

Significance

A bearish gapping play is a continuation pattern, serving as a strong signal that the bearish movement will continue.

Note

A bearish gapping play is considered stronger if the candlestick before the gap is green.

Invalidation

If the next candlestick is not bearish or does not open with a bearish gap, the bearish gapping play structure is invalidated.

Concluding Thoughts

The bullish and bearish gapping play patterns are important continuation signals in technical analysis, highlighting potential ongoing trends after brief periods of hesitation.

These patterns gain additional strength if the candlestick preceding the gap is of the opposite color, suggesting a failed attempt to reverse the trend.

However, traders should always be vigilant and confirm the pattern with subsequent candlestick behavior, as invalidation occurs if the next candlestick does not follow the expected direction with a gap.

As with all technical indicators, it’s advisable to use these patterns in combination with other analytical tools for a well-rounded trading strategy.

0 Comments/by The Synapse Network
https://synapsetrading.com/wp-content/uploads/2019/10/logo.jpg 0 0 The Synapse Network https://synapsetrading.com/wp-content/uploads/2019/10/logo.jpg The Synapse Network2023-08-18 16:55:182024-08-19 18:24:18Bullish Gapping Play & Bearish Gapping Play
Spencer Li

Weekly Market Wrap: Moody’s Downgraded Ten Regional Banks

Market Analysis
Thumbnail banner weekly market wrap x3

Thumbnail banner weekly market wrap x3

For subscribers of our “Daily Trading Signals”, we now also include a “Weekly Market Report”, where we provide a weekly deep-dive on the market, including fundamentals, technicals, economics, and portfolio management:

Click here for last week’s market report (7 August 2023)
Click here to subscribe for the latest market report (14 August 2023)
Click here to see the archives of all our past market reports

Market Recap & Upcoming Week

Last week witnessed significant tremors in the banking sector as Moody’s made the call to downgrade ten regional banks, eliciting concerns about the banking industry’s robustness in light of escalating interest rates and previous bank defaults. This decision, causing a roughly 3% drop in major bank indices, stemmed from factors such as deteriorating assets and the Federal Reserve’s moves to combat inflation.

While these banks maintain their investment-grade status, whispers from Moody’s hint at re-evaluating ratings for other colossal institutions. This sparked apprehensions about depreciating bonds, heightened withdrawal rates, and wary investors. Conversely, some analysts argue that the sector remains on solid ground, considering the recent stock downturn as a transient repercussion.

For last week’s CPI data, July’s cooling inflation hinted at the Federal Reserve rethinking rate hikes.

For this coming week, major retailers like Walmart, Home Depot, and Target are set to release their reports, providing insights into the retail sector’s performance. Moreover, the Census Bureau will unveil July’s nationwide retail sales data on Tuesday, shedding light on the robustness of consumer spending. Meanwhile, all eyes will be on the Federal Reserve come Wednesday when they disclose the minutes from the recent FOMC meeting, potentially hinting at the future course of monetary policy.

The housing market is also in the spotlight with updates on building permits, July housing starts, and the NAHB’s Housing Market Index for August, which will offer a comprehensive picture of the real estate scenario. To top it off, brace yourself for significant global economic insights as we receive inflation and GDP data from powerhouses like the U.K., eurozone, and Japan. It’s a week packed with key indicators that could shape market sentiments, so stay informed and vigilant!


Daily Trading Signals (Highlights)

We cover 3 main markets with a total of 200+ counters, so we will never run out of trading opportunities:

  • Forex, CFDs, commodities, bonds
  • US stocks, ETFs, global stock indices
  • Cryptocurrencies, crypto indices

By covering a broad range of markets, we can focus our attention (and capital) on whichever market currently gives the best returns.

Subscribe for real-time alerts and weekly reports:
👉🏻 https://synapsetrading.com/daily-trading-signals


Trading Signals AAPL 090823

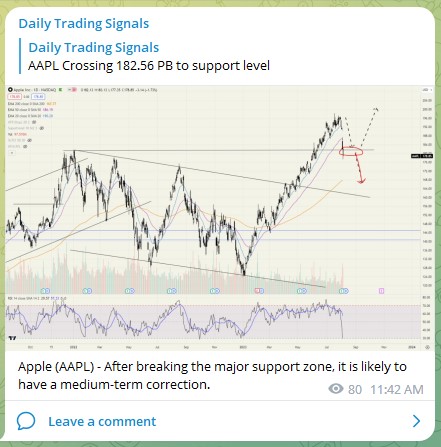
Apple (AAPL) – After breaking the major support zone, it is likely to have a medium-term correction.


Trading Signals AUDUSD 090823

AUDUSD – After breaking the major support, price momentum is currently bearish.

We can ride the momentum downwards for now (short-term trade), but if prices make a sudden U-turn back into the range, be prepared to do range trading.


Trading Signals US100 090823

NASDAQ 100 (US100) – Prices are having a pullback to support, might be a good opportunity for a short-term buy trade, if there is a bullish trigger.


Trading Signals USDCNY 090823

USDCNY – Prices have rebounded off support, and may soon break new highs.


Trading Signals USDSGD 090823

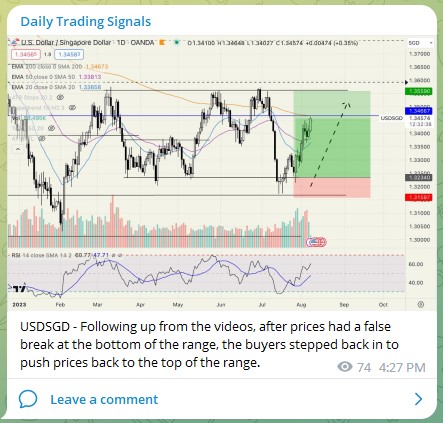
USDSGD – Following up from the videos, after prices had a false break at the bottom of the range, the buyers stepped back in to push prices back to the top of the range.


0 Comments/by Spencer Li
https://synapsetrading.com/wp-content/uploads/2023/05/Thumbnail-banner-weekly-market-wrap-x3.png 630 1200 Spencer Li https://synapsetrading.com/wp-content/uploads/2019/10/logo.jpg Spencer Li2023-08-13 20:25:162023-08-14 23:01:46Weekly Market Wrap: Moody’s Downgraded Ten Regional Banks
The Synapse Network

Best Forex Trading Entries to Take a Trade Position

Market Analysis

A forex entry point is the specific price level or position at which a trader decides to enter a trade, either by buying or selling a currency pair. Determining the right entry point is crucial for successful trading, as it directly impacts the potential profitability and risk of the trade. However, choosing an entry point can be complex due to the various factors that influence forex market movements. Below, we explore how to identify effective forex entry points through three popular strategies: trend channels, candlestick patterns, and breakouts.

When is the Best Time to Enter a Forex Trade?

The ideal time to enter a forex trade depends on your trading strategy and style. Different approaches suit different market conditions and trader preferences. The following are three commonly used strategies for determining entry points:

Forex Entry Strategy #1: Trend Channels

Trend channels are a fundamental tool in technical analysis, used to identify support and resistance levels within a trending market. In an uptrend, for example, the price typically makes higher highs and higher lows, forming a channel. Traders can use these channels to establish a bias for buying at support (the lower boundary of the channel) and taking profit at resistance (the upper boundary). If the price breaks through these key levels, it could signal a potential breakout or reversal in the trend.

Pros:
– Clear visual representation of market trends.
– Provides defined entry and exit points.
– Effective in trending markets.

Cons:
– May not work well in choppy or sideways markets.
– Requires ongoing market monitoring to adjust channels.
– Breakouts can sometimes lead to false signals.

Forex Entry Strategy #2: Candlestick Patterns

Candlestick patterns are powerful tools for identifying potential entry points in the forex market. Patterns such as engulfing, shooting star, and hammer are frequently used by traders to signal reversals or continuations. For instance, the hammer candlestick pattern often indicates a potential reversal in a downtrend. However, traders should not rely solely on the pattern itself. A confirmation, such as a close above the hammer candle, strengthens the validity of the entry point, reducing the risk of false signals.

Pros:
– Provides early signals for potential market reversals.
– Easy to identify with practice.
– Can be combined with other indicators for stronger signals.

Cons:
– Requires confirmation to avoid false signals.
– May not be effective in all market conditions.
– Some patterns can be subjective and open to interpretation.

Forex Entry Strategy #3: Breakouts

Breakout trading is a widely used strategy that involves identifying key levels of support and resistance and entering trades when the price breaks through these levels. Breakouts can signal a strong move in the direction of the breakout, making this strategy particularly appealing to novice traders. For instance, if the price breaks below a key support level with increased volume, this may indicate a strong bearish trend, prompting a sell entry. Some traders prefer to wait for a confirmation candle to close outside the key level before entering the trade to reduce the risk of a false breakout.

Pros:
– Simple and straightforward strategy, ideal for beginners.
– Effective in volatile markets where significant price movements occur.
– Can capture strong directional moves.

Cons:
– False breakouts can result in losses.
– Requires quick decision-making and market monitoring.
– May involve higher risk in volatile markets.

Popular Forex Entry Indicators

Forex entry indicators are often used in conjunction with the strategies mentioned above to enhance decision-making. Here are some of the most popular forex entry indicators and how they are applied:

Entry IndicatorUse
RSIIdentifies overbought and oversold conditions. Most effective in range-bound and trending markets.
Moving Average (MA) CrossoverTraders look for crossovers between short and long period MAs to generate entry signals.
MACDWorks best in range or trending markets, with crossover points used to signal entries in the direction of the trend.

Concluding Thoughts

Identifying the right forex entry point is a critical aspect of successful trading. Whether you prefer using trend channels, candlestick patterns, or breakout strategies, it’s essential to choose an approach that aligns with your trading style and risk tolerance. Combining these strategies with popular entry indicators can further refine your entry points, helping to increase your chances of making profitable trades. Remember, practice and experience are key to mastering these techniques and achieving consistent results in the forex market.

0 Comments/by The Synapse Network
https://synapsetrading.com/wp-content/uploads/2019/10/logo.jpg 0 0 The Synapse Network https://synapsetrading.com/wp-content/uploads/2019/10/logo.jpg The Synapse Network2023-08-11 05:03:092024-08-11 05:07:43Best Forex Trading Entries to Take a Trade Position
The Synapse Network

Currency Pair Correlations & Characteristics

Market Analysis

Currency pairs represent the value relationship between two currencies. In the forex market, currencies are always traded in pairs because when you buy or sell one currency, you are simultaneously selling or buying another. For example, when you buy foreign currency for a trip abroad, you pay in U.S. dollars (USD) and receive the foreign currency in exchange.

Each currency pair consists of two components: the base currency and the quote currency. The base currency is listed first (on the left), and the quote currency is listed second (on the right). The price of a currency pair indicates how much of the quote currency is required to purchase one unit of the base currency.

For instance, in the EUR/USD currency pair, the euro (EUR) is the base currency, and the U.S. dollar (USD) is the quote currency. If the price of the pair is 1.1000, it means that 1.10 U.S. dollars are needed to buy one euro, or conversely, one euro is worth 1.10 U.S. dollars.

Understanding Currency Pairs

The forex market operates 24 hours a day, five days a week, providing opportunities for highly leveraged trading with lower margin requirements compared to equity markets. However, it’s important to be familiar with the most traded currency pairs to navigate this market effectively.

Among the most traded currency pairs are:

1. EUR/USD (Euro/US Dollar): Known as “Fiber,” this pair is the most traded in the forex market, reflecting the prominence of the European Union and U.S. economies. It accounts for over 22% of the market share.

2. USD/JPY (US Dollar/Japanese Yen): Referred to as “Gopher,” this pair is the second most actively traded, with a market share of 13.5%. It is sensitive to political sentiment between the U.S. and Japan and responds to changes in Japanese interest rates.

3. GBP/USD (British Pound/US Dollar): Known as “Cable,” this pair represents about 9.5% of the market share. It is influenced by the economic health of the U.K. and the U.S., and it tends to correlate positively with the EUR/USD.

4. USD/CNY (US Dollar/Chinese Yuan): This pair represents the relationship between the U.S. dollar and the Chinese yuan, with a market share of 6.6%. The U.S.-China trade relationship significantly impacts this pair.

5. USD/CAD (US Dollar/Canadian Dollar): Known as “Loonie,” this pair has a market share of 5.5%. The price of oil, a major Canadian export, plays a crucial role in determining the value of this pair.

6. AUD/USD (Australian Dollar/US Dollar): Called the “Aussie,” this pair holds 5.1% of the market share. The value of the Australian dollar is closely tied to the country’s export-driven economy.

How Currency Pair Prices Are Determined

The prices of currency pairs are influenced by various factors, including the economic health of the involved countries, interest rates, trade relationships, and political stability. For example, if the EUR/USD pair is priced at 1.15, it means that 1.15 U.S. dollars are required to purchase one euro. If the price rises to 1.20, the euro has appreciated relative to the U.S. dollar, meaning it now costs more dollars to buy a euro.

Currency pair prices fluctuate constantly due to the high volume of orders in the forex market, particularly for major pairs like EUR/USD and USD/JPY.

Concluding Thoughts

Currency pairs are the backbone of forex trading, representing the value relationship between two currencies. Understanding how these pairs work, including the factors that influence their prices, is essential for successful trading. The most traded currency pairs, such as EUR/USD and USD/JPY, offer high liquidity and tight spreads, making them popular choices for traders. However, traders should stay informed about economic and political events that can impact currency pair values to make well-informed decisions in the dynamic forex market.

0 Comments/by The Synapse Network
https://synapsetrading.com/wp-content/uploads/2019/10/logo.jpg 0 0 The Synapse Network https://synapsetrading.com/wp-content/uploads/2019/10/logo.jpg The Synapse Network2023-08-11 04:32:342024-08-11 04:33:46Currency Pair Correlations & Characteristics
The Synapse Network

When is the Best Time to Trade Forex? (Top 3 Forex Trading Hours)

Market Analysis

Many first-time forex traders dive into the market with enthusiasm, tracking various economic calendars and trading aggressively on every data release. The 24-hour, five-days-a-week nature of the forex market seems like an endless opportunity to trade, but this approach can quickly deplete a trader’s resources and lead to burnout, even for the most dedicated individuals. Unlike Wall Street, which operates on regular business hours, the forex market runs on the business hours of four different global trading hubs, making it active all day and night.

So, how can traders avoid staying up all night and still capitalize on the market? Understanding the market hours and setting appropriate trading goals can significantly increase a trader’s chances of success within a manageable schedule.

The Forex Market Hours of Operation

Let’s start with an overview of the four major forex markets, listed in Eastern Standard Time (EST):

New York

New York (open 8 a.m. to 5 p.m.) is the second-largest forex platform globally, heavily monitored by foreign investors since the U.S. dollar is involved in 90% of all trades. Movements in the New York Stock Exchange (NYSE) can significantly impact the dollar, as mergers and acquisitions can instantly alter its value.

Tokyo

Tokyo, Japan (open 7 p.m. to 4 a.m.), is the first Asian trading center to open and handles the bulk of Asian trading, slightly ahead of Hong Kong and Singapore. Currency pairs such as USD/JPY, GBP/USD, and GBP/JPY are particularly active during this time, with the USD/JPY being a key pair to watch due to the Bank of Japan’s influence on the market.

Sydney

Sydney, Australia (open 5 p.m. to 2 a.m.), marks the official start of the trading day. While it is the smallest of the major markets, it sees significant activity when markets reopen on Sunday afternoon, as individual traders and financial institutions regroup after the weekend break.

London

London, Great Britain (open 3 a.m. to noon), is the global hub of currency trading, accounting for roughly 43% of global forex activity. London also significantly impacts currency fluctuations due to the presence of the Bank of England, which sets interest rates and controls GBP monetary policy. Forex trends often originate in London, making it a key market for technical traders.

The Best Hours for Forex Trading

Forex trading’s uniqueness lies in its continuous operation from 5 p.m. EST on Sunday to 5 p.m. on Friday. However, not all hours are equally favorable for trading. The optimal time to trade is when the market is most active, typically during overlaps between open markets. This heightened activity leads to greater currency pair fluctuations and increased trading opportunities.

When only one market is open, currency pairs may be confined to a narrow pip spread, around 30 pips of movement. However, when two markets overlap, movement can easily exceed 70 pips, especially during significant news releases.

Overlaps in Forex Trading Times

The best trading times occur during market overlaps, which provide higher price ranges and more trading opportunities:

– U.S./London (8 a.m. to noon): This overlap is the most active, accounting for more than 70% of all trades. The U.S. dollar and euro are the most traded currencies during this period, making it the ideal time to trade due to high volatility.

– Sydney/Tokyo (2 a.m. to 4 a.m.): While not as volatile as the U.S./London overlap, this period still offers opportunities with increased pip fluctuation. The EUR/JPY pair is particularly active during this time.

– London/Tokyo (3 a.m. to 4 a.m.): This overlap sees the least activity, as it only lasts for one hour and occurs when most U.S.-based traders are not active.

Impact of News Releases on Forex Markets

While understanding market hours and overlaps is essential, news releases also play a crucial role in forex trading. Major economic announcements can significantly impact currency values, even during typically slow trading periods.

Key news events to monitor include:

– Interest rate decisions by central banks, as higher interest rates often attract global investment, strengthening the currency.

– CPI data, which measures inflation and can influence central bank policy.

– Trade deficits, indicating cross-border capital flows that affect exchange rates.

– Consumer consumption, a major driver of economic growth in the U.S. and globally.

– Central bank meetings, where future interest rate moves may be hinted at.

– Consumer confidence, which impacts spending and overall economic health.

– GDP data, reflecting the total economic output of a country.

– Unemployment rates, as lower unemployment typically correlates with stronger economic growth and a stronger currency.

– Retail trade data, which indicates consumer spending and drives economic growth.

Why Do Forex Markets Trade Around the Clock, but Not Stock Markets?

Forex markets operate “24/7” because different exchanges worldwide trade the same currency pairs. In contrast, stock exchanges typically list and trade shares within their own country, so international stock markets are not trading the same stocks simultaneously. Even with foreign stocks listed in the U.S. as ADRs, these shares remain closed during certain hours when the foreign shares are open, and vice versa.

Why Is Forex Liquidity Important?

Liquidity refers to how easily an asset can be bought or sold at a fair price. In highly liquid markets, the bid/ask spread is narrower, and larger trades can be executed without significantly moving the market. In contrast, illiquid markets have wider spreads and less depth, making it harder to trade without impacting prices. Liquid currency pairs are those with high trading volumes and activity.

Which Are the Most Liquid Currencies?

The most traded currencies globally include the U.S. Dollar (USD), Euro (EUR), Japanese Yen (JPY), British Pound (GBP), Australian Dollar (AUD), Canadian Dollar (CAD), and Swiss Franc (CHF). The four major currency pairs are EUR/USD, USD/JPY, GBP/USD, and USD/CHF.

Concluding Thoughts

To maximize forex trading success, it’s important to take advantage of market overlaps and closely monitor news releases. By trading during more volatile periods and keeping an eye on economic data, both part-time and full-time traders can create a schedule that allows them to capitalize on opportunities without feeling overwhelmed by the 24/5 nature of the forex market.

0 Comments/by The Synapse Network
https://synapsetrading.com/wp-content/uploads/2019/10/logo.jpg 0 0 The Synapse Network https://synapsetrading.com/wp-content/uploads/2019/10/logo.jpg The Synapse Network2023-08-10 06:16:372024-08-10 06:18:15When is the Best Time to Trade Forex? (Top 3 Forex Trading Hours)
Page 14 of 36«‹1213141516›»

Free Trading Guides

Free Trading Guides

Blog Categories

  • Beginner's Guide
  • Blockchain & Crypto
  • Book Summaries
  • Economics & News Trading
  • Investing & Portfolio Management
  • Living Your Best Life
  • Market Analysis
  • Markets & Products
  • News & Events
  • Promotions
  • Risk & Money Management
  • Stock Trading
  • Technical Analysis & Price Action
  • Testimonials
  • Tools & Resources
  • Trading Psychology
  • Trading Strategies
  • Trading Tips
  • Travel & Lifestyle

Free Trading Guides

Free Trading Guides

Contact Us

Synapse Trading Pte Ltd
Registration No. 201316168H

Whatsapp: +65-8897-1204
Telegram: @iamrecneps
Email: info@synapsetrading.com

Links

Disclaimer
Privacy policy
Terms & Conditions
Contact us
Partnerships

© 2012-2024 Synapse Trading | All rights reserved | - powered by Enfold WordPress Theme
  • Link to Facebook
  • Link to X
  • Link to Instagram
  • Link to Youtube
  • Link to LinkedIn
  • Link to Mail
Scroll to top Scroll to top Scroll to top