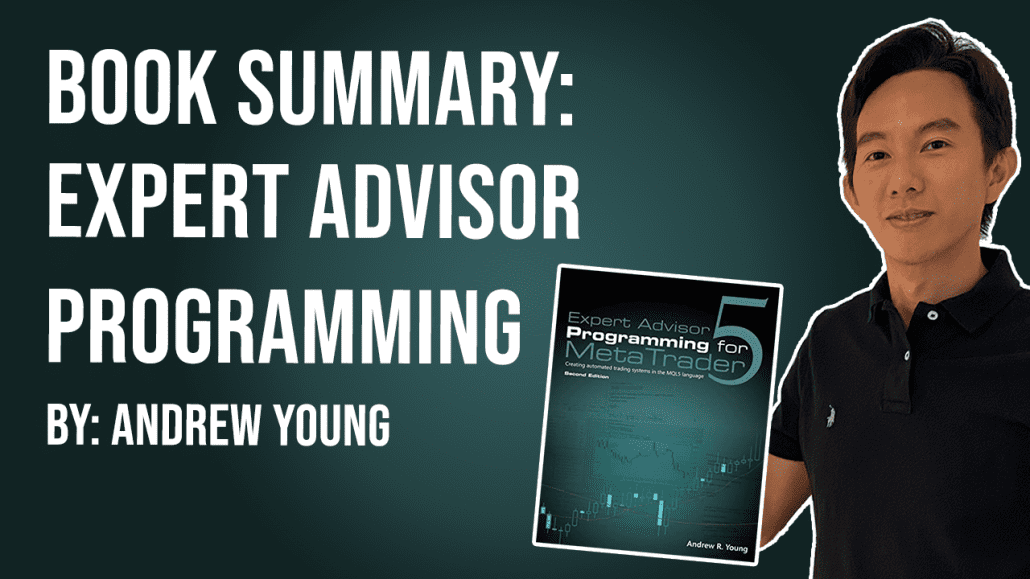
thumbnail Book Summary Expert Advisor Programming by Andrew Young

thumbnail Book Summary Expert Advisor Programming by Andrew Young

“Expert Advisor Programming” is a comprehensive guide to creating automated trading systems for the MetaTrader 4 platform.

Written by Andrew Young, a seasoned programmer and trader, the book provides a step-by-step guide to creating profitable and reliable expert advisors.

Whether you’re a novice trader or a seasoned professional, this book will give you the tools you need to take your trading to the next level.

In this blog post, I will share all about this book and the author, key ideas from the book, and how you can apply it to your own trading & investing journey.


About the Author

Andrew Young is a professional trader and programmer with over a decade of experience in the financial markets.

He has a background in computer science and has worked as a software developer for several large corporations.

He has also been involved in the development of trading strategies and automated trading systems for various financial institutions.

He is the author of several books on trading and programming, and is a regular speaker at trading and programming conferences.

What is the Book About?

The book is divided into three parts. The first part covers the basics of the MetaTrader 4 platform, including the MQL4 programming language and the MetaEditor development environment.

The second part is focused on the development of expert advisors, providing a detailed explanation of the process, including how to create and test a strategy, how to optimize parameters, and how to implement risk management.

The third part provides tips and tricks for debugging and troubleshooting expert advisors, as well as strategies for backtesting and forward testing.

The main message of the book is that expert advisor programming is a powerful tool for traders, but it requires a solid understanding of the markets and the programming language.

10 Key Ideas from the Book

  1. Understanding the MetaTrader 4 platform and the MQL4 programming language is essential for developing expert advisors.
  2. Developing a profitable trading strategy is the first step in creating an expert advisor.
  3. Optimization should be done with caution, as overfitting can lead to poor performance.
  4. Risk management is an important aspect of expert advisor development and should be integrated into the system.
  5. Backtesting and forward testing are crucial for evaluating the performance of an expert advisor.
  6. Debugging and troubleshooting expert advisors can be a time-consuming process, but it is necessary to ensure that the system is working correctly.
  7. The use of functions and libraries can improve the efficiency and maintainability of expert advisors.
  8. The use of external data sources can enhance the performance of expert advisors.
  9. The use of custom indicators can improve the signals generated by expert advisors.
  10. The use of optimization and neural networks can improve the performance of expert advisors.

10 Ways to Apply the Teachings

  1. Develop a profitable trading strategy by analyzing the markets and identifying patterns and trends.
  2. Optimize the parameters of the strategy by testing different combinations and selecting the best one.
  3. Implement risk management measures such as stop loss and take profit to protect the system from large losses.
  4. Use backtesting and forward testing to evaluate the performance of the expert advisor and identify potential issues.
  5. Use debugging and troubleshooting techniques to fix any errors or issues that arise during the development process.
  6. Use functions and libraries to improve the efficiency and maintainability of the expert advisor.
  7. Use external data sources to enhance the performance of the expert advisor.
  8. Use custom indicators to improve the signals generated by the expert advisor.
  9. Use optimization and neural networks to improve the performance of the expert advisor.
  10. Continuously monitor the performance of the expert advisor and make adjustments as necessary.

Other Important Points from the Book

  1. The book is focused on the MetaTrader 4 platform, but the concepts and methods can be applied to other trading platforms as well.
  2. The book is geared towards traders and programmers who have a basic understanding of trading and programming, but it can also be useful for beginners with the willingness to learn.
  3. The book primarily covers the development of expert advisors for forex trading, but the concepts and methods can also be applied to other financial markets.
  4. The book does not cover the use of Machine learning or AI in developing expert advisors.

Concluding Thoughts

Overall, “Expert Advisor Programming” is a comprehensive guide for traders and programmers looking to create automated trading systems for the MetaTrader 4 platform.

The book provides a step-by-step guide to creating profitable and reliable expert advisors and covers the important aspects of development such as strategy creation, optimization, risk management, and debugging. It provides a clear understanding of how to create and use expert advisors, and it can help traders to automate their trading process.

The book is suitable for traders and programmers who have a basic understanding of trading and programming, but it can also be useful for beginners with the willingness to learn.

I would recommend this book to traders who are looking to take their trading to the next level, and to programmers who want to learn how to create profitable and reliable expert advisors.

Now that I have covered all the key learning points of this book, would you consider adding it to your reading list?

For those who have already read it, what are some of your key learning points?

Let me know in the comments below!


best books on trading and investing

If you would like to find more book summaries and recommendations, also check out: “Best Investing & Trading Books of All Time”

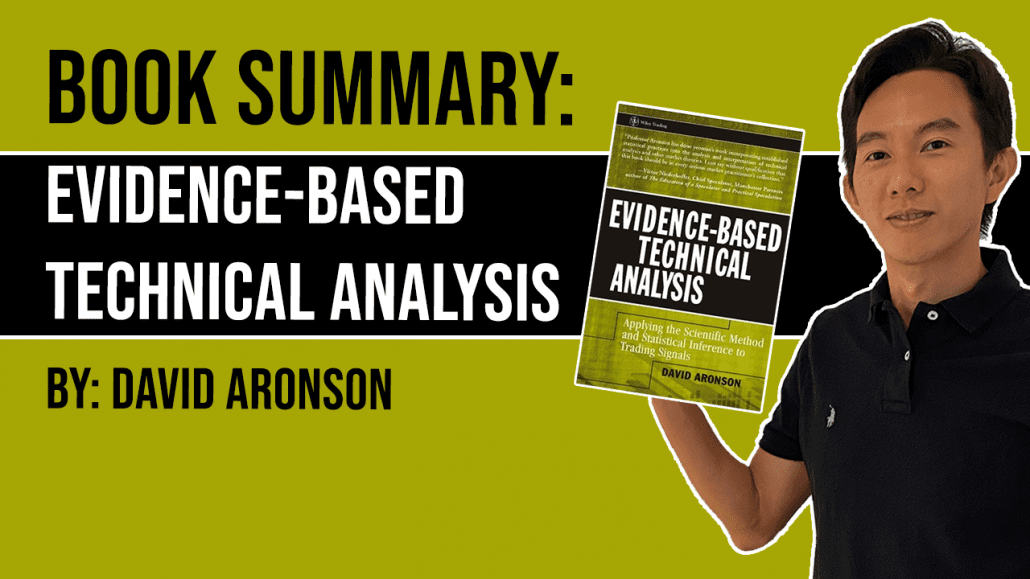
thumbnail Book Summary Evidence Based Technical Analysis Applying the Scientific Method and Statistical Inference to Trading Signals by David Aronson

thumbnail Book Summary Evidence Based Technical Analysis Applying the Scientific Method and Statistical Inference to Trading Signals by David Aronson

“Evidence-Based Technical Analysis: Applying the Scientific Method and Statistical Inference to Trading Signals” is a groundbreaking book that challenges the traditional approach to technical analysis.

Written by David Aronson, a renowned statistician and expert in the field of quantitative finance, this book provides a fresh perspective on technical analysis, using statistical evidence to support its claims.

It’s a must-read for anyone who wants to gain a deeper understanding of the markets and improve their trading strategies.

In this blog post, I will share all about this book and the author, key ideas from the book, and how you can apply it to your own trading & investing journey.


About the Author

David Aronson is a statistician and quantitative analyst who has been working in the field of finance for over 20 years.

He has a PhD in statistics from the University of Chicago and is a member of the American Statistical Association.

He is also the author of several books on quantitative finance, including “Evidence-Based Technical Analysis” and “An Introductory Guide to the Theory and Practice of Bayesian Inference in Finance”.

What is the Book About?

The book is about using scientific methods and statistical inference to improve the accuracy of technical analysis.

The main message of the book is that traditional technical analysis methods are based on subjective interpretations of charts and patterns, which can lead to inconsistent and unreliable results.

Aronson argues that by using statistical methods, traders can increase the accuracy and reliability of their predictions, making it a more effective tool for trading.

He provides a detailed explanation of the statistical methods and models used in the book and provides examples of how to apply them to real-world trading situations.

10 Key Ideas from the Book

  1. Traditional technical analysis methods are based on subjective interpretations of charts and patterns, which can lead to inconsistent and unreliable results.
  2. By using statistical methods, traders can increase the accuracy and reliability of their predictions.
  3. The book emphasizes the importance of using data to test hypotheses about trading strategies.
  4. Aronson explains how to use statistical methods such as hypothesis testing and Monte Carlo simulation to evaluate trading strategies.
  5. The book provides a detailed explanation of the various types of technical indicators, including moving averages and relative strength index.
  6. Aronson explains how to use Bayesian inference to update probability estimates based on new data.
  7. The book also covers the importance of risk management and the use of stop-loss orders to limit potential losses.
  8. Aronson provides a detailed explanation of how to use technical analysis in conjunction with other forms of market analysis, such as fundamental analysis and news analysis.
  9. The book also covers the importance of backtesting, which is the process of evaluating a trading strategy using historical data.
  10. Aronson explains how to use Excel and other software tools to implement the methods outlined in the book.

10 Ways to Apply the Teachings

  1. Use statistical methods to evaluate the accuracy and reliability of trading strategies.
  2. Use data to test hypotheses about trading strategies.
  3. Use Monte Carlo simulation to evaluate the potential outcomes of a trading strategy.
  4. Use Bayesian inference to update probability estimates based on new data.
  5. Incorporate risk management techniques, such as stop-loss orders, into your trading strategy.
  6. Use technical analysis in conjunction with other forms of market analysis, such as fundamental analysis and news analysis.
  7. Use backtesting to evaluate the performance of a trading strategy using historical data.
  8. Use Excel and other software tools to implement the methods outlined in the book.
  9. Incorporate the use of technical indicators in your trading strategy, such as moving averages and relative strength index.
  10. Continuously monitor and evaluate the performance of your trading strategies and make adjustments as needed.

Other Important Points from the Book

  1. The book is written for traders with a basic understanding of statistical methods, but it also includes a chapter that provides an introduction to statistical concepts for those who are new to the subject.
  2. The book is focused on using technical analysis for short-term trading and does not cover long-term investment strategies.
  3. The book is primarily focused on using technical analysis with stocks, but the concepts and methods can be applied to other markets as well.
  4. The book emphasizes the importance of using data to make informed decisions, but it also stresses the importance of understanding the limitations of data and the potential for errors.
  5. The book provides a detailed explanation of the statistical methods used, but it does not provide step-by-step instructions on how to implement them in software.

Concluding Thoughts

“Evidence-Based Technical Analysis” is a valuable resource for traders who want to improve the accuracy and reliability of their predictions.

The book provides a fresh perspective on technical analysis, using scientific methods and statistical inference to support its claims.

The author, David Aronson, is a renowned statistician and expert in the field of quantitative finance, his insights and the examples used in the book make the concepts easy to understand.

I would recommend this book to traders who are looking to improve their trading strategies and gain a deeper understanding of the markets.

It is also suitable for those who want to learn about using statistical methods in finance, but have a basic understanding of statistics.

Now that I have covered all the key learning points of this book, would you consider adding it to your reading list?

For those who have already read it, what are some of your key learning points?

Let me know in the comments below!


best books on trading and investing

If you would like to find more book summaries and recommendations, also check out: “Best Investing & Trading Books of All Time”
Thumbnail What is the FOMC Federal Open Market Committee Meeting and How to Trade it

One of the most important piece of news data for traders and investors is the FOMC meeting, so you probably have heard it many times on the news.

But what exactly do they discuss, and why is it so important?

The Federal Open Market Committee, or FOMC, is a powerful branch of the Federal Reserve System that plays a crucial role in shaping the U.S economy.

In this blog post, you’ll learn about the origin and responsibilities of the FOMC, how it operates, and how its decisions can impact traders and investors.

We’ll also explore how traders and investors use the information from the FOMC to make their investment decisions.


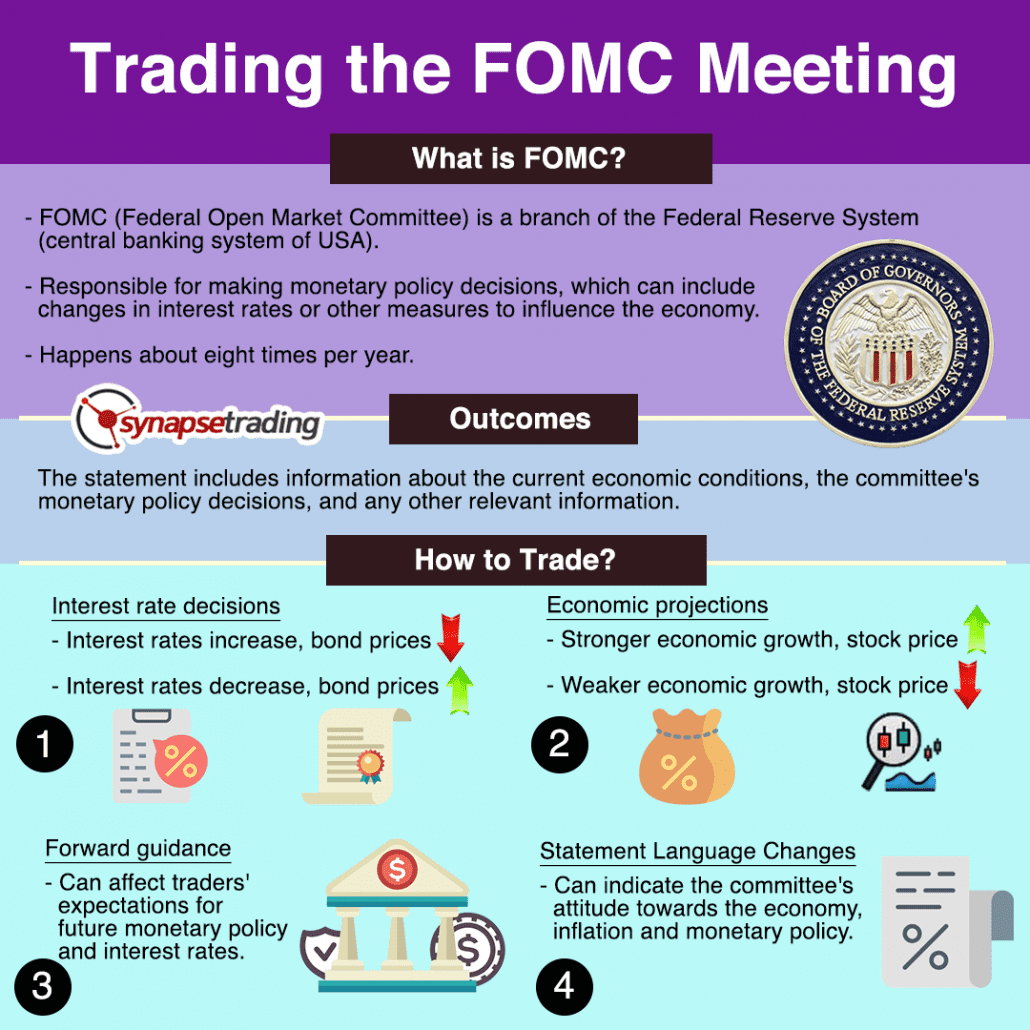
Infographic What is the FOMC Federal Open Market Committee Meeting and How to Trade it

What is the FOMC and its Origin?

The FOMC is a branch of the Federal Reserve System, which is the central banking system of the United States.

The FOMC was created by the Banking Act of 1935, which also created the Federal Reserve System.

The FOMC is responsible for making monetary policy decisions, which can include changes in interest rates or other measures to influence the economy.

The FOMC is made up of 12 voting members, including the seven members of the Board of Governors of the Federal Reserve System and five of the 12 Federal Reserve Bank presidents.

The Board of Governors is appointed by the President of the United States, subject to Senate confirmation, and serves for a 14-year term.

The five Reserve Bank presidents who serve on the FOMC are chosen by their respective Reserve Banks and serve one-year terms.

How Does the FOMC Operate?

The Federal Open Market Committee (FOMC) typically meets eight times per year, with meetings held about every six weeks.

Meetings are held on a schedule that is set well in advance.

The schedule of meetings can be found on the Federal Reserve’s website.

The meetings are held in Washington, D.C. and typically last two days.

What are the Outcomes of FOMC Meetings?

The outcomes of Federal Open Market Committee (FOMC) meetings are typically published in a statement released after the meeting.

The statement includes information about the current economic conditions, the committee’s monetary policy decisions, and any other relevant information.

The statement is closely watched by investors and market participants, as it provides insight into the committee’s thinking and can affect financial markets.

The FOMC statement typically includes the following information:

  • The current target range for the federal funds rate (the interest rate at which banks lend money to each other overnight)
  • The outcome of the vote, including any dissents
  • Economic projections, including the expected path of interest rates, GDP, unemployment rate, and inflation
  • An assessment of the current economic conditions and the balance of risks
  • Any other relevant information, such as changes to the statement language or the forward guidance.

The data published in the FOMC statement is not revised or updated after the meeting, but the committee releases new economic projections and updates the statement language at each meeting.

The committee also releases the minutes of the meeting three weeks after the meeting which provides more detailed information about the discussions and the reasoning behind the decisions.

How is this Data Relevant to Traders and Investors?

The data and information published by the FOMC is closely watched by traders and investors, as it provides insight into the committee’s thinking and can affect financial markets.

The statement and the economic projections released after the FOMC meetings can affect the direction of interest rates, and in turn, the value of stocks, bonds, and other financial assets.

Traders and investors typically use the information from the FOMC statements and economic projections to inform their investment decisions.

They pay attention to the current target range for the federal funds rate and any changes to it, as changes in interest rates can affect the value of bonds and other fixed-income securities.

They also pay attention to the economic projections, as they can provide insight into the committee’s view on the future performance of the economy and can affect the direction of stocks and other riskier assets.

For example, if the FOMC projects that the economy will perform well in the future, traders and investors may be more likely to invest in stocks, as they expect the market to perform well.

On the other hand, if the FOMC projects that the economy will perform poorly, traders and investors may be more likely to invest in bonds, as they expect the market to be more stable.

Traders and investors also pay attention to the forward guidance provided by the FOMC, as it can affect the expectations of future monetary policy.

For example, if the FOMC states that it expects to keep interest rates low for an extended period, traders and investors may be more likely to invest in stocks, as they expect the market to perform well in the short-term.

On the other hand, if the FOMC states that it expects to raise interest rates soon, traders and investors may be more likely to invest in bonds, as they expect the market to be more stable in the short-term.

News Trading on FOMC Data

Traders use the information from the Federal Open Market Committee (FOMC) meetings and statements to make trading decisions in a variety of ways.

Here are a few examples:

  1. Interest rate decisions: If the FOMC raises interest rates, it can lead to higher bond yields, which can cause bond prices to fall. Similarly, if the FOMC lowers interest rates, bond prices may rise and traders may adjust their positions accordingly.
  2. Economic projections: If the FOMC’s economic projections indicate stronger-than-expected economic growth, traders may anticipate that this could lead to higher stock prices. Conversely, if the FOMC’s projections indicate weaker-than-expected economic growth, traders may anticipate that this could lead to lower stock prices.
  3. Forward guidance: If the FOMC changes its forward guidance, this can affect traders’ expectations for future monetary policy and interest rates. For example, if the FOMC signals that it plans to raise interest rates in the near future, traders may anticipate that this will cause bond prices to fall.
  4. Statement Language Changes: FOMC statement language changes can indicate the committee’s attitude towards the economy, inflation and monetary policy. Traders can use this information to make predictions about the future direction of interest rates, GDP, unemployment rate, and inflation, which can help them to make trading decisions.

Concluding Thoughts

In summary, the FOMC is a vital component of the Federal Reserve System that is responsible for making monetary policy decisions.

These decisions can have a significant impact on financial markets, making it essential for traders and investors to stay informed about the FOMC’s actions.

Whether you’re new to the world of finance or a seasoned professional, understanding the FOMC is crucial to making informed investment decisions.

Now that I have covered all about the importance of the FOMC meeting, is it something that you will add to your trading toolbox?

Let me know in the comments below.

2022 09 19 21 00 30

Investors’ views on inflation, recession risk, and monetary policy were fickle throughout much of 2022.

Recently, a positive bias has emerged, reflected in the downward shift in interest rate expectations and upward move in securities prices since mid-October.

Investors appear to be interpreting economic data as evidence that a dovish pivot (Fed stopping interest rate hikes and possibly cutting them) is imminent.

Bad news (slowing job growth, dismal economic survey data, falling property values, negative real wage growth) is seen as good news when viewed through the lens of inflation and monetary policy.

But what is missing in this discussion is the real economy and what may have to happen to it for this market narrative to play out.

The dovish pivot narrative is driven by the expectation that U.S. inflation will continue to decline at a fairly rapid rate.

However, it’s also noteworthy that the Fed’s success in slowing inflation thus far has occurred while China, the world’s second-largest economy, has been hampered by pandemic-related restrictions.

The Fed is typically prone to keeping policy either too tight or too loose for too long.

Fed officials only have to look back at “the great inflation” of 1965 to 1982 to see what can happen when policy is loosened too quickly.

The market’s optimism could make it more likely that the Fed keeps tightening policy.

So, all things considered, the risk of over-tightening seems to be higher than the likelihood of a premature pivot.

What would cause the Fed to make a significant shift in policy?

Most likely a meaningful recession or market crisis – risks that aren’t being reflected in today’s earnings expectations or credit spreads.

Investors are focusing far more on what negative economic data means for interest rates than the potential implications for the real economy.

Join our “Daily Trading Signals” for real-time trading opportunities!


2022 09 19 21 00 30

[Photo: Lake Aydarkul, Uzbekistan – See my full travel photo log!]

For our weekly market wrap, we go through some of the trade calls and analysis from last week, which gives us valuable insights for the week ahead.

We cover 3 main markets with a total of 200+ counters, so we will never run out of trading opportunities:

By covering a broad range of markets, we can focus our attention (and capital) on whichever market currently gives the best returns.

Click here to receive all these signals in real-time for only $67 a month! You will get several signals a day, and even taking just 1 trade the whole month can easily cover the fee, so what are you waiting for?


Weekly Market Outlook Video

Trading Signals Weekly Market Outlook 230123

Weekly Market Outlook (22 January 2023)

  • CNY week will see slow markets
  • Watch out for tech layoffs and earnings


Portfolio Highlights

Trading Signals Weekly Portfolio 230123 1

Weekly Portfolio Updates (22 January 2023)

Not much changes, since the market has not moved much.


Forex & Commodities Market Highlights

Trading Signals AUDCHF 210123

AUDCHF – Excellent short entry, and trade is now in the money. Can consider trailing SL to breakeven to reduce risk.


Trading Signals EURAUD 210123

EURAUD – Great entry near the support level, and the trade is now in the money. Can continue to hold for more profits since the trend is still bullish.


Trading Signals EURCHF 210123

EURCHF – Excellent entry near support, after pulling back from an ascending triangle breakout.


Trading Signals USDJPY 210123

USDJPY (H4 chart) – Congrats to those who managed catch this short!


Trading Signals XAUUSD 210123

Gold (XAUUSD) – Still going strong, after some small profit-taking. I have circled the previous buying/consolidation points.

Probably heading up to test the previous swing highs.


Trading Signals Periodic table of commodities returns 210123

The Periodic Table of Commodities Returns 2022


Stock & Bond Market Highlights

Trading Signals US500 210123

S&P 500 (US500) – The major trendline is back in play, after the recent rally failed to break past it.

If it takes out the previous swing low (~3750), then the bears will start stepping in full force and we will probably see new lows.

Now that we are more or less certain that inflation is coming down, the next major concern is slowing growth and worse company earnings.


Trading Signals SP500 calendar year returns 210123

S&P 500 Calendar Year Returns: 1928-2022


Trading Signals tech layoff 210123

200,000+ laid off in tech since the beginning of 2022. And for no reason other than “everyone else is doing it”.

Tech workers need a union.


Crypto Market Highlights

Trading Signals BTCUSD 210123

Bitcoin (BTCUSD) – After an impressive rally the last few weeks, prices are now consolidating.

If prices can break out of the small bull flag, this could spark more buyers coming in and start an uptrend.

However, if volumes falter, then traders could end up taking the chance to dump their holdings on this rally.


Click here to receive all these signals in real-time for only $67 a month! You will get several signals a day, and even taking just 1 trade the whole month can easily cover the fee, so what are you waiting for?

Good luck, and may next week bring more excellent profits!

Uchisar Turkey

US nominal growth is experiencing a significant deceleration, as evidenced by declining services PMI and lower momentum of Non-Farm Payrolls, with a negative rate of change for real growth and moderating wage growth indicating negative inflationary pressures.

Inflation in the US is currently affecting services the most, which is where nearly two-thirds of consumer spending goes.

Services include housing, insurance, healthcare, education, travel and hotel bookings, subscriptions, streaming, telecommunication, haircuts and more.

Inflation in the Eurozone is increasing due to excessive printing of real-economy money and a relatively inelastic basket of goods and services.

European core inflation may lag US core inflation by 6 months but it is expected to continue to increase over the next 3-6 months, which will force the ECB to be hawkish.

The Chinese economy is experiencing a significant reopening, which is expected to boost growth and force Emerging Markets fund managers to reallocate to China and other countries.

This push from the Chinese reopening is offset by the pull of a deteriorating global growth and inflation picture.

In light of these mixed news, has the stock market bottomed, or was the recent rally a bull trap?

Stayed tuned in our “Daily Trading Signals” private Telegram channel!


Uchisar Turkey

[Photo: Cappadocia, Turkey – See my full travel photo log!]

For our weekly market wrap, we go through some of the trade calls and analysis from last week, which gives us valuable insights for the week ahead.

We cover 3 main markets with a total of 200+ counters, so we will never run out of trading opportunities:

By covering a broad range of markets, we can focus our attention (and capital) on whichever market currently gives the best returns.

Click here to receive all these signals in real-time for only $67 a month! You will get several signals a day, and even taking just 1 trade the whole month can easily cover the fee, so what are you waiting for?


Weekly Market Outlook Video

Trading Signals Weekly Market outlook 170123

Weekly Market Outlook (15 January 2023)

1. Bearishness of USD – might be oversold
2. No clear direction of US stock market
3. Bullishness of China stock market
4. Watch for TLT as early indicator
5. Crypto market reversing?
6. CNY market slowdown
7. Soft landing or recession?


Portfolio Highlights

Trading Signals weekly portfolio 170123

Weekly Portfolio Updates (15 January 2023)

Not much changes, but this week I could be doing some rebalancing, which I will update when it happens.

Stay tuned!


Forex & Commodities Market Highlights

Trading Signals USDJPY 160123

USDJPY – Congrats to those who followed the trade, prices have hit the first TP!


Trading Signals XAUUSD 160123

Gold (XAUUSD) – This trade has also hit the TP, congrats to all those who followed!


Trading Signals USDSGD 160123

USDSGD – As predicted, prices have fallen to the major support level. Congrats!

Since prices are quite oversold and the support is strong, this will be a good level to have a price rebound.


Trading Signals USDSGD 190123

USDSGD is near the 5 year low, and is at the bottom of a wide trading range. Weekly RSI is in the oversold region.

Good chance of a rebound from these levels, which means if you are looking to buy US dollars, now is a good time to get it cheaper.

And if you are planning to fund your trading accounts in USD, you can also take advantage of the good conversion rates now.


Trading Signals AUDJPY 160123

AUDJPY – Continuation of the downtrend


Stock & Bond Market Highlights

Trading Signals Recession 160123

What if don’t get a recession this year?
What happens if we get a soft landing?


Click here to receive all these signals in real-time for only $67 a month! You will get several signals a day, and even taking just 1 trade the whole month can easily cover the fee, so what are you waiting for?

Good luck, and may next week bring more excellent profits!