• Link to Facebook
  • Link to X
  • Link to Instagram
  • Link to Youtube
  • Link to LinkedIn
  • Link to Mail
Synapse Trading
  • Home
  • About
    • My Background
    • My Trading Journey
    • My Travel Log
    • Media & Interviews
  • Mentoring
    • Trading Mastery Program
    • Results & Testimonials
  • Signals
    • Telegram (Free to join!)
    • Daily Trading Signals
    • Daily Trading Signals (Results)
  • Resources
    • Free Trading Guides
    • Tools & Resources
    • Blog & Infographics
  • Contact
    • Contact Us
    • Partnership Opportunities
  • Click to open the search input field Click to open the search input field Search
  • Menu Menu

Tag Archive for: SGX

Spencer Li

The Math Behind Trading

Trading Tips
free resources

Before making your first trade, you need to understand the mathematical logic behind trading.

This will allow you to balance risk versus reward.

Determine when to enter and exit a trade and ensure that you win in the long run.

In general, the profitability of your investment account depends on two factors: your hit rate and the risk to reward ratio of each trade.

Your hit rate is the percentage of winning trades, so if you make ten trades and win six, your hit rate is 60%.

Now, your hit rate doesn’t factor in how much money you made or lost in those trades, just whether or not you won.

If you trade using good setups and solid strategies, you should achieve a hit rate of about forty to sixty percent.

The next thing to look out for is the risk to reward ratio of a trade, otherwise known as the RR ratio.

This will help you achieve big wins, while keeping your losses low.

After all, like the famous financier George Soros once said, it’s not how often you’re right or wrong, but rather how much you make when you’re right and how much you lose when you’re wrong.

So if you only get it right 40 percent of the time, you want to make sure those trades make way more than all the losing trades.

The RR is calculated using three numbers. First, the EP or entry price: this is the price at which you enter the trade.

Next, the TP or target profit: this is the price you expect the stock to reach.

Finally, the SL or stop-loss: this is the price at which you will definitely get out of the position.

To calculate reward, you take the difference between the TP and the EP; while the risk is the difference between the EP and the SL.

The RR ratio is then calculated by taking the reward and dividing by the risk. Hence, the higher the reward, the better the RR, and the lower the risk, the better the RR.

Generally, you should be aiming for an RR of at least two to three, this means that your potential upside is two to three times your potential downside on some trades.

It might even be possible to get an RR of seven to ten.

Risk management is such an important part of trading and has such a huge impact on your profit and loss.

For instance, if you have a hit rate of only 40% but an RR of two, you’ll still end up profitable in the long run because remember, success isn’t about winning every trade, it’s about making those wins count.
0 Comments/by Spencer Li
https://synapsetrading.com/wp-content/uploads/2016/02/free-resources.png 344 481 Spencer Li https://synapsetrading.com/wp-content/uploads/2019/10/logo.jpg Spencer Li2016-04-11 08:00:232021-02-15 00:23:01The Math Behind Trading
Spencer Li

The Top 3 Economic Indicators

Trading Tips
free resources

In our previous videos, we’ve learned the importance of tracking the big market cycles and how fundamental and economic forces drive those movements in this video. We’re going to look at the top three economic indicators to look out for. In the past, only experienced professionals and economists received this data in a timely fashion, but in the Internet age everyone has access to dozens of economic surveys and indicators every week.

This data can be divided into three main groups: interest rate and monetary policy, employment and jobs data, and consumption and production data.

Now, keep in mind most of this data is based on the US economy since it’s the biggest financial powerhouse that moves global markets.

So, first let’s look at interest rate and monetary policy. For the US, the Federal Open Market Committee or FOMC makes scheduled announcements 8 times a year regarding interest rate or monetary policy. This can have a major impact on the markets because it affects the cost of borrowing and the money supply in the market. Other economies such as the eurozone, China, Australia, Japan and Switzerland have their own scheduled announcements where they set their interest rate and monetary policy.

Next, employment and jobs data. This data is very important because job creation is a leading indicator of consumer spending, which accounts for a majority of overall economic activity. The most important figure is the non-farm payroll which accounts for approximately 80% of the workers who produce the entire gross domestic product of the United States. This vital piece of economic data is released monthly usually on the first Friday after the month ends. The combination of importance and earliness makes for hefty market impacts. Other indicators include the employee cost index or ECI employment situation report and weekly jobless claims report.

Finally, there’s consumption and production data. There are various reports that measure different aspects of consumption and production, so it’s up to the savvy investor to piece it all together. Some examples include the Gross Domestic Product or GDP, Purchasing Managers Index or PMI, Philly Fed Report, Consumer Confidence Index, Producer Price Index, Consumer Price Index and the existing home sales report and housing starts. In general, the key is to look out for the kind of news that’s relevant to the current market climate.

For example, when the stock market has been bullish for many years and interest rates are really low, astute investors will keep their eyes peeled for any indication about interest rate increases as these will have a major impact on the market.

So remember, do your research and always make informed investment decisions.

0 Comments/by Spencer Li
https://synapsetrading.com/wp-content/uploads/2016/02/free-resources.png 344 481 Spencer Li https://synapsetrading.com/wp-content/uploads/2019/10/logo.jpg Spencer Li2016-04-04 08:00:572021-02-13 17:31:48The Top 3 Economic Indicators
Spencer Li

An Easy Way to Diversify your Investment Portfolio

Trading Tips
free resources

You’ve probably heard about the importance of diversifying your portfolio.

The question is how do you do it and what if you have limited capital to invest and can’t afford to purchase a lot of different stocks at once? In this video, we’ll introduce you to two new asset classes: exchange-traded funds or ETFs and real estate investment trusts or REITs. These will enable you to diversify your portfolio and generate passive income without having to invest too much. First, let’s look at ETFs also known as tracker funds.

ETFs track the performance of a stock index like the STI Dow Jones Hang Seng or commodity and bond indices. These are useful for new investors because by simply investing in ETFs you’re effectively investing in the price movements of all the companies listed on the underlying index. This makes it much easier to diversify your portfolio, then if you picked individual stocks and commodities especially if you’re starting out with limited capital.

Besides stocks and ETFs, however, there is another popular asset class, one that’s been around for thousands of years. Yup, real estate. So, how can a new investor with limited funds, invest in this market? Through a real estate investment trust or REIT.

A REIT is a company that invests in real estate properties and by investing in a REIT, you can share the benefits and risks of owning a real estate portfolio. In short, a REIT allows you to buy and sell properties as if they were stocks by buying a stake in a REIT.

You are effectively vested in all the properties owned by the REIT, so as the REIT makes its profits from asset appreciation and rental income, you will receive regular payouts which can provide you with passive income.

We’ve come to the end of part 1 of our video series. We hope you’ve learned the importance of making your money work for you and the different asset classes and opportunities that are available to you. In the next part of our series, we’ll explore the big market cycles and find out how to better time your purchases so you can receive the biggest benefits possible.

0 Comments/by Spencer Li
https://synapsetrading.com/wp-content/uploads/2016/02/free-resources.png 344 481 Spencer Li https://synapsetrading.com/wp-content/uploads/2019/10/logo.jpg Spencer Li2016-03-29 01:30:282021-02-13 14:36:32An Easy Way to Diversify your Investment Portfolio
Spencer Li

How to Draw Support and Resistance Levels

Trading Tips
support resistance

So far, we’ve covered the importance of market timing and the need to trade according to the current trend. But when exactly should you be buying or selling a security? This brings us to the topic of support and resistance zones.

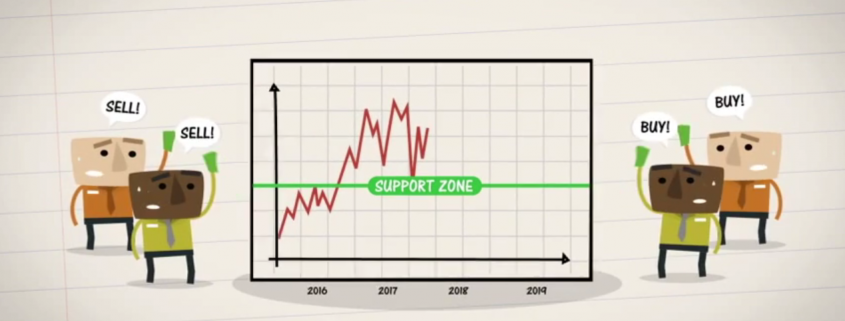
Support and resistance zones are like invisible lines on a price chart which prices and traders react to. They signal a great opportunity to either enter or exit a trade. These zones usually correspond with the pattern by which a particular security has moved in the past. For instance, let’s say a stock reaches a certain price level before declining, it goes down for about a year before hitting its bottom and turning back up again.

The next time that stock approaches, the price at which it first began to decline, some investors will start to sell it off, anticipating that it will decline once again. This is how a resistance zone is created. On the other hand, when that stock approaches the price at which at last turned around, many investors will step in and buy it, creating a support zone. Securities sit in these zones temporarily, while buyers and sellers try to figure out whether to jump in or jump out of the market. The key is to watch carefully how prices react in the support or resistance zone because eventually, one of two things will happen.

The zone will either hold and the price will reverse direction or the security will break through and continue on its trajectory. It’s important to note that breakthroughs have the tendency to recalibrate a security support and resistance zones. For example, often times when a security breaks through a resistance zone that same level becomes its support zone during the next cycle. That’s because of all the investors who missed the chance to benefit last time around and are looking to either buy the security for cheap or sell it before it declines.

As a trader, it’s important to learn how to identify the support and resistance zones for a particular security once you’ve figured out where those zones are, you should then make your buying and selling decisions near those zones. That will provide you with a market edge, allowing you to achieve greater success over the short and long term.

0 Comments/by Spencer Li
https://synapsetrading.com/wp-content/uploads/2015/05/support-resistance.png 709 1269 Spencer Li https://synapsetrading.com/wp-content/uploads/2019/10/logo.jpg Spencer Li2015-05-29 08:00:252021-02-13 13:43:47How to Draw Support and Resistance Levels
Spencer Li

Techniques for Identifying Market Trends

Trading Tips
identifying market trends

If you want to make money by timing the stock market you need to follow the trends.

Buying and selling creates its own momentum and a market that’s moving up or down is likely to keep moving in that direction for a certain period of time.

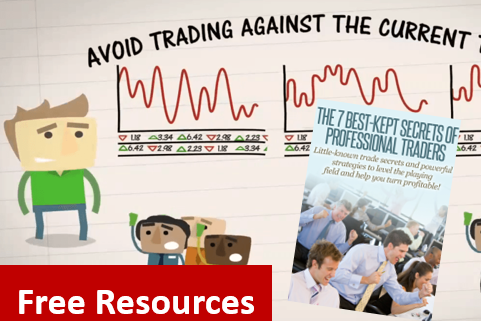
What this means is that you should avoid trading against the current trend.

For example, when the market is bearish and heading down, don’t try to predict which stocks have hit bottom, that would be like trying to catch a falling knife.

Instead, find an objective way to both identify the current trend and decipher when that trend has changed too, because just like the saying goes, “the trend is your friend, except at the end”.

So, let’s explore two simple techniques for identifying market trends.

The most common ways to look at the nature of a trend’s movement. As a stock moves up or down, it rarely does so in a straight line, rather it zigzags forming a series of highs and lows.

If the highs keep getting higher and the lows keep getting higher that stock is in an uptrend. If the highs get lower and the lows get lower, you’re looking at a downtrend. And if the highs and lows are consistent over a certain period, it’s in a sideways trend.

Another way to identify the market trend is to look beyond the daily price fluctuations and determine the general direction of a stock.

You do this by calculating an average. For example, a 20-day simple moving average or an SMA, is an average of the past 20 days of closing prices, which moves or updates on a daily basis by incorporating the latest prices.

If the SMA is sloping upwards, that’s an uptrend; sloping down downtrend and sideways, means flat.

A 20-day SMA gives a good picture of the short-term trend but you can also use other periods like the 50-day SMA and the 200-day SMA for the long-term trend. Those aren’t the only moving averages, however, there’s the exponential moving average or EMA, and the weighted moving average or WMA, which gives more weight to recent prices.

As a trader, you can use any of these techniques individually, but for the most accurate picture of market trends, you should use them all.

Because when it comes to behavioral analysis, the best way to increase your chances of success, is to consider as much data as possible.

So that’s market timing! Next, let’s cover support and resistance zones.

0 Comments/by Spencer Li
https://synapsetrading.com/wp-content/uploads/2015/05/identifying-market-trends.png 715 1279 Spencer Li https://synapsetrading.com/wp-content/uploads/2019/10/logo.jpg Spencer Li2015-05-22 08:00:242021-02-15 00:20:10Techniques for Identifying Market Trends
Page 2 of 512345

Free Trading Guides

Free Trading Guides

Blog Categories

  • Beginner's Guide
  • Blockchain & Crypto
  • Book Summaries
  • Economics & News Trading
  • Investing & Portfolio Management
  • Living Your Best Life
  • Market Analysis
  • Markets & Products
  • News & Events
  • Promotions
  • Risk & Money Management
  • Stock Trading
  • Technical Analysis & Price Action
  • Testimonials
  • Tools & Resources
  • Trading Psychology
  • Trading Strategies
  • Trading Tips
  • Travel & Lifestyle

Free Trading Guides

Free Trading Guides

Contact Us

Synapse Trading Pte Ltd
Registration No. 201316168H

Whatsapp: +65-8897-1204
Telegram: @iamrecneps
Email: info@synapsetrading.com

Links

Disclaimer
Privacy policy
Terms & Conditions
Contact us
Partnerships

© 2012-2024 Synapse Trading | All rights reserved | - powered by Enfold WordPress Theme
  • Link to Facebook
  • Link to X
  • Link to Instagram
  • Link to Youtube
  • Link to LinkedIn
  • Link to Mail
Scroll to top Scroll to top Scroll to top