• Link to Facebook
  • Link to X
  • Link to Instagram
  • Link to Youtube
  • Link to LinkedIn
  • Link to Mail
Synapse Trading
  • Home
  • About
    • My Background
    • My Trading Journey
    • My Travel Log
    • Media & Interviews
  • Mentoring
    • Trading Mastery Program
    • Results & Testimonials
  • Signals
    • Telegram (Free to join!)
    • Daily Trading Signals
    • Daily Trading Signals (Results)
  • Resources
    • Free Trading Guides
    • Tools & Resources
    • Blog & Infographics
  • Contact
    • Contact Us
    • Partnership Opportunities
  • Click to open the search input field Click to open the search input field Search
  • Menu Menu

Tag Archive for: book summaries

Spencer Li

Book Summary: Fibonacci Analysis by Constance Brown

Book Summaries
thumbnail Book Summary Fibonacci Analysis by Constance Brown

thumbnail Book Summary Fibonacci Analysis by Constance Brown

“Fibonacci Analysis” by Constance Brown is a comprehensive guide to understanding and utilizing Fibonacci ratios in technical analysis.

The book delves into the history and origins of Fibonacci ratios and explains how they can be used to identify key levels of support and resistance in the financial markets.

This book is an essential read for any technical analyst looking to improve their understanding of Fibonacci analysis and apply it to their trading strategies.

In this blog post, I will share all about this book and the author, key ideas from the book, and how you can apply it to your own trading & investing journey.


About the Author

Constance Brown is a renowned technical analyst and author.

She is the founder and CEO of CBFA (Constance Brown Financial Advisors), a company that provides technical analysis education and consulting services.

She has over 30 years of experience in the financial industry and has been a featured speaker at numerous financial conferences worldwide.

In addition to “Fibonacci Analysis,” she has also written “Technical Analysis for the Trading Professional” and “The Technical Analyst’s Handbook.”

What is the Book About?

The book is divided into three parts, the first of which provides an overview of Fibonacci ratios and their history.

The second part of the book covers the various ways in which Fibonacci ratios can be applied to the financial markets, including stock, futures, and options.

The last part of the book provides a detailed explanation of how to use Fibonacci analysis in conjunction with other technical indicators, such as moving averages and Elliott Wave analysis.

The main message of the book is that Fibonacci analysis is a powerful tool for identifying key levels of support and resistance in the financial markets and that it can be used in conjunction with other technical indicators to improve the accuracy of trading signals.

10 Key Ideas from the Book

  1. Fibonacci ratios are derived from the Fibonacci sequence, which is a series of numbers where each number is the sum of the two preceding numbers.
  2. The most commonly used Fibonacci ratios in technical analysis are 0.236, 0.382, 0.50, 0.618, and 0.786.
  3. Fibonacci ratios can be used to identify key levels of support and resistance on charts by measuring the distance between two points and then applying the relevant Fibonacci ratio.
  4. Fibonacci retracements can be used to identify potential levels of support and resistance during a pullback in a trend.
  5. Fibonacci extensions can be used to identify potential levels of resistance during an uptrend and potential levels of support during a downtrend.
  6. Fibonacci time zones can be used to identify potential turning points in the market based on the length of time a move has been in effect.
  7. Fibonacci arcs can be used to identify potential levels of support and resistance based on the distance between a high and low point and the corresponding Fibonacci ratio.
  8. Fibonacci fan lines can be used to identify potential levels of support and resistance by drawing lines from a high or low point at different angles.
  9. Fibonacci ratios can be used in conjunction with other technical indicators such as moving averages and Elliott Wave analysis to improve the accuracy of trading signals.
  10. It is important to use Fibonacci analysis in conjunction with other forms of analysis such as fundamentals and market sentiment to make more informed trading decisions.

10 Ways to Apply the Teachings

  1. Identify key levels of support and resistance using Fibonacci retracements.
  2. Use Fibonacci expansions to predict potential price targets.
  3. Use Fibonacci time zones to identify potential turning points in the market.
  4. Combine Fibonacci analysis with other technical indicators to improve the accuracy of trading signals.
  5. Use Fibonacci analysis in conjunction with a thorough understanding of market fundamentals and technical analysis principles.
  6. Consider multiple Fibonacci levels when analyzing price action.
  7. Use Fibonacci analysis on different timeframes for short-term scalping or long-term investment strategies.
  8. Understand the concept of “the trend is your friend” when using Fibonacci analysis.
  9. Use Fibonacci analysis as part of a comprehensive trading or investment strategy.
  10. Practice using Fibonacci analysis on historical market data to gain experience and improve your skills.

Other Important Points from the Book

  • Fibonacci analysis is based on the assumption that financial markets exhibit patterns and behaviors that repeat over time.
  • The accuracy of Fibonacci analysis can be affected by market conditions and volatility.
  • Fibonacci analysis is a tool that can be used to identify potential opportunities, but it should not be used as the sole decision-making tool.
  • Fibonacci analysis is not suitable for beginners, it requires a certain level of technical analysis competency.

Concluding Thoughts

In conclusion, “Fibonacci Analysis” by Constance Brown is a comprehensive guide to understanding and applying Fibonacci ratios in technical analysis.

The book provides a clear and thorough explanation of the mathematical principles behind Fibonacci analysis, as well as practical examples of how to use it in real-world trading scenarios.

The author’s deep expertise and clear writing style make the book accessible to both experienced traders and those new to Fibonacci analysis.

I would recommend this book to anyone interested in technical analysis, particularly those who are interested in using Fibonacci ratios to make better trading decisions.

It is also a great resource for traders who are looking to improve their understanding of how Fibonacci ratios can be used to identify key support and resistance levels in the market.

Whether you are a professional trader or a beginner, “Fibonacci Analysis” is an excellent guide to mastering this powerful tool in technical analysis.

Now that I have covered all the key learning points of this book, would you consider adding it to your reading list?

For those who have already read it, what are some of your key learning points?

Let me know in the comments below!


best books on trading and investing

If you would like to find more book summaries and recommendations, also check out: “Best Investing & Trading Books of All Time”
0 Comments/by Spencer Li
https://synapsetrading.com/wp-content/uploads/2023/01/thumbnail-Book-Summary-Fibonacci-Analysis-by-Constance-Brown.png 720 1280 Spencer Li https://synapsetrading.com/wp-content/uploads/2019/10/logo.jpg Spencer Li2023-01-28 18:51:342024-08-06 14:00:01Book Summary: Fibonacci Analysis by Constance Brown
Spencer Li

Book Summary: Expert Advisor Programming by Andrew Young

Book Summaries
thumbnail Book Summary Expert Advisor Programming by Andrew Young

Expert Advisor Programming by Andrew Young: Book Review and What It Teaches

Last updated: 3 July 2026 · By Spencer Li, CFTe


“Expert Advisor Programming” by Andrew Young is a hands-on, beginner-friendly guide to building automated trading systems (expert advisors, or EAs) on the MetaTrader 4 platform using the MQL4 programming language. It walks you from the basics of the MetaEditor environment, through writing and testing a strategy, optimizing its parameters, and adding risk management, to debugging and forward-testing the finished robot. It is best suited to traders and programmers with a basic grounding in both, though a motivated beginner can follow it. Its core message is honest and worth repeating: an EA is only a tool, and it cannot rescue a strategy that has no real edge to begin with. Note one limitation up front: the book does not cover machine learning or AI, so treat it as a foundation in classic MQL4 automation, not a modern AI-trading text.

Here is what the book actually covers, who should read it, and where it stops.

What is an expert advisor (EA)?

An expert advisor (EA) is a program that runs inside MetaTrader 4 and trades automatically on your behalf. It reads price data, applies the rules you have coded, and then places, manages, and closes orders without you clicking anything. You write it in MQL4 (MetaQuotes Language 4, the platform’s built-in programming language) using the MetaEditor (the code editor bundled with MetaTrader 4).

In plain terms, an EA is your trading plan turned into software. That is the appeal, and also the trap. If your plan has an edge, the EA executes it tirelessly and without emotion. If your plan does not, the EA loses money faster and more consistently than you ever could by hand.

What is the book about?

The book is built in three parts, and the structure tells you the intended path.

PartWhat it coversWhat you walk away able to do
Part 1: FoundationsThe MetaTrader 4 platform, the MQL4 language, and the MetaEditor environmentRead and write basic MQL4, find your way around the tools
Part 2: Building the EACreating and testing a strategy, optimizing parameters, implementing risk managementTurn a trading idea into a working, risk-managed robot
Part 3: Hardening itDebugging, troubleshooting, backtesting, and forward testingFind the bugs and pressure-test the system before it touches real money

The main message is the one most beginners skip past: EA programming is a powerful tool, but it rewards a solid understanding of both the markets and the language. The code is the easy half. The edge is the hard half.

About the author

Andrew Young is a professional trader and programmer with over a decade in the financial markets. He has a computer-science background and has worked as a software developer for large corporations, and he has built trading strategies and automated systems for various financial institutions. He has written several books on trading and programming and speaks regularly at industry conferences. So the book comes from someone who has actually shipped both code and strategies, not a pure theorist.

The 10 key ideas from the book

These are the points the book keeps returning to. Read them as a checklist for anyone thinking about automating a strategy.

  1. Learn the platform first. A working knowledge of MetaTrader 4 and the MQL4 language is the price of entry for building any EA.
  2. The strategy comes before the code. A profitable trading strategy is the first step. The EA is just the delivery mechanism.
  3. Optimize with caution. Over-optimization (overfitting) tunes a system so tightly to past data that it falls apart on new data. More optimization is not more profit.
  4. Bake in risk management. Risk control is not a bolt-on. It belongs inside the system from the start.
  5. Backtest and forward-test. Backtesting (running the EA over historical data) and forward testing (running it live on small or demo capital) are both needed to judge whether it actually works.
  6. Budget time for debugging. Debugging and troubleshooting are slow, unglamorous, and necessary. This is most of the real work.
  7. Use functions and libraries. Reusable functions and libraries make an EA more efficient and far easier to maintain.
  8. Pull in external data where it helps. External data sources can extend what an EA reacts to.
  9. Add custom indicators. Custom indicators can sharpen the signals an EA trades on.
  10. Optimization techniques have a ceiling. Methods like parameter optimization (and, in principle, neural networks) can improve performance, but only on top of a strategy that already has an edge.

How do you apply the book to your own trading?

The book pairs each idea with a practical move. Here is the applied version, in the order you would actually do them.

  1. Define a real edge by hand first. Analyze the markets, find the pattern or trend you can trade, and prove it works manually before you write a line of code.
  2. Optimize parameters, but lightly. Test combinations and pick a robust one, not the single best-fit curve.
  3. Code in your risk rules. Stop loss and take profit are not optional features. They are what keep one bad run from ending the account.
  4. Backtest, then forward-test. Use both to surface problems the other one hides.
  5. Debug systematically. Expect errors, and fix them methodically rather than guessing.
  6. Write maintainable code. Use functions and libraries so the next change does not break three other things.
  7. Layer in external data where it genuinely adds signal, not noise.
  8. Add custom indicators to refine entries and exits.
  9. Apply optimization to squeeze the system, knowing it cannot manufacture an edge that was never there.
  10. Monitor and adjust continuously. A live EA is not “set and forget”. Markets change, and the robot needs minding.

What the book does not cover

A few honest boundaries, so you buy it for the right reasons.

  • It is built around MetaTrader 4 specifically, though the concepts carry over to other platforms.
  • It mostly uses forex examples, but the methods apply to other markets too.
  • It assumes a basic grounding in trading and programming. A complete beginner can follow it with effort, not effortlessly.
  • It does not cover machine learning or AI. If you came for an AI-trading book, this is not it. It is a classic-automation foundation.

Where the human edge comes in

Here is the part the book is quietly honest about, and the part I want to underline. An EA will execute your rules flawlessly, around the clock, with no fear and no greed. What it will never do is supply the edge. It cannot tell you that your strategy is curve-fit, that your backtest is lying to you, or that the market regime that made it work has quietly ended. Automation removes the emotion and the manual labor. It does not remove the need for judgment. The code is the cheap half now. Knowing whether the strategy underneath it is real, and pulling the plug when it stops being real, is the human edge, and it is the first of the Five Edges no robot can trade for you.

FAQ

Is “Expert Advisor Programming” by Andrew Young good for beginners?
It is suitable for traders and programmers who have a basic understanding of both. A complete beginner can follow it with effort, but it is not a no-prerequisites book. The willingness to learn matters more than prior expertise.

What is an expert advisor in MetaTrader 4?
An expert advisor (EA) is a program that runs inside MetaTrader 4 and trades automatically using rules you code in the MQL4 language. It places, manages, and closes orders without manual input.

Does the book cover AI or machine learning for trading?
No. The book covers classic MQL4 automation, strategy testing, optimization, risk management, and debugging. It does not cover machine learning or AI.

What programming language do you need to build an EA?
MQL4 (MetaQuotes Language 4), the built-in language of MetaTrader 4. You write it in the MetaEditor environment that ships with the platform.

Can an expert advisor make a losing strategy profitable?
No. An EA only executes the rules you give it. If the underlying strategy has no edge, automating it usually loses money faster and more consistently. The strategy has to work first.


Now that you have the map of what this book teaches, would you add it to your reading list? And if you have already built an EA, what tripped you up most: the code, or proving the strategy actually worked? Let me know in the comments.

For the wider reading list, see the pillar: Best Investing and Trading Books of All Time.

Want a system you can run by hand before you ever automate it? Grab the free 15-Minute Swing Trading Starter Kit. It is the exact routine I use to scan once a day and trade any market in 15 minutes, and it is the kind of edge worth proving manually before you hand it to a robot.


About the author. Spencer Li is the founder of Synapse Trading and a Certified Financial Technician (CFTe) with 15 years of trading across stocks, forex, crypto, commodities, and bonds. His trade log is public, 404 trades, losses left in. He teaches low-risk swing trading in 15 minutes a day, one system for any market.

Education, not financial advice. Synapse Trading is not licensed by MAS to advise on investment products. Trading carries risk of loss; past performance is not indicative of future results.


Related

Best Investing and Trading Books of All Time (pillar) · Algorithmic and automated trading guide · Backtesting a trading strategy · Risk management for traders

0 Comments/by Spencer Li
https://synapsetrading.com/wp-content/uploads/2023/01/thumbnail-Book-Summary-Expert-Advisor-Programming-by-Andrew-Young.png 720 1280 Spencer Li https://synapsetrading.com/wp-content/uploads/2019/10/logo.jpg Spencer Li2023-01-28 18:51:282026-07-06 01:56:33Book Summary: Expert Advisor Programming by Andrew Young
Spencer Li

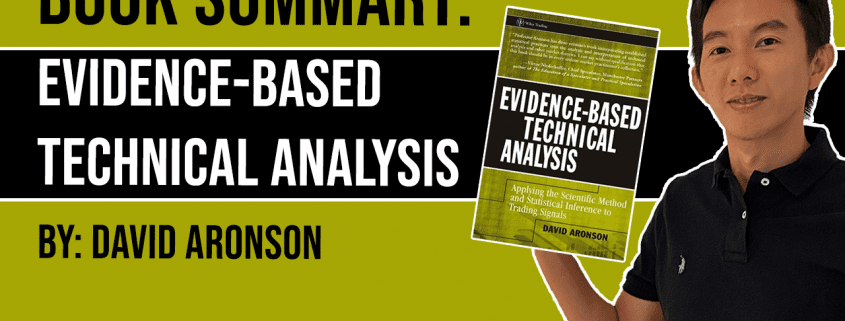
Book Summary: Evidence-Based Technical Analysis by David Aronson

Book Summaries
thumbnail Book Summary Evidence Based Technical Analysis Applying the Scientific Method and Statistical Inference to Trading Signals by David Aronson

Evidence-Based Technical Analysis by David Aronson: Summary and Key Lessons

Last updated: 3 July 2026 · By Spencer Li, CFTe


Evidence-Based Technical Analysis by David Aronson is a 2006 book that applies the scientific method and statistical inference to chart-based trading signals, arguing that most traditional technical analysis is subjective interpretation that has never been properly tested. Aronson’s core claim is simple: a pattern or indicator only earns a place in your trading if it survives a rigorous statistical test, not because it looks good on a hand-picked chart. The book teaches you how to run those tests yourself, using hypothesis testing, Monte Carlo simulation (running thousands of randomised what-if scenarios to see if a result could be luck), and Bayesian inference (updating your probability estimate as new data arrives). It is worth reading if you want to stop trading on stories and start trading on evidence. Do note that it is dense, stats-heavy, and aimed at short-term traders working mostly with stocks, so it is not a casual beach read.

Here is what the book actually argues, the ideas worth keeping, and how to apply them without a statistics degree.

Who is David Aronson?

David Aronson is a statistician and quantitative analyst who spent over twenty years in finance. He holds a PhD in statistics and has written several books on quantitative methods in markets, including this one and a follow-up on Bayesian inference in finance.

That background matters, because it tells you the lens. Aronson is not a chart guru selling you a pattern. He is a statistician asking an uncomfortable question: can you prove any of this works? Most technical analysis books never ask it. This one is built around it.

What is Evidence-Based Technical Analysis about?

The book is about using scientific methods to separate the technical analysis that works from the technical analysis that only looks like it works.

Aronson’s argument runs like this. Traditional technical analysis leans on subjective reading of charts and patterns. Two analysts look at the same chart and see two different things. That subjectivity produces inconsistent, unreliable results, and worse, it is unfalsifiable: if the pattern fails, you can always say you read it wrong rather than admit the pattern itself is useless.

His fix is to treat every trading rule as a hypothesis to be tested against data. Run the rule across a large historical sample. Measure whether its returns are genuinely better than random. If they are not, throw the rule out, no matter how convincing the chart looked. He walks through the statistical machinery to do this honestly, including how to avoid fooling yourself with data mining (testing so many rules that one looks good by pure chance).

Personally, this is the part I value most. It is not the specific tests. It is the mindset shift from “this pattern feels right” to “show me the numbers, then show me they are not luck.”

The 10 key ideas, and how to actually use each one

The book gives you ideas and a method. Most readers absorb the ideas and never apply them. So here is each core idea paired with the one practical move that turns it into something you do, not just something you nodded at.

Key idea from the bookHow to apply it
Traditional technical analysis is subjective and often unreliableStop trusting a pattern because it “looks good”; demand a tested edge before you risk money
Statistical methods raise the accuracy of your predictionsTreat every trading rule as a hypothesis and test it on data before you trade it
Use data to test your trading ideasKeep a historical sample and run your rule across all of it, not three flattering charts
Hypothesis testing and Monte Carlo simulation evaluate strategiesUse Monte Carlo (thousands of randomised runs) to check whether a result could just be luck
Indicators like moving averages and RSI are tools, not magicKnow what each indicator actually measures, then test if it adds edge in your market
Bayesian inference updates probabilities as new data arrivesAdjust your confidence in a setup as fresh results come in, do not anchor to the first read
Risk management and stop-loss orders limit lossesDefine your stop and position size before entry, every time, no exceptions
Combine technical with fundamental and news analysisUse chart signals alongside context, not as the only input
Backtesting evaluates a strategy on historical dataBacktest honestly, and reserve fresh data the rule has never seen to confirm it
Excel and software tools implement the methodsYou do not need to code; a spreadsheet is enough to start testing rules properly

The thread running through every row is the same: test before you trust.

The trap the book is really warning you about

Here is the quiet danger Aronson keeps circling, and it is the most useful thing in the book.

If you test enough rules against enough data, some of them will look profitable by pure chance. Test a thousand random rules and a handful will have a great-looking equity curve that means absolutely nothing. This is data mining, and it has wrecked more “backtested” systems than bad luck ever has.

The cure is statistical discipline. You account for how many rules you tested. You use methods like Monte Carlo to ask, “could this result have happened by random chance?” And you keep a slice of data the rule has never touched, so a strategy that only memorised the past gets caught before it costs you real money.

Most traders skip this and wonder why their amazing backtest dies in live trading. The book exists to stop that.

Where the human edge comes in

Aronson hands you the toolkit to test signals, and that toolkit gets cheaper and faster every year. A modern scanner or AI can backtest a thousand rules before you finish your coffee. That part is close to free now.

What it will not do is keep you honest. It will not stop you from running the test a hundred ways until one version looks good. It will not tell you that your beautiful backtest curve is overfit nonsense, or that you cherry-picked the sample, or that you should walk away from a system that “works” only on data it has already seen. The statistics catch the luck; the discipline to accept what the statistics say is yours. That judgment, the willingness to kill your own good-looking idea because the evidence says so, is the first of the Five Edges no machine can trade for you.

Who should read this book?

Read it if you are a short-term trader who wants to stop guessing and start testing, and you are comfortable with a book that takes statistics seriously. It includes an introductory chapter for readers new to the stats, so you do not need to arrive fluent, but you do need patience.

Skip it, or save it for later, if you want quick setups you can trade tomorrow morning. This book changes how you think, not what you trade on Monday. It is focused on short-term trading, mostly in stocks, though the testing mindset travels to any market. And it explains the statistical methods clearly without giving you step-by-step software instructions, so you bring the implementation.

Personally, I would put it on the list of any serious trader who has ever lost money on a pattern that “always works.” It is the book that explains why it did not.

FAQ

What is Evidence-Based Technical Analysis about?
It argues that most traditional technical analysis is subjective and untested, and shows how to use statistical methods, hypothesis testing, Monte Carlo simulation, and Bayesian inference, to test whether a trading signal genuinely works or only looks good on a chart.

Is Evidence-Based Technical Analysis worth reading?
Yes, if you are a short-term trader who wants to test your ideas rigorously and you are comfortable with statistics. It is dense and stats-heavy, so it is less suited to beginners wanting ready-made setups.

Who is David Aronson?
David Aronson is a statistician and quantitative analyst with over twenty years in finance and a PhD in statistics. He wrote Evidence-Based Technical Analysis and a follow-up book on Bayesian inference in finance.

Do I need to know statistics to read it?
Some basic statistics helps, but the book includes an introductory chapter for newcomers. You do not need to code; a spreadsheet is enough to start applying the methods.

What is the main lesson of the book?
Do not trust a pattern or indicator because it looks good. Treat every trading rule as a hypothesis, test it against data, and use statistical discipline (especially guarding against data mining) to make sure the result is not just luck.


So, would you add Evidence-Based Technical Analysis to your reading list? And if you have already read it, what stuck with you? Let me know in the comments.

If you want the wider map of which trading books are worth your time, read the pillar: Best Investing and Trading Books of All Time.

Want the system behind the testing? Grab the free 15-Minute Swing Trading Starter Kit, the exact routine I use to scan once a day and trade any market in 15 minutes, built on rules I have actually tested.


About the author. Spencer Li is the founder of Synapse Trading and a Certified Financial Technician (CFTe) with 15 years of trading across stocks, forex, crypto, commodities, and bonds. His trade log is public, 404 trades, losses left in. He teaches low-risk swing trading in 15 minutes a day, one system for any market.

Education, not financial advice. Synapse Trading is not licensed by MAS to advise on investment products. Trading carries risk of loss; past performance is not indicative of future results.


Related

Best Investing and Trading Books of All Time (pillar) · Trading in the Zone by Mark Douglas · Reminiscences of a Stock Operator · How to start backtesting a trading strategy

0 Comments/by Spencer Li
https://synapsetrading.com/wp-content/uploads/2023/01/thumbnail-Book-Summary-Evidence-Based-Technical-Analysis-Applying-the-Scientific-Method-and-Statistical-Inference-to-Trading-Signals-by-David-Aronson.png 720 1280 Spencer Li https://synapsetrading.com/wp-content/uploads/2019/10/logo.jpg Spencer Li2023-01-28 18:50:222026-07-06 01:56:33Book Summary: Evidence-Based Technical Analysis by David Aronson
Spencer Li

Book Summary: The Black Swan by Nassim Nicholas Taleb

Book Summaries
thumbnail Book Summary The Black Swan by Nassim Nicholas Taleb

The Black Swan by Nassim Taleb: Summary, 10 Key Ideas, and What It Means for Traders

Last updated: 3 July 2026 · By Spencer Li, CFTe


The Black Swan, by Nassim Nicholas Taleb, is a book about rare, high-impact events that nobody saw coming, and why we are so bad at preparing for them. A “black swan” is Taleb’s term for an event that is (1) a huge outlier, (2) carries an extreme impact, and (3) gets explained away as predictable only after the fact. The 2008 crash, 9/11, and the rise of the internet are all black swans. Taleb’s core argument is simple: we spend our energy forecasting the ordinary and the known, so the rare events that actually move our lives and our portfolios catch us undefended. His advice is not to predict the next black swan (you can’t) but to build your life and your trading so a bad one cannot wipe you out, and a good one can pay you off. For a trader, that is the whole lesson: survive the tail, and stay positioned to catch it.

Here is the short version of the author, the book, the 10 key ideas, how to apply them, and what I actually use from it at the trading desk.

Who is Nassim Taleb?

Nassim Nicholas Taleb is a former options trader, risk manager, philosopher, and statistician. He spent years on trading desks before he wrote about them, so the ideas come from someone who put money on the line, not just theory.

The Black Swan is the second book in his “Incerto” series on uncertainty. The others are Fooled by Randomness, Antifragile, and Skin in the Game, and the ideas run across all four. If a concept below sounds bigger than one book, that is why.

What is the book about?

The book is about the impact of highly improbable events, and how badly we prepare for them.

Taleb’s claim is that we focus too much on the predictable and the known. We build neat models of a tidy world, and then a rare event we never modelled does most of the damage (or delivers most of the upside). His examples run from 9/11 to the internet, both of which reshaped the world and neither of which was in anyone’s forecast.

The takeaway is not “predict the unpredictable.” It is the opposite. Accept that you cannot forecast black swans, then arrange your affairs so you are robust to the bad ones and exposed to the good ones.

The 10 key ideas, at a glance

Taleb covers a lot of ground. Here are the ten ideas that matter most, in one table, with the plain version of each and where it bites a trader.

IdeaWhat it meansWhy it matters to a trader
Black swansRare, high-impact, hard-to-predict events, good or badThe few days that make or break your year are the ones nobody forecast
Narrative fallacyWe invent tidy stories to explain messy eventsThe clean “reason” the market moved is usually built after the fact
Precautionary principleBe more cautious when the downside is severe and the odds are unclearSize for the trade that can ruin you, not the one that probably won’t
The black swan problemWe overgeneralise from the past and assume tomorrow looks like yesterday“It has never dropped that far” is not a stop-loss
Fooled by randomnessWe credit skill for luck and blame luck for failureA winning streak in a bull market is not the same as edge
AntifragilitySome systems get stronger under stress, not just survive itBuild a book that benefits from volatility instead of fearing it
The Lindy effectThe longer something has lasted, the longer it is likely to lastOld, proven methods tend to outlive the latest fad
Survivorship biasWe study the winners and never count the deadEvery “this strategy made millions” hides the ones it bankrupted
Black swan blindnessWe underrate rare events even after living through themMemory of the last crash fades fast; the risk does not
Erring on the side of cautionWhen failure is catastrophic and odds are uncertain, stay conservativeProtect the downside first, chase the upside second

The thread running through all ten: the rare event dominates the average one, and our instincts are tuned for the average. That gap is where people blow up.

How to apply it: 10 practical moves

The ideas are only useful if they change what you do. Here is Taleb’s advice in action.

  1. Build resilience in. Diversify, and keep a safety net, so one bad event does not end the game.
  2. Embrace randomness. Stop trying to control the uncontrollable. Plan to be wrong, and survive being wrong.
  3. Avoid over-simplification. Respect that systems are complex. The clean model is usually hiding the risk, not removing it.
  4. Foster diversity. Diverse inputs, people, and experiences. Monocultures break in one blow.
  5. Seek out antifragile opportunities. Look for positions and habits that gain from disorder rather than just tolerate it.
  6. Avoid groupthink. Go looking for the view that disagrees with you. The herd is most confident right before it is wrong.
  7. Get skin in the game. Have a real personal stake in the outcome. Advice from people with nothing on the line is cheap.
  8. Use storytelling carefully. Stories help you rehearse for the unexpected, as long as you know they are rehearsals, not predictions.
  9. Seek multiple sources. Every single source carries a bias. Triangulate.
  10. Stay open to new ideas. Be willing to challenge what you already believe. The black swan rarely fits your current model.

What I actually use from The Black Swan as a trader

I will be honest. Not everything in a book like this survives contact with a real trading account. Two ideas did, and I use them every week.

The first is antifragility. Markets change fast, and a method built to perform only in calm conditions is fragile by definition. So I would rather hold a position structured to do better when volatility expands, and trade a system that is robust across regimes, than one finely tuned to last month’s market. Embracing the challenge, instead of bracing against it, is what keeps me growing as a trader rather than just defending.

The second is avoiding groupthink. The trading world runs on herd mentality. It is easy to follow the crowd, and most of the time the crowd is fine, right up until it is not. The book pushed me to be more critical of my own assumptions and to actively seek out the opposite view before I commit. That one habit has saved me more than any indicator.

Personally, I treat the rest of the book as context rather than instructions. It changes how I see risk. It does not tell me where to put a stop.

Where the human edge comes in

Here is the part a model cannot do for you. An algorithm can size a position, run a backtest, and tell you the historical odds in a second. What it cannot do is decide how much of your capital should be exposed to an event that has never happened in the data it was trained on. That is a judgment about the unknown, and the unknown is exactly what The Black Swan is about. The math is the easy part. Sizing for the tail you cannot see, and refusing to bet the account on a model that has never met a crisis, is the discipline, and it is one of the Five Edges no machine trades for you.

FAQ

What is a black swan event in simple terms?
A black swan is a rare, high-impact event that is almost impossible to predict beforehand and looks obvious only in hindsight. Taleb’s three tests are: it is a large outlier, it carries an extreme impact, and people rationalise it as predictable after it happens.

Is The Black Swan worth reading for traders?
Yes, but read it for how it reshapes your view of risk, not for trading tactics. It will not give you entries or stops. It will make you size more carefully and treat your forecasts with more suspicion, which for most traders is the more valuable lesson.

What is the main message of The Black Swan?
That we cannot predict rare, high-impact events, so we should stop trying and instead build our lives and portfolios to survive the bad ones and benefit from the good ones. Robustness beats prediction.

What is the difference between The Black Swan and Antifragile?
The Black Swan diagnoses the problem: rare events dominate, and we cannot forecast them. Antifragile prescribes the solution: build systems that gain from disorder. They are best read as a pair.

What is antifragility?
Antifragility is Taleb’s term for systems that get stronger under stress and volatility, rather than merely resisting it (robust) or breaking under it (fragile). A trading approach that performs better when markets get wild is antifragile.


Would you add The Black Swan to your reading list? And if you have already read it, what stuck with you? Let me know in the comments.

For more of the books that shaped how I trade, read the roundup: Best Investing and Trading Books of All Time.

Want the system behind the discipline? Grab the free 15-Minute Swing Trading Starter Kit. It is the exact routine I use to scan once a day and trade any market in 15 minutes.


About the author. Spencer Li is the founder of Synapse Trading and a Certified Financial Technician (CFTe) with 15 years of trading across stocks, forex, crypto, commodities, and bonds. His trade log is public, 404 trades, losses left in. He teaches low-risk swing trading in 15 minutes a day, one system for any market.

Education, not financial advice. Synapse Trading is not licensed by MAS to advise on investment products. Trading carries risk of loss; past performance is not indicative of future results.


Related

Best Investing and Trading Books of All Time (pillar) · Fooled by Randomness summary · Antifragile summary · Trading psychology and risk management

0 Comments/by Spencer Li
https://synapsetrading.com/wp-content/uploads/2023/01/thumbnail-Book-Summary-The-Black-Swan-by-Nassim-Nicholas-Taleb.png 720 1280 Spencer Li https://synapsetrading.com/wp-content/uploads/2019/10/logo.jpg Spencer Li2023-01-05 21:02:172026-07-06 00:31:56Book Summary: The Black Swan by Nassim Nicholas Taleb
Page 2 of 212

Free Trading Guides

Free Trading Guides

Blog Categories

  • Beginner's Guide
  • Blockchain & Crypto
  • Book Summaries
  • Economics & News Trading
  • Investing & Portfolio Management
  • Living Your Best Life
  • Market Analysis
  • Markets & Products
  • News & Events
  • Promotions
  • Risk & Money Management
  • Stock Trading
  • Technical Analysis & Price Action
  • Testimonials
  • Tools & Resources
  • Trading Psychology
  • Trading Strategies
  • Trading Tips
  • Travel & Lifestyle

Free Trading Guides

Free Trading Guides

Contact Us

Synapse Trading Pte Ltd
Registration No. 201316168H

Whatsapp: +65-8897-1204
Telegram: @iamrecneps
Email: info@synapsetrading.com

Links

Disclaimer
Privacy policy
Terms & Conditions
Contact us
Partnerships

© 2012-2024 Synapse Trading | All rights reserved | - powered by Enfold WordPress Theme
  • Link to Facebook
  • Link to X
  • Link to Instagram
  • Link to Youtube
  • Link to LinkedIn
  • Link to Mail
Scroll to top Scroll to top Scroll to top