Thumbnail banner weekly market wrap x3

Thumbnail banner weekly market wrap x3

For subscribers of our “Daily Trading Signals”, we now also include a “Weekly Market Report”, where we provide a weekly deep-dive on the market, including fundamentals, technical, economics, and portfolio management:

Click here for last week’s market report (16 October 2023)
Click here to subscribe for the latest market report (23 October 2023)
Click here to see the archives of all our past market reports

Market Recap & Upcoming Week

Last week, economic stability in the U.S. seemed a facade as consumer sectors, notably staples and discretionary, showed significant declines.

High-profile retailers like Dollar General and Target faced reduced spending, a fallout from inflation and pricier fuel. This downtrend made consumer stocks less attractive, pushing investors towards funds outside the consumer-goods sector.

Despite a few exceptions like Costco and Walmart, the overall retail sector struggled, prompting a cautious sentiment among investors. Consequently, there’s a noticeable pivot towards historically resilient investments, with companies like Nike and Mondelez International coming into focus.

Market volatility defined the week, with Federal Reserve Chair Jerome Powell’s comments stirring confusion among investors regarding monetary policy. This uncertainty, coupled with soaring bond yields and geopolitical stressors like the Israel-Palestine war, led major indices to close in the red.

Mixed Q3 earnings added to the chaos, with Netflix making gains, Tesla taking a dive, and regional banks disclosing higher expenses. Amid this, the market’s narrowness was highlighted — a stark contrast to previous bull markets, with gains heavily concentrated in the largest stocks.

Smaller companies, especially those indexed in the Russell Microcap, continued to underperform, missing the bull market’s benefits. This disparity underscores a growing concern in market health, calling for a more cautious approach in anticipation of potential economic shifts.

The strength of the US Dollar continues to loom over foreign exchange markets, inducing bearish trends in pairs like EUR/USD, while Bitcoin attempts a comeback, diverging from Ethereum’s stagnant momentum. Amidst these chaotic market movements, the spotlight also shines on precious metals, with gold poised as a viable hedge, and commodities, as oil prices aim for new summits.

Parallel to the corporate earnings saga, significant economic indicators are on the horizon. The U.S. Census Bureau’s forthcoming national retail sales data for September will serve as a critical measure of consumer spending resilience.

The housing sector is also under scrutiny with imminent updates on September housing starts, existing home sales, and the NAHB’s Housing Market Index for October.

These revelations will not only paint a clearer picture of the economic recovery but also potentially sway market sentiments. Investors are advised to stay vigilant, balancing their portfolios to navigate the unpredictability, possibly favoring bonds as stocks face downward pressure.


Daily Trading Signals (Highlights)
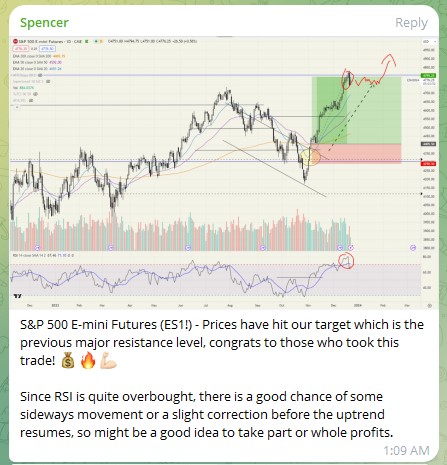
Trading Signals BTCUSD 221023

Bitcoin (BTCUSD) – Following up from this, we have seen Bitcoin rally more than 20% from the swing lows! 💰🔥💪🏻

It has just tested the $30k level, will it be able to break new highs this time?


Trading Signals NZDUSD 221023

NZDUSD – Prices are nearing the 2nd TP, which is near the support level, as well as the trend channel bottom. 💪🏻


Trading Signals US500 221023

S&P 500 (US500) – Following up on this, prices are heading downwards as predicted.

Prices are now below all 3 moving averages, and this could lead into a larger correction,

Overall news is more on the bearish side, with inflation creeping up, mixed corporate earnings, and escalating global conflicts.


Trading Signals XAUUSD 221023

Gold (XAUUSD) – Looking at the weekly chart of Gold, there is a good chance that it is going to continue its uptrend and break to new highs.

Gold tends to perform well in terms of market uncertainty and in times of global conflict and wars.


Subscribe for real-time alerts and weekly reports:
👉🏻 https://synapsetrading.com/daily-trading-signals


israel palestine war gaza

War, regardless of where or why, is disheartening. Ideally, a world without conflicts is what many desire.

However, reality demands us to be pragmatic, especially investors who need to perceive events as they unfold rather than how we wish them to be.

This article delves into the implications of the recent Israel-Hamas conflict and its potential consequences on financial markets.


How Have Various Markets Reacted in the Past?

The Israel-Hamas conflicts have occurred several times, particularly the notable escalations in 2008-09, 2012, and 2014.

The financial markets, while inherently sensitive to geopolitical events, have a multifaceted reaction based on a variety of factors, not just the conflict itself.

Let’s break down the general trends during these periods across various markets:

US Stocks (S&P 500)

2008-09: This was the period of the global financial crisis, so it’s difficult to isolate the impact of the Israel-Hamas conflict on US stocks. The S&P 500 was already in decline due to the financial meltdown.

2012: In November, the S&P 500 saw a short-lived decline which coincided with the beginning of the conflict. However, by the end of the month, it had mostly recovered.

2014: The conflict’s start in July saw a modest dip in the S&P 500, but it resumed its upward trend by August.

Bonds & Long-Term Treasury Notes

Geopolitical tensions generally lead to a “flight to safety” where investors buy up government bonds.

During the mentioned conflicts, yields (which move inversely to bond prices) on the long-term Treasury note tended to dip slightly, indicating increased demand for US government debt.

Gold

Gold is another “safe-haven” asset. During the Israel-Hamas escalations, the price of gold generally saw a rise.

For instance, in 2014, gold prices spiked in July but began declining again in August.

Commodities

The broader commodities market didn’t show a clear trend directly attributable to the conflicts, but individual commodities like oil did.

Oil

The Middle East is a significant oil-producing region. While Israel and Gaza aren’t major oil producers, the potential for broader regional instability affects oil prices.

In 2012, for example, oil prices rose by about 10% in the early days of the conflict but started declining as ceasefire talks began.

USD (US Dollar)

The US dollar generally serves as a safe-haven currency during geopolitical tensions.

It witnessed a slight strengthening during the periods of the conflicts, particularly against emerging market currencies.

Cryptocurrencies

Cryptocurrencies like Bitcoin were in their nascent stages during the earlier conflicts and hence didn’t serve as significant indicators.

By the 2014 conflict, Bitcoin’s price remained relatively stable, suggesting it wasn’t significantly impacted by the conflict.

Immediate Repercussions on the Financial Markets

Any disturbance in the Middle East directly affects the oil market due to the region’s control over approximately 30% of the global oil supply.

The recent conflict between Israel and Hamas is no exception, causing oil prices to surge by $3 a barrel at the start off the war.

This uptick is crucial as oil plays a significant role in inflation, which in turn influences the Federal Reserve’s decisions on interest rates.

Potential Setback for the Saudi-Israel-US Agreement?

The ongoing conflict brings into question the potential Saudi-Israel-US trilateral deal which entails:

  • Saudi Arabia’s formal recognition of Israel
  • The US offering weapon sales, security assurances, and support in developing a domestic nuclear program to Saudi Arabia
  • Saudi Arabia’s commitment to amplify oil supply by 2024

However, the recent aggressions make it challenging for Saudi Arabia to formally recognize Israel without facing domestic backlash.

Given the backdrop, the unfolding events hint at a larger geopolitical game, especially considering Iran’s support for Hamas.

Mid-Term Implications

Historically, conflicts in the Middle East have had mixed effects on oil prices.

For instance, the 2006 Lebanon War didn’t leave a lasting impact on oil prices once other macroeconomic factors set in.

Currently, two significant factors play a role: the decreasing demand for oil due to a global economic downturn and the decision of OPEC+ regarding oil supply in 2024.

However, the unpredictability of war makes it essential for investors to be cautious about potential escalations.

Potential for a Larger Scale Conflict

While we hope for peaceful resolutions, there’s always the risk of conflicts escalating.

A potential sequence could be:

  • Israel intensifying its military response with a substantial invasion of the Gaza Strip
  • Hezbollah’s involvement from Lebanon
  • If Hezbollah faces potential defeat, Iran might intervene either directly or indirectly

Given the strategic position of the Strait of Hormuz, any larger-scale conflict involving Iran could disrupt global oil supplies, leading to drastic implications for oil prices, inflation, and consequently, interest rates.

Broader Geopolitical Context

Understanding the Israel-Hamas conflict requires us to view it against the backdrop of the larger geopolitical landscape. This includes:

Changes in Global Energy Dynamics: The aftermath of the Ukraine conflict altered global energy routes, with Europe becoming more reliant on the US and Africa, while Russia shifted its focus to China and India.

Shifts in Global Power Balance: The recent years have seen a noticeable shift in the balance of power, with challenges to US dominance becoming more pronounced, signalling a transition towards a more multi-polar world order.


israel palestine war gaza

Historical Context of the Israel-Hamas Conflict

Origins

Late 19th to Early 20th Century: Zionism, a movement supporting the re-establishment of a Jewish homeland in what was then Palestine, grew in prominence. Simultaneously, Arab nationalism also emerged in response to Ottoman and Western colonial rule.

1917: The Balfour Declaration by the British government supported the establishment of a “national home for the Jewish people” in Palestine. Palestine at this time was part of the Ottoman Empire and post-World War I came under British control.

1947: The UN approved a partition plan to divide Palestine into separate Jewish and Arab states, with Jerusalem under international administration. This was accepted by the Jewish leadership but rejected by the Arab leaders.

1948: The State of Israel was proclaimed. Neighboring Arab states intervened, leading to the Arab-Israeli war.

Hamas’ Emergence

1987: Amidst the First Intifada (Palestinian uprising), Hamas (Islamic Resistance Movement) was founded. It emerged as a rival to the secular nationalist Fatah party, which dominated the Palestine Liberation Organization (PLO).

2006: Hamas won the Palestinian legislative elections, leading to tensions with Fatah. This culminated in Hamas taking over the Gaza Strip in 2007, after which the Palestinian territories became divided with Fatah controlling the West Bank and Hamas controlling Gaza.

2008-09, 2012, 2014: Major military conflicts erupted between Israel and Hamas, each resulting in significant casualties. The conflicts usually initiated with rocket attacks from Gaza into Israel and were followed by Israeli air strikes, with escalations leading to ground invasions.

Underlying Issues

Several key issues perpetuate the conflict:

Territory: The boundaries and status of Israel and a future Palestinian state remain contentious.

Jerusalem: Both Israelis and Palestinians consider Jerusalem their capital.

Refugees: The Palestinian demand for the right of return of refugees who fled or were expelled during the Arab-Israeli war.

Security: Concerns over recognition, attacks, and the safety of citizens persist on both sides.

The Israel-Hamas conflict is part of the broader Israeli-Palestinian conflict and remains one of the most enduring and complex in modern history.

Concluding Thoughts

While the ongoing events between Israel and Hamas have clear and immediate financial implications, it’s essential to understand their place in the broader geopolitical context.

The changes in energy dynamics and the evolving global power structures play a significant role in shaping these events.

Observing these shifts provides a comprehensive understanding and helps in making informed investment decisions.

As investors, what can we do to protect our portfolio against unexpected events like this?

Let me know in the comments below.

Thumbnail banner weekly market wrap x3

Thumbnail banner weekly market wrap x3

For subscribers of our “Daily Trading Signals”, we now also include a “Weekly Market Report”, where we provide a weekly deep-dive on the market, including fundamentals, technical, economics, and portfolio management:

Click here for last week’s market report (09 October 2023)
Click here to subscribe for the latest market report (16 October 2023)
Click here to see the archives of all our past market reports

Market Recap & Upcoming Week

Last week witnessed significant global developments. In a shocking turn of events on October 7th, Gaza’s militant group, Hamas, launched sudden attacks against Israel, resulting in casualties on both sides. This unexpected assault, coinciding with the Jewish holiday of Simchat Torah, has reignited concerns reminiscent of the unanticipated 1973 Mideast war. The backdrop to this is a tumultuous landscape in Israel, with disputes over the Al-Aqsa Mosque compound and the expansion of Jewish settlements adding to the volatility. Furthermore, this surge in external conflict comes at a time when Israel is already under internal strain due to widespread protests against Prime Minister Netanyahu’s legislative proposals.

On the economic front in the U.S., a subdued sigh of relief may be in order as data reveals a slowdown in the inflation rate. September’s rate stands at 3.7% year-on-year, and 0.4% from the previous month. The slower pace, however, does not signify an all-clear for consumers. With core inflation up by 4.1% since last September and the Federal Reserve’s anticipated decisions regarding interest rates, there’s an air of cautious anticipation. A particular point of concern is the surge in mortgage rates, hitting a 23-year high, posing potential challenges for home buyers in the near future.

Brace yourselves for a whirlwind of economic updates next week as we dive deep into one of the most action-packed earnings periods of the year. Leading the charge are global titans like Tesla, Netflix, and Johnson & Johnson, followed closely by financial giants such as Bank of America, Goldman Sachs, and Morgan Stanley. Furthermore, with AT&T and Lockheed Martin also unveiling their reports, expect a comprehensive insight into various sectors, shaping the financial narratives for the weeks to come.

In parallel with these corporate disclosures, pivotal economic indicators are set to be unveiled. Tuesday promises to be especially enlightening with the U.S. Census Bureau releasing September’s national retail sales data, offering a snapshot of the health of consumer spending in the country. The real estate enthusiasts should also keep their eyes peeled for the latest figures on September housing starts and existing home sales, not to mention the much-anticipated National Association of Home Builders’ Housing Market Index for October, shedding light on the housing market’s current pulse.


Trading Signals EURCHF 141023

EURCHF – Very nice clean trade with 190+ pips profit, congrats to those who took this trade with us! 💰🔥💪🏻


Trading Signals USDSGD 141023

USDSGD – Nice bull flag forming on top of resistance-turned-support, signalling more upside!


Trading Signals EURUSD 141023

EURUSD – Following up on this, we have increased our target profit to capture more profits for this trade.


Trading Signals US500 141023

S&P 500 (US500) – Following up on this, prices are unable to break above the 20 & 50-EMA, and there is a possibility they may continue downwards.

Next major level of support is the 200-EMA, which coincides with a support level on the chart.


Subscribe for real-time alerts and weekly reports:
👉🏻 https://synapsetrading.com/daily-trading-signals


Thumbnail banner weekly market wrap x3

Thumbnail banner weekly market wrap x3

For subscribers of our “Daily Trading Signals”, we now also include a “Weekly Market Report”, where we provide a weekly deep-dive on the market, including fundamentals, technical, economics, and portfolio management:

Click here for last week’s market report (02 October 2023)
Click here to subscribe for the latest market report (09 October 2023)
Click here to see the archives of all our past market reports

Market Recap & Upcoming Week

Last week, Wall Street exhibited a marked change in reaction to the U.S. government’s monthly jobs report, which has lately seen an unprecedented pattern of downward revisions. This has instilled caution among traders, resulting in fewer stock trades and subdued market movements on the days of these report releases.

The ongoing trend, marking the first time since 1979 that each monthly report has revised its numbers downward, has unsettled the previously held confidence in an economy supporting higher interest rates. With traders gradually distancing themselves from jobs data, they’re now focusing on data sets with fewer adjustments.

On the brighter side, the U.S. economy showcased a significant uptick in September, adding 336,000 jobs and surpassing Wall Street’s expectations. Interestingly, the unemployment rate remained stable at 3.8%, defying predictions of a dip to 3.7%.

Though this robust growth is at odds with Fed Chair Jerome Powell’s inclination for a more moderate labor market, the general market belief, given the positive stock rebound post the report, is that the Federal Reserve is likely to retain the current interest rates in the forthcoming meeting.

Earnings season is set to begin in full swing post the Indigenous Peoples’ Day holiday. A slew of notable names from the financial sector, such as JPMorgan Chase, Wells Fargo, and Citigroup, are scheduled to unveil their quarterly results.

In addition to the financial giants, market participants should also keep an eye on earnings from major corporations like PepsiCo, Delta Air Lines, and Walgreens Boots Alliance. But it’s not just about earnings. Inflation watchers should mark their calendars for Wednesday and Thursday when updates on producer and consumer prices will be released, offering insights into the current economic landscape.

The week promises more than just earnings and inflation data. On Wednesday, the Federal Reserve is set to disclose meeting minutes from its recent FOMC gathering, potentially shedding light on their monetary policy outlook.

Meanwhile, for those inclined towards retail, Amazon’s “Prime Big Deal Days” is an event to watch. Kicking off on Tuesday, this two-day shopping spree offers Prime members exclusive deals on a wide array of brands and products, making it a potential boost for mid-month retail sales.

Subscribe for real-time alerts and weekly reports:
👉🏻 https://synapsetrading.com/daily-trading-signals


The advance/decline ratio (ADR) is a widely used market-breadth indicator in technical analysis.

It compares the number of stocks that closed higher (advancers) against the number of stocks that closed lower (decliners) from the previous trading day.

The ratio is calculated by dividing the number of advancing stocks by the number of declining stocks.

How the Advance/Decline Ratio (ADR) Works

Investors often use the advance/decline ratio to gauge market trends and detect potential reversals.

By comparing the ratio to the performance of a stock index, such as the NYSE or Nasdaq, traders can assess whether a broad spectrum of stocks is participating in a market rally or sell-off, or if the movement is concentrated in a minority of stocks.

A low ADR can suggest an oversold market, while a high ADR can indicate that the market is overbought.

These conditions may signal an impending reversal. For technical traders, identifying these directional changes is crucial for successful trading strategies.

Although the ADR provides helpful insights, it is rarely used as a standalone tool.

When paired with other metrics, such as moving averages, it becomes a powerful component of a broader market analysis strategy.

The ADR can be calculated over various time frames, such as daily, weekly, or monthly periods, to track short-term and long-term trends.

Types of Advance/Decline Ratios (ADR)

  • Standalone Ratio: On its own, the ADR reveals whether the market may be overbought or oversold. A high ADR suggests that more stocks are advancing, possibly indicating overbought conditions, while a low ADR signals that more stocks are declining, possibly pointing to an oversold market.
  • Trend Analysis: Observing the ADR over time helps traders identify whether the market is trending bullish or bearish. A steadily increasing ADR suggests a bullish trend, while a declining ratio may signal a bearish trend.

Concluding Thoughts

The advance/decline ratio is an essential tool for traders and analysts looking to understand the underlying strength of a market.

By combining it with other technical indicators, traders can gain valuable insights into market conditions and identify potential shifts in trends.

Although useful, the ADR should not be used in isolation but as part of a comprehensive analysis to improve trading decisions.