Last week, the market continued to whipsaw, but for short-term traders, this provided many good swing trades on markets such as stocks, crypto, commodities, etc.
Most of my portfolio is still held in cash, because I do not want to risk my capital in such volatile markets, but using just a small percent of my portfolio to swing trade is enough to generate $10-20k of monthly profits as some side income while waiting for the markets to stabilise.
The next major thing to look out for is the upcoming rate hike, with an expected 100 basis points, so we will need to see how the markets react to that.
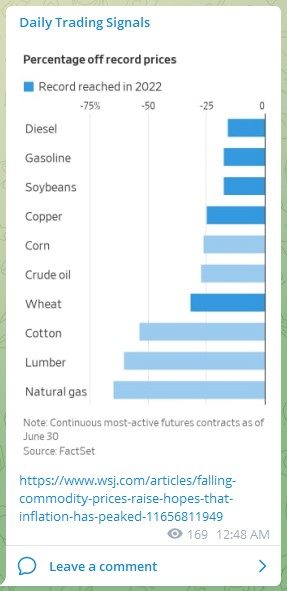
Strangely, the prices of commodities have already started to come down, so that might help tame inflation.
Stay tuned in our “Daily Trading Signals” Telegram channel for more daily profit opportunities!

[Photo: Sapa, Vietnam – See my full travel photo log!]
For our weekly market wrap, we go through some of the trade calls and analysis from last week, which gives us valuable insights for the week ahead.
We cover 3 main markets with a total of 200+ counters, so we will never run out of trading opportunities:
- Forex, CFDs, commodities, bonds
- US stocks, ETFs, global stock indices
- Cryptocurrencies, crypto indices
By covering a broad range of markets, we can focus our attention (and capital) on whichever market currently gives the best returns.

Table of Contents
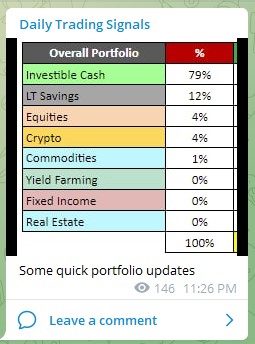
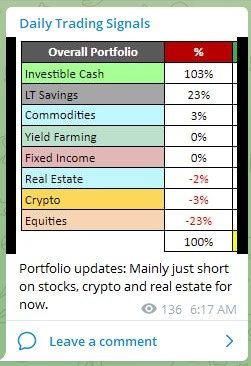
Portfolio Highlights
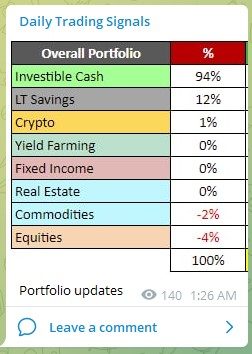
Portfolio updates
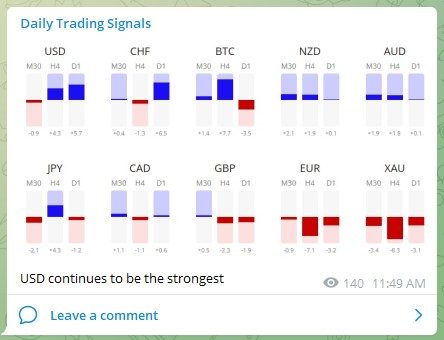
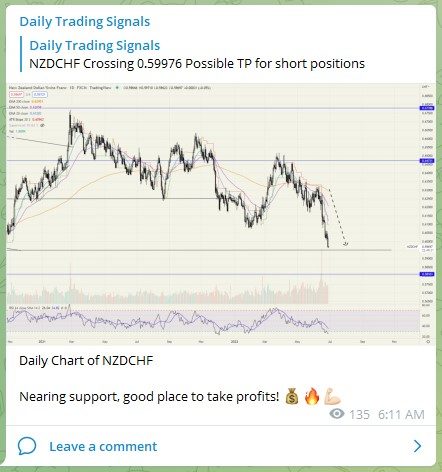
Forex & Commodities Market Highlights
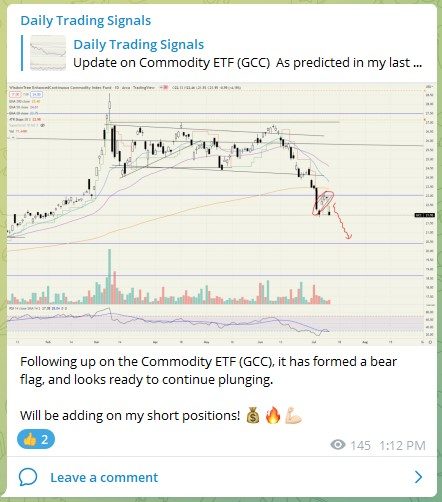
Following up on the Commodity ETF (GCC), it has formed a bear flag, and looks ready to continue plunging.
Will be adding on my short positions! ????

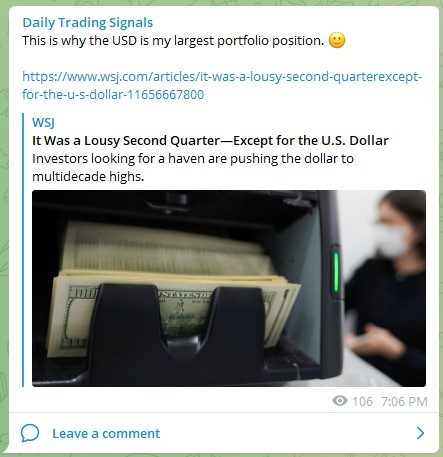
Eurozone’s reliance on Russian gas and a closer examination of bond markets suggest there is little immediate upside for the single currency
https://www.wsj.com/articles/parity-is-unlikely-to-be-the-bottom-for-the-euro-11657810219
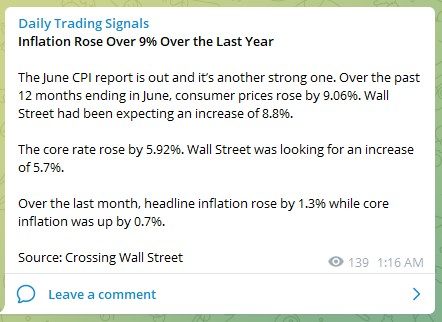
Inflation Rose Over 9% Over the Last Year (Source: Crossing Wall Street)

Global inflation rates table
Stock & Bond Market Highlights
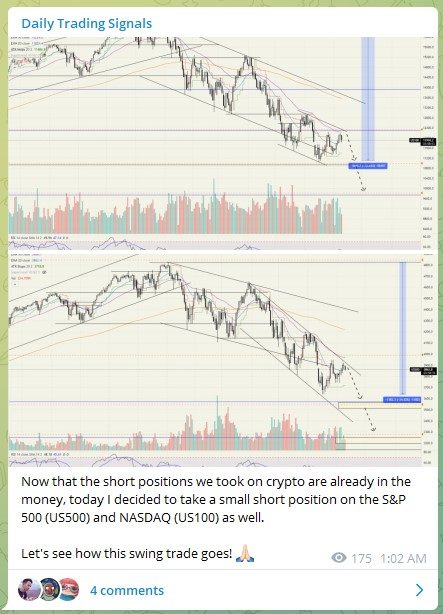
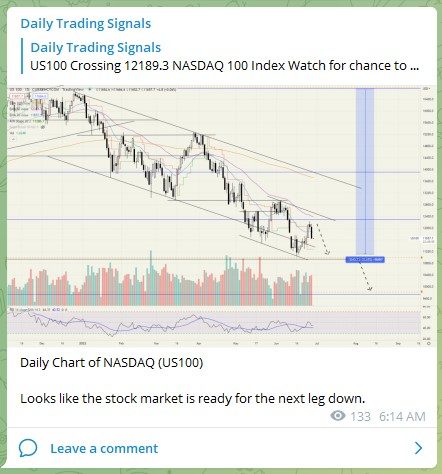
Now that the short positions we took on crypto are already in the money, today I decided to take a small short position on the S&P 500 (US500) and NASDAQ (US100) as well.
Let’s see how this swing trade goes! ??

The stock markets (US100, US500) look pretty choppy, will be taking profits on my short positions for now.
Crypto Market Highlights

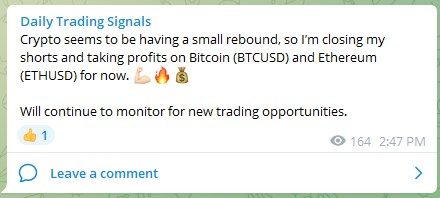
Taking profits from my Bitcoin (BTCUSD) trade over the weekend! ????

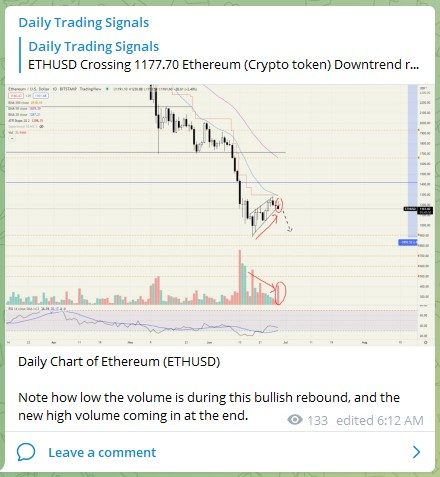
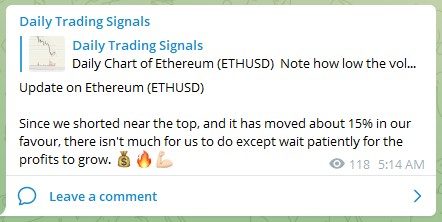
Taking profits from my Ethereum (ETHUSD) trade over the weekend! ????
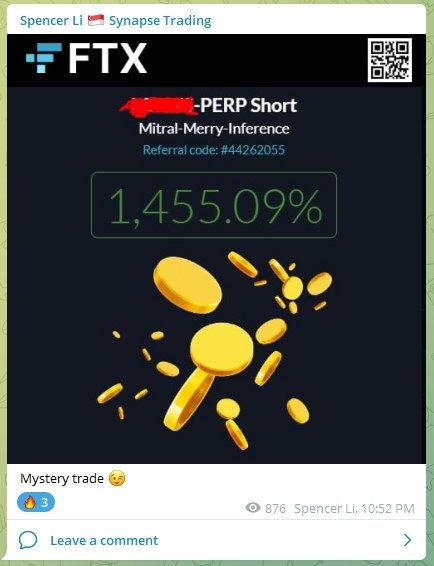
Mystery trade ?

Decided to take a small short position on Ethereum (ETHUSD) and Bitcoin (BTCUSD), let’s see how it turns out! ??

Have had 4 excellent swing trades on Ethereum (ETHUSD) in recent times, since the market is rather choppy.
Now, I’m net long on crypto and waiting to see if it can breakout of that range.

OpenSea, one of the largest marketplaces for NFTs (nonfungible tokens), said Thursday it would cut a fifth of its staff as the crash in cryptocurrency prices continued to wreak havoc on digital-asset firms.
https://www.wsj.com/articles/nft-marketplace-opensea-to-lay-off-20-of-employees-11657830342
Good luck, and may next week bring more excellent profits!