

Monthly Market Wrap (July 2026)
Join our Telegram channel for more market analysis & trading tips: t.me/synapsetrading
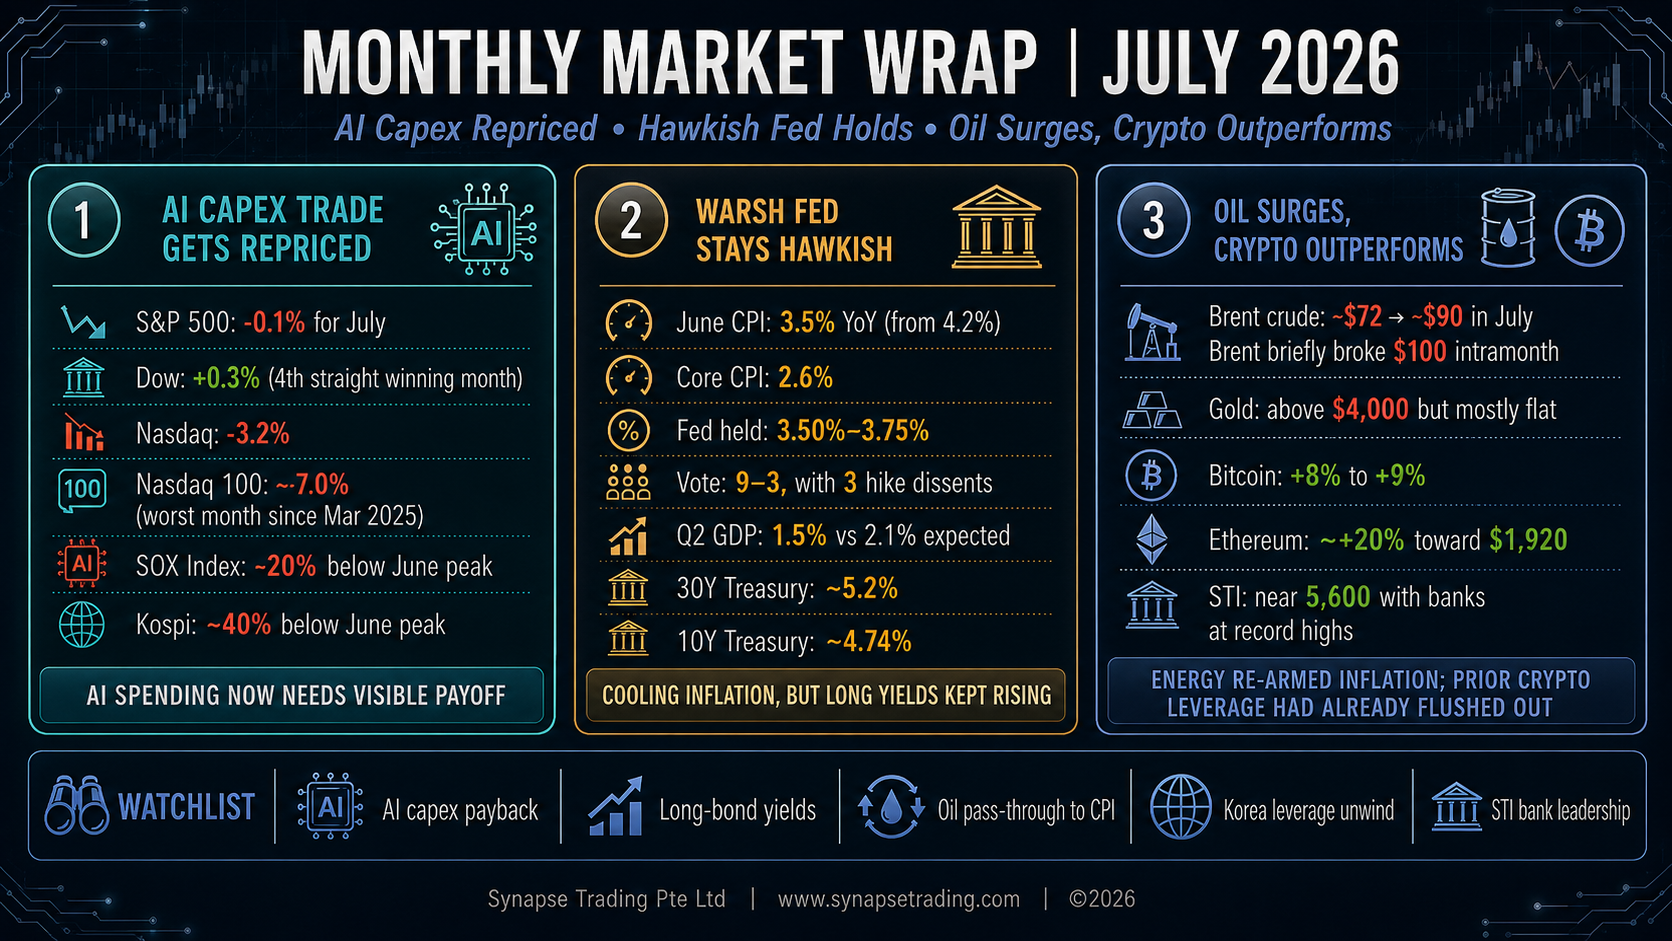
| Major Index | July 2026 Performance | What It Signalled |
|---|---|---|
| S&P 500 | About -0.1% | A flat headline masked severe internal weakness. |
| Dow Jones | About +0.3% | Fourth straight winning month, supported by value, financials and industrials. |
| Nasdaq Composite | About -3.2% | Technology leadership weakened materially. |
| Nasdaq 100 | Close to -7% | Worst month since March 2025 as megacap and semiconductor pressure intensified. |
Table of Contents
1. Global Stock Market Trends
The month opened on the front foot. A soft June jobs report on July 2 took a Fed hike off the table for the moment and pushed the Dow to a record close of 52,900, and by July 6 it printed above 53,000 for the first time ever at 53,055.91. Money rotated out of megacap tech and into financials, industrials and value, which is why the Dow kept setting records while the chip complex quietly bled. Same tape, two directions, depending on where you were standing.
Then the whipsaw took over, and it was relentless. Semiconductor leadership flipped almost daily. The cleanest read on the month is the Philadelphia Semiconductor Index, which went from near record ground to a full bear market, down more than 20% from its June peak and off around 17% in July alone.
Two things did the damage. First, TSMC and Alphabet both got sold for spending too much on AI. Second, a Chinese startup called Moonshot AI released Kimi K3, a 2.8 trillion parameter open model that traders treated as a second DeepSeek moment, a warning that AI compute might get cheaper far faster than the whole capital-spending case assumes. Nvidia briefly lost its crown as the world’s most valuable company to Apple in the worst of it.
The real epicentre, though, was Seoul. South Korea’s Kospi had ridden the memory boom to euphoria, then it fell apart. SK Hynix crashed about 15% in a single session on July 13, its worst day on record, just days after a blockbuster US debut. By late July the index was triggering marketwide circuit breakers on consecutive days, a historic first, and it finished roughly 40% below its June peak in its worst month ever, erasing more than two trillion dollars in value.
Goldman Sachs later put numbers on the human cost: more than 1.2 million leveraged retail accounts hit with margin calls and somewhere between 320,000 and 360,000 fully liquidated, about 3.4% of the adult population. That is the part they do not teach you about leverage. When it unwinds, it does not care how good the underlying story is.
The month ended the way June did, with a violent rebound. On July 30 the S&P jumped 1.66%, the Nasdaq 2.78%, and Microsoft alone surged 15.5%, its best day since 2008 and the largest single-day value gain any company has ever posted. July 31 added to it as Amazon ripped higher on cloud results. But a huge slice of each day’s move came from one or two mega-caps rather than broad new leadership, so I read the finish as a bounce inside a broken trend, not a fresh all-clear.
Overseas the pattern rhymed. Japan’s Nikkei fell to a two-month low near 62,365 in the chip rout. Europe set records early in the month, with the Stoxx 600 and Germany’s DAX at all-time highs as investors broadened beyond technology. Closer to home, Singapore was an island of calm. The Straits Times Index pushed to fresh records near 5,600 with DBS, OCBC and UOB all trading at or close to all-time highs, helped by resilient wealth-management income and mild June inflation of 1.9% headline and 1.6% core.
| Region / Market | July Development | Key Driver |
|---|---|---|
| United States | Dow records, Nasdaq weakness and a late megacap rebound | Rotation away from semiconductors and uneven AI-capex reactions |
| South Korea | Severe Kospi collapse and consecutive circuit breakers | Leveraged memory-chip positioning and forced liquidation |
| Japan | Nikkei fell to a two-month low near 62,365 | Regional semiconductor selloff |
| Europe | Stoxx 600 and DAX reached records early in July | Broader participation beyond technology |
| Singapore | STI pushed toward fresh records near 5,600 | Bank strength, wealth-management income and mild inflation |
2. Macroeconomic and Central Bank Developments
The macro story in July was a genuine tug of war between cooling inflation data and a Fed that refuses to believe it yet.
The good news came mid-month. June CPI, released July 15, was a clean downside surprise. Headline prices fell 0.4% on the month, the biggest monthly drop in more than six years, dragging the annual rate down to 3.5% from 4.2% in May and well under the 3.8% economists expected. Core was flat on the month at 2.6% year over year. Energy did the heavy lifting, down 5.7%. The next day, June producer prices fell another 0.3%. For about a week the market decided the inflation scare was over, and it rallied hard.
The Fed did not agree. At the July 28 to 29 meeting the committee held rates at 3.50% to 3.75% for a fifth straight time, but it did so on a hawkish 9 to 3 vote, with three members dissenting in favour of a hike. One of them was Neel Kashkari, a long-time dove. That was the first three-way dissent in a decade. Chair Kevin Warsh called the economy “impressively resilient” and inflation “elevated,” and gave no forward guidance.
The advance reading of second-quarter GDP came in at just 1.5% against 2.1% expected, while the GDP price deflator ran hot at 6.3%. Weak growth plus hot prices is the textbook definition of stagflation, and it is the one combination a central bank has no clean answer for. The employment cost index also ran hot at 0.9%, and five-year inflation expectations stayed stuck at 3.3%. The one soft spot was core PCE at a benign 0.1% on the month.
| Indicator / Decision | July Reading | Market Interpretation |
|---|---|---|
| June CPI, month-on-month | -0.4% | Largest monthly decline in more than six years. |
| June CPI, year-on-year | 3.5% | Down from 4.2% and below the 3.8% consensus. |
| Core CPI, year-on-year | 2.6% | Underlying inflation appeared cooler. |
| June PPI | -0.3% | Added to the temporary disinflation narrative. |
| Fed funds target | 3.50%–3.75% | Held for a fifth straight meeting. |
| Fed vote | 9–3 | Hawkish dissent signalled growing support for hikes. |
| Q2 GDP | 1.5% | Below the 2.1% expectation. |
| GDP price deflator | 6.3% | Hot prices intensified stagflation concerns. |
| Core PCE, month-on-month | 0.1% | The main data point equity investors chose to emphasise. |
The bond market was blunter than the stock market. The 30-year Treasury yield closed the month near 5.2%, its highest since 2007, and the 10-year pushed to roughly 4.74%, an 18-month high, even as the 2-year eased. That kind of twist steepening, where long rates rise faster than short ones, is the market telling the Fed it looks too soft on inflation. Duration was the enemy all month.
Abroad, the central banks pulled in opposite directions. The Bank of Japan held at 1% but the yen sank to a fresh 40-year low near 164 per dollar, while eurozone inflation returned to 2.0% and markets priced roughly a 70% chance of an ECB cut in September. A Fed flirting with hikes, an ECB leaning toward cuts, and a BOJ watching its currency crumble is a recipe for a firm dollar and strained funding trades.
3. Geopolitical Developments
Oil was the transmission belt for geopolitics again, and July was a rollercoaster. The US-Iran conflict, which looked like it was de-escalating at the end of June, blew back open. Washington revoked the general license letting Iran sell its crude, Iranian forces struck vessels near the Strait of Hormuz, and the ceasefire was declared over, with the first US combat deaths since March.
The Houthis declared a naval blockade of Saudi Arabia on July 20 and struck tankers in the Red Sea, putting both of Saudi Arabia’s main export routes at risk at the same time. Brent broke $100 a barrel on July 24 for the first time since May. Late in the month Iran fired ballistic missiles at US forces, all intercepted, the US struck Iranian targets in return, and Tehran claimed fresh tanker attacks in Hormuz that Western maritime monitors never confirmed.
The crude bid off a Middle East headline faded almost as fast as it appeared. Every spike was sold within days on a diplomacy rumour, then re-armed on the next escalation. But the net direction was clear: Brent started July near $72 and finished around $90, up more than 20% for the month, its strongest since March.
Trade policy added another upward nudge to inflation. New replacement tariffs of 10% to 12.5% on 60 trading partners took effect late in the month, a 50% tariff on copper imports landed on August 1, and the administration kept firing off tariff letters through July.
| Geopolitical / Policy Driver | Market Channel | July Effect |
|---|---|---|
| US-Iran conflict | Crude oil and inflation expectations | Repeated oil spikes and renewed supply-risk premium |
| Red Sea and Hormuz disruption risk | Shipping and Saudi export routes | Brent briefly moved above $100 |
| Replacement tariffs | Imported goods prices | Added pressure to the disinflation narrative |
| 50% copper tariff | Industrial inputs | Raised concern over future manufacturing costs |
4. Corporate Earnings and Stock Market Movers
This was the heart of July, because second-quarter earnings were the referee for the whole AI-capex fight, and the verdict was clear. Strong numbers were no longer enough. The market wanted proof that the enormous spending is actually earning a return, and it punished anyone who could not show it.
The banks opened the season strong. Goldman Sachs posted the best quarter in its history, with revenue of $20.3 billion and earnings of nearly $21 a share, up 39% on the year on a trading and dealmaking surge. JPMorgan’s profit jumped 41%, and Morgan Stanley put up revenue of $21.3 billion and earnings of $3.46 a share, powered by a record $6.3 billion in equities trading. Citigroup, Wells Fargo and Bank of America also came in strong.
Then the AI names started reporting, and the mood changed. TSMC delivered a record quarter with revenue of $40.2 billion, net profit up 77% and gross margins near 68%. The market sold it anyway because TSMC lifted its full-year capital spending to $60–$64 billion from $52–$56 billion and flagged another $100 billion for Arizona.
Alphabet beat with revenue of $119.8 billion and cloud sales up 82%, but it raised 2026 capex guidance to $195–$205 billion. The stock fell about 7% the next day. Tesla reported record revenue of $28.2 billion and record deliveries above 480,000 vehicles, but operating income fell 57%, adjusted earnings of $0.33 missed the $0.51 consensus, and free cash flow swung to a deficit. Tesla dropped around 14%.
Intel was one bright spot. Revenue rose 25% to $16.1 billion, driven by a 59% surge in its data-center and AI business, and it raised its outlook, jumping about 7% after hours.
The four largest reports came at month end and split down the middle. Microsoft beat with revenue of $90 billion, Azure growth of 43% and cloud revenue past a $100 billion annual run-rate. Even with capital spending up 70% to $41 billion, the market rewarded it, sending the stock up 15.5% on July 30. Amazon beat with revenue of $200.6 billion, AWS growth of 37% and earnings of $5.75 a share. It lifted 2026 capex guidance to $220 billion and jumped 13% to 15% in the following session.
Meta sank nearly 10% after earnings of $6.18 missed by more than a dollar, expenses ballooned 55% to $42 billion, net income fell 14% and guidance disappointed. Apple slipped about 7% despite topping headline estimates because Services and Greater China both missed.
| Company | Key Result | Capex / Strategic Issue | Market Reaction |
|---|---|---|---|
| Goldman Sachs | Revenue $20.3B; EPS near $21 | Trading and dealmaking surge | Strong |
| TSMC | Revenue $40.2B; net profit +77% | Capex raised to $60B–$64B | Sold despite record results |
| Alphabet | Revenue $119.8B; cloud +82% | 2026 capex raised to $195B–$205B | About -7% |
| Tesla | Revenue $28.2B; EPS $0.33 vs $0.51 expected | Heavy AI, Optimus and robotaxi spending | About -14% |
| Intel | Revenue $16.1B; data-centre and AI +59% | Raised outlook | About +7% after hours |
| Microsoft | Revenue $90B; Azure +43% | Capex +70% to $41B, but returns remained visible | +15.5% |
| Amazon | Revenue $200.6B; AWS +37%; EPS $5.75 | 2026 capex guidance raised to $220B | About +13% to +15% |
| Meta | EPS $6.18; net income -14% | Expenses +55% to $42B | Nearly -10% |
| Apple | iPhone and EPS beat; Services and China missed | Weak mix despite headline beat | About -7% |
A few more names were worth flagging. Nvidia fell about 5% on July 28 on reports it may guarantee some $250 billion of OpenAI’s data-center leases. Micron rose 12% one week and SanDisk 14%, then SanDisk fell 11% and SK Hynix 15% the next. China’s ChangXin Memory closed up 466% on its Shanghai debut. Away from tech, Coca-Cola gained 5%, Sherwin-Williams jumped 8.5%, General Motors beat and raised guidance, and PayPal leapt 15% on a $53 billion takeover bid from Stripe and Advent.
5. Commodities, Bonds and Other Assets
Brent gained more than 20% on the month to around $90, with WTI near $85, and it did so in a series of violent spikes and fades rather than a clean trend.
Gold was the more interesting tell. The metal held above $4,000 and remained up roughly 21% over the past year on steady central-bank buying, but it went nowhere in July and actually fell on some of the days with the most geopolitical fear. The reason was real yields. When the 30-year is pushing 5.2% and climbing, non-yielding gold has to fight the coupon, and it loses.
Bonds told the cleanest story of all. The long end sold off hard, with the 30-year at its highest since 2007 and the 10-year at an 18-month high, while the front end held. The long-bond ETF sat near its 52-week low. When duration itself is the problem, Treasuries stop being a hedge.
| Asset | July Level / Move | Interpretation |
|---|---|---|
| Brent crude | More than +20%, ending near $90 | Geopolitical risk re-armed the inflation tail. |
| WTI crude | Near $85 | Followed the same volatile geopolitical pattern. |
| Gold | Held above $4,000; broadly flat in July | Rising real yields offset safe-haven demand. |
| 10-year Treasury yield | Roughly 4.74% | 18-month high; duration remained under pressure. |
| 30-year Treasury yield | Near 5.2% | Highest since 2007. |
6. Bitcoin and Ethereum
In a July defined by a hawkish Fed, an AI selloff and rising real rates, Bitcoin and Ethereum were the best-performing major asset class of the month.
Bitcoin started July near $60,000, dipped toward $63,000 late in the month, and finished with a gain of roughly 8% to 9%, its best month in about a year. Ethereum did far better, entering the month near $1,600 and trading up toward $1,920, a gain of around 20%.
The reason both held up is the opposite of what hurt Korea. The leverage was already gone. June had flushed speculative positioning out of crypto in a brutal drawdown, so when rate and risk pressure hit in July, there were fewer forced sellers left to hit the bid. Coinbase stumbled at the end, falling about 10% on an earnings miss.
| Crypto Asset | Approximate July Move | Key Explanation |
|---|---|---|
| Bitcoin | About +8% to +9% | Less speculative leverage remained after June’s washout. |
| Ethereum | About +20% | Outperformed as forced selling pressure stayed limited. |
| Coinbase | About -10% after earnings | Company-specific results overrode broader crypto strength. |
7. Concluding Thoughts
July argued with itself even more loudly than June did, and this time the argument had a winner. The AI-capex trade got its verdict, and the verdict is that spending is no longer a free pass. Microsoft and Amazon showed the market will still pay up for AI spending that delivers visible cloud growth. Alphabet, Tesla and Meta showed what happens to spending that cannot yet point to the return.
The bigger backdrop is a regime tension that has not resolved. Inflation is cooling, with June CPI back to 3.5%, but the Fed does not trust it, oil re-arms the tail every time the Middle East flares, and second-quarter growth came in soft against hot prices. That is why the long end of the bond market is at levels not seen since 2007, why gold went nowhere despite a war, and why the Fed is openly debating hikes rather than cuts.
Personally, my approach has not changed much this month, only tightened. When leadership is whipsawing this fast, I would rather trade smaller and let the setup come to me than chase the daily flip in the chip names. I keep my stops honest, stay short duration in bonds until the Fed shows its full hand, treat gold as a hedge but expect chop while real yields climb, and watch the mega-cap capex numbers as the real signal for the AI trade rather than the daily headlines.
 Our flagship mentoring program is suitable for both beginners and advanced traders, covering the 4 strategies which I used over the past 15 years to build up my 7-figure personal trading portfolio.
 If you're looking for the best trading opportunities every day across various markets, and don't want to spend hours doing the research yourself, check out our private Telegram channel!

Leave a Reply
Want to join the discussion?Feel free to contribute!