Monthly Market Wrap (June 2026)
Join our Telegram channel for more market analysis & trading tips: t.me/synapsetrading
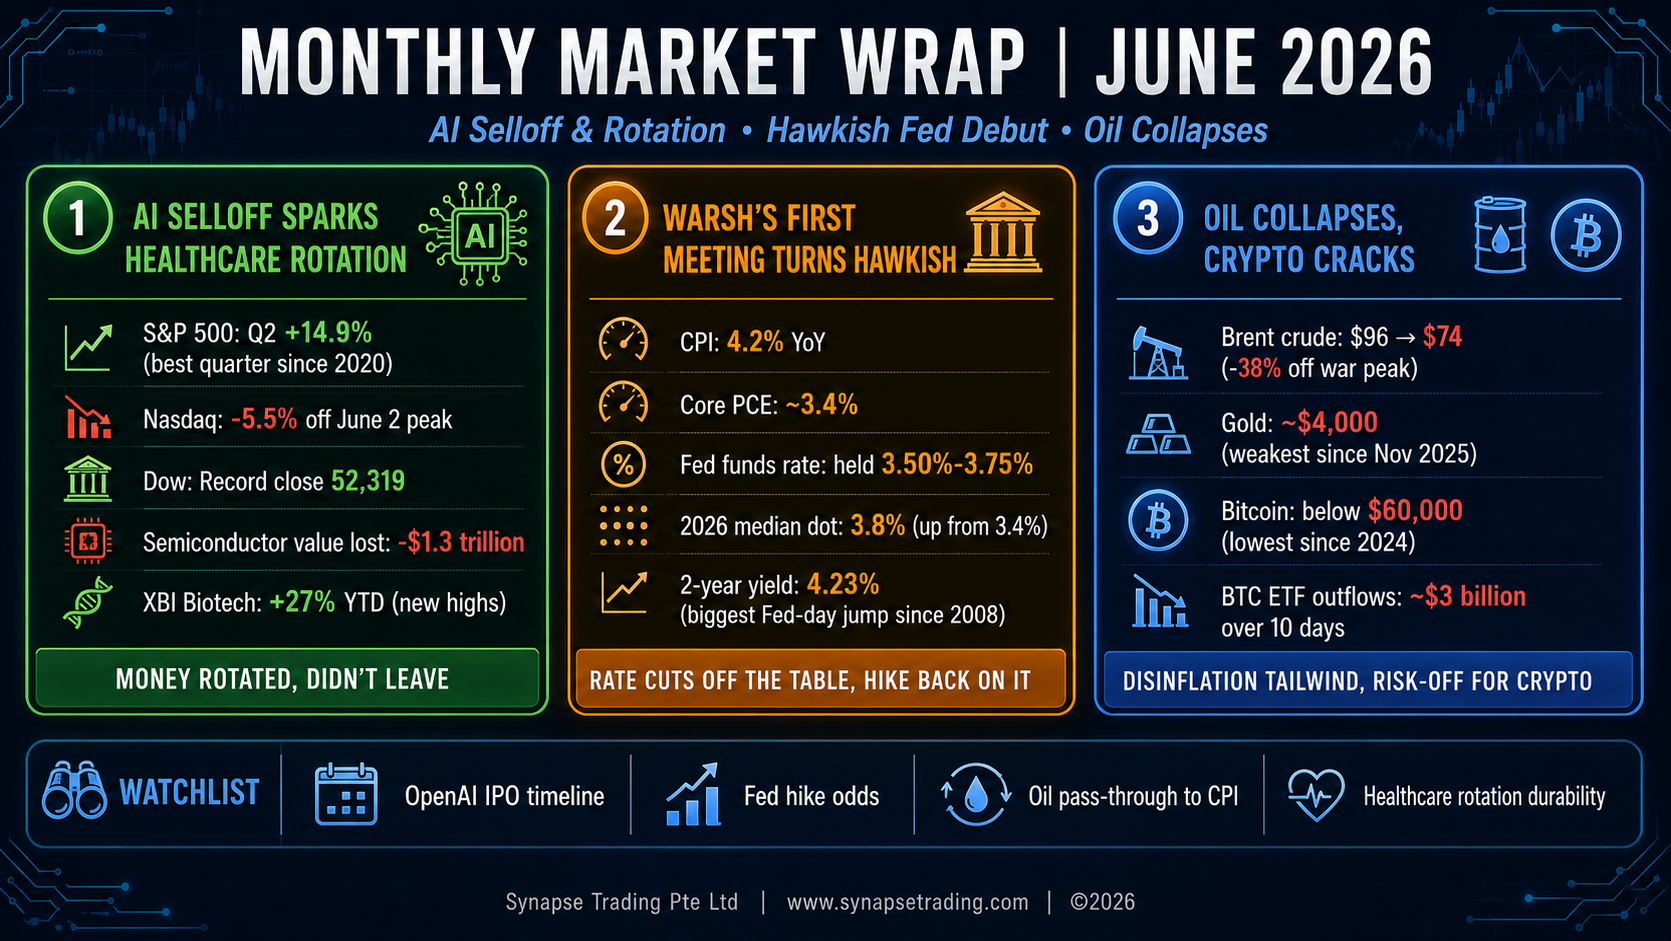
June was the month the market finally started arguing with itself. The first two days printed fresh record highs across the board, the middle of the month brought a hawkish new Fed chair and a savage AI selloff that wiped more than a trillion dollars off the chip names, and the final two sessions clawed most of it back. When the dust settled, the S&P 500 had booked its best quarter since 2020, up 14.9% for Q2, with the Nasdaq up about 21% and the Dow up roughly 13%. From a distance the tape looks calm. Up close it was anything but, and that is exactly the kind of market I find most instructive.
Table of Contents
1. Global Equity Markets: A Record, a Rout, and a Recovery
The month opened with the melt-up still fully intact. On June 2 the S&P 500 closed above 7,600 for the first time ever, finishing at 7,609.78, its 24th record high of the year, while the Nasdaq set its own record near 27,093 and the Dow added 229 points to 51,307. AI infrastructure was still the engine, helped along by a blowout from Hewlett Packard Enterprise, which jumped about 25% on earnings and raised guidance, and by Marvell, which also ran roughly 25% after Nvidia CEO Jensen Huang said it could be the next trillion dollar company. That, in hindsight, was the top.
From there the character of the market changed completely. A hawkish Fed on June 17, which I will get to below, knocked the froth off, and then the real damage came from the AI trade itself. Late in the month, reports surfaced that OpenAI was leaning toward pushing its IPO from late 2026 into 2027, partly because SpaceX stock had round-tripped back toward its $150 debut price after listing earlier in June. The market read it as the first real crack in the AI-capex story, and it did not take the news well. Over a handful of sessions, roughly $1.3 trillion in semiconductor market value evaporated and the Nasdaq fell about 5.5% off its June 2 peak. Micron dropped 13% in a single session even after posting blowout numbers. South Korea’s KOSPI was halted limit-down more than once as Samsung and SK Hynix each fell 12%, with hundreds of billions wiped in days, and SoftBank shed more than 12% in Tokyo on the OpenAI overhang.
Here is the part worth remembering. The money did not leave the market, it rotated. While the Nasdaq was getting hit, the Dow kept printing record highs on strength in healthcare, financials and industrials. Breadth stayed healthy. This was a leadership change, not a risk-off panic, and it is a distinction that matters a great deal for how you position. Confuse the two and you sell the whole book when you should only be trimming one crowded corner of it.
The new leader was healthcare and biotech. The XBI biotech ETF broke out on June 17 and ran to fresh all-time highs, up about 27% year to date, while the Nasdaq was falling. Moderna was up 43% on the year at one point and finished as one of the top names in the S&P 500. The rotation was fed by a genuine M&A wave, something like $106 billion across 201 deals so far this year, plus solid clinical data and Eli Lilly momentum. Money coming out of crowded AI names had somewhere friendlier to go, and it went there in size.
The month ended with a two-day relief rip. On June 29 the market snapped back hard, with semis up over 3%, Alphabet joining the Dow and gaining about 5% on its first day as a component, and Tesla up 8.5%. Two tail risks came off the table at once: the Supreme Court blocked President Trump from firing Fed Governor Lisa Cook, protecting the central bank’s independence, and the US and Iran agreed to halt their tit-for-tat strikes. June 30 added to it, the Dow closed at a record near 52,319, the S&P finished around 7,499, and Nvidia, AMD and Intel led the chip rebound. For the month as a whole the big indices ended roughly flat to modestly changed after that violent round trip, but the Dow set fresh records and the quarter went into the books as one of the best in years.
Overseas, the pattern rhymed. Japan’s Nikkei pushed into record territory near 72,650 mid-month before dropping more than 4% in the AI rout. Singapore’s STI set a record around 5,242 on June 23 on bank and industrial strength. China held up better than Korea, but the KOSPI was the clear epicentre of the memory-chip selloff.
Table 1: Global Index Performance — June 2026
| Index | June Return / Level | Key Milestone | Driver |
| S&P 500 | Q2 +14.9% (best quarter since 2020) | Record 7,609.78 on June 2; closed near 7,499 | AI melt-up, then Fed shock and AI selloff, then relief rally |
| Nasdaq Composite | Q2 ~+21% | -5.5% off June 2 peak during the AI selloff | Hawkish Fed; OpenAI IPO-delay fears |
| Dow Jones Industrial Average | Q2 ~+13% | Record close of 52,319 on June 30 | Rotation into healthcare, financials, industrials |
| KOSPI (South Korea) | Halted limit-down multiple times | Samsung, SK Hynix -12% | Epicentre of the memory-chip selloff |
| Nikkei 225 (Japan) | Record ~72,650 mid-month, then -4%+ | Spillover from AI rout | Regional risk-off contagion |
| STI (Singapore) | Record ~5,242 (June 23) | All-time high | Bank and industrial strength |
| XBI Biotech ETF | +27% YTD | Fresh all-time highs (June 17) | Healthcare rotation; $106B M&A wave across 201 deals |
2. Macroeconomic and Central Bank Developments
Inflation stayed hot and the Fed stayed hawkish. Those were the two facts that drove everything else.
The May CPI report, released June 10, showed headline inflation up 4.2% year over year and 0.5% for the month, with core CPI at 2.9%. Energy did most of the damage again, up 3.9% on the month for a 12-month gain of 23.5%, the lingering tax from the Iran war still working through the pipe. The Fed’s preferred gauge told the same story, with PCE running at its fastest pace in three years and core PCE sticky around 3.4%. Prices are not coming down, they are just rising a little less fast than the worst case, and the level is uncomfortably high.
The main event was the Fed meeting on June 17, Kevin Warsh’s first as chair. The committee held rates in the 3.50% to 3.75% range, which everyone expected. The shock was the dot plot. The median 2026 rate projection jumped to 3.8% from 3.4% in March, and nine of eighteen officials now pencil in at least one hike before year end. The rate-cut camp has basically vanished. Warsh himself declined to submit a dot, saying he prefers not to offer his own projections, but he left no doubt about the direction, hammering price stability and describing the committee as unanimous and unambiguous on fighting inflation. Officials lifted their 2026 inflation outlook to 3.6% headline and 3.3% core.
Markets got the message instantly. The 2-year Treasury yield jumped more than 16 basis points on the meeting day, the biggest Fed-day move since March 2008, and pushed to about 4.23%, the highest since February 2025. Think about what that means. A Fed chair appointed by a president who wants lower rates has instead delivered the most hawkish setup in years, with a real chance of a hike into year end. That tension is going to define the second half of 2026.
The labor market, for its part, kept cooling gently rather than breaking, which is the one thing keeping the soft-landing case alive. June payrolls were pulled forward to July 2 because of the holiday, so they landed just after the month closed. Elsewhere the Bank of England held at 3.75% in a 7-2 vote, and the Bank of Japan sat at a 1% policy rate, its highest since 1995.
Table 2: Key Macro and Fed Indicators — June 2026
| Indicator | Reported Value | Prior / Context | Strategic Implication |
| CPI (Headline, YoY) | +4.2% | MoM: +0.5% | Inflation running well above target |
| Core CPI (YoY) | +2.9% | Underlying pressure remains sticky | |
| Energy CPI | +3.9% MoM; +23.5% 12-month | Iran war tax still in the pipe | Primary driver of the headline beat |
| Core PCE (YoY) | ~3.4% | Headline at fastest pace in 3 years | Fed’s preferred gauge confirms the trend |
| Fed Funds Rate | Held at 3.50%–3.75% | Warsh’s first meeting as chair | No change, but tone shifted hawkish |
| 2026 Median Dot | 3.8% | Up from 3.4% in March | 9 of 18 officials now pencil in a hike |
| Fed 2026 Inflation Outlook | 3.6% headline; 3.3% core | Rate-cut expectations effectively removed | |
| 2-Year Treasury Yield | ~4.23% | +16bps on Fed day, biggest since March 2008 | Highest level since February 2025 |
3. Geopolitical and Commodity Developments
Oil was the whole story in commodities, and the story was collapse. Brent opened June near $96 a barrel with the war premium still fully priced, then fell all the way toward $74 by month end as the US and Iran de-escalated, agreed a 60-day oil waiver, and reopened the Strait of Hormuz. It was not a clean line down. Trump and Iran’s Pezeshkian signed a 14-point memorandum at Versailles on June 18, taking immediate effect, then Iran’s IRGC struck a Singapore-flagged vessel in the strait on June 25 and crude reversed higher, then over a weekend Iran declared Hormuz closed again and tanker transits briefly collapsed to single digits against a normal 93 a day before the US disputed the closure and traffic resumed. The direction was clear, though, and crude ended the quarter down roughly 38% off its war peak. That is a big disinflationary tailwind that will show up in future CPI prints, and it is the single most important offset to an otherwise hawkish macro picture.
Table 3: Commodities and FX Snapshot — June 2026
| Asset | June Level / Change | Key Driver | Outlook Consideration |
| Brent Crude Oil | ~$96 to ~$74; -38% off war peak | US-Iran de-escalation; Hormuz reopened | Disinflationary tailwind for coming CPI prints |
| Gold (Spot) | ~$4,000; weakest since Nov 2025 | Firm dollar; rising rate-hike odds | -25% off January’s $5,589 record; pressured while yields elevated |
| US Dollar (DXY) | ~101.3; 1-year high | Hawkish Fed | Further strength possible if hike odds persist |
| Japanese Yen | ~162/USD; ~40-year low | BOJ-Fed policy gap | Continued weakness risk |
4. Corporate Earnings and Stock Movers
June was a heavy earnings month, and the results skewed strong even as prices wobbled. The tell of the whole month was that even blowout numbers could not hold a bid, which is classic late-cycle behavior.
Broadcom (AVGO) kicked things off on June 3 with record Q2 revenue of $22.2 billion, up 48%, and non-GAAP EPS of $2.44 against a $2.40 consensus. AI semiconductor revenue hit $10.8 billion, up 143%, and management guided Q3 AI revenue to $16 billion and full-year fiscal 2026 AI revenue to $56 billion, roughly 180% growth. The demand is unquestionably real. The question the rest of the month kept asking was whether the price already had all of it.
Oracle (ORCL) reported on June 10 with record Q4 revenue of $19.2 billion, up 21%, record cloud revenue of $9.9 billion, up 47%, cloud infrastructure up 93%, non-GAAP EPS of $2.11, and remaining performance obligations that ballooned by $85 billion to $638 billion. And yet the stock fell about 7% after hours, because capital spending guidance jumped toward $55.7 billion and investors are finally starting to ask what the return on all that AI spend actually is. That single reaction was a preview of the entire month.
Micron (MU) was the headline number of June. On June 24 it posted record fiscal Q3 revenue of $41.5 billion and adjusted EPS of $25.11, miles above the roughly $20.60 consensus, then guided the next quarter to a jaw-dropping $50 billion on AI and high-bandwidth-memory demand, with management describing the memory market as tight beyond 2027. The stock had been up nearly 300% on the year at its peak. And in the selloff it still dropped 13% in a single session. A great business and an overheated price are two different things, and June kept teaching that lesson to anyone who would listen.
The same memory shortage cut the other way for the device makers. Apple sank 6.12%, its worst day in over a year and roughly $265 billion of market cap gone, after hiking Mac and iPad prices, and Microsoft fell 3.23% after raising Xbox prices, both blaming the AI-driven memory and storage squeeze. So the memory suppliers win and the memory consumers pay up, and for the first time the Magnificent Seven visibly fractured rather than moving as one block.
FedEx delivered a fresh read on the real economy with Q4 revenue near $24.5 billion, up 13%, and EPS of $6.31, but the stock fell as CY2026 guidance of $16.90 to $18.10 underwhelmed despite projected second-half EPS growth around 20%. Accenture was worse, cratering 13.4% after cutting its fiscal 2026 outlook, a soft tell on enterprise AI spending that fits neatly with the Oracle worry. Among smaller names, AeroVironment jumped about 30% on earnings while Concentrix fell 22% on a miss. On the deal front, Rocket Lab agreed to buy satellite operator Iridium for roughly $8 billion, about $54 a share and a 24% premium, sending Rocket Lab up 15.9% and Iridium up 25.4% in a vertically integrated challenge to SpaceX. Nike and Constellation Brands closed the month reporting on June 30, with Nike limping into its print as one of the weakest Dow components, down about 35% year to date.
The talent war was its own signal. Google lost two of its most important AI researchers in 48 hours, with Gemini co-lead Noam Shazeer leaving for OpenAI on June 17 and AlphaFold Nobel laureate John Jumper heading to Anthropic on June 19. Alphabet fell about 5% on June 22 as investors tied the departures to both AI-spend worries and retention risk. Then, in a nice bit of irony, Alphabet joined the Dow at month end and popped 5% on its first day as a member.
Table 4: Notable Earnings and Stock Movers — June 2026
| Company (Ticker) | June Result / Move | Key Metric | Notable Detail |
| Broadcom (AVGO) | Reported June 3 | Revenue $22.2B (+48% YoY) | Relentless AI demand |
| Oracle (ORCL) | Reported June 10 | Record Q4 revenue $19.2B (+21%); cloud +47% | Strong cloud acceleration |
| Micron (MU) | Reported June 24; stock -13% in a single session despite the beat | Record revenue $41.5B; EPS $25.11; Q4 guide ~$50B | Up ~300% YTD at peak before AI selloff swept it up |
| AeroVironment (AVAV) | +~30% on earnings | Strong beat | |
| Concentrix (CNXC) | -22% | Earnings miss | |
| Rocket Lab (RKLB) | Agreed to buy Iridium | ~$8B deal | M&A expansion |
5. Commodities, Bonds, and Other Assets
Gold, oddly, did not benefit from any of the fear. It slid to around $4,000, its weakest since November 2025, and even cracked below $4,000 for the first time on June 24 with a 2.9% drop, while silver fell 4.6% on the same day and both Goldman and Deutsche Bank cut their targets. The metal now sits about 25% below its late-January record of $5,589. With war-driven fear draining, a firm dollar and rising rate-hike odds did the damage, a reminder that gold hates real yields more than it loves a crisis.
Bonds and the dollar told the hawkish story cleanly. Beyond the 2-year’s jump to about 4.23%, the 10-year yield peaked near 4.49% before easing back toward 4.40% late in the month as oil fell and growth worries crept in. Markets ended June pricing roughly an 80% chance of a December hike and about 63% for September. The dollar index climbed to a one-year high near 101.3, and the Japanese yen sank to roughly a 40-year low near 162. For bond investors, duration stayed the enemy, and the combination of sticky inflation and a hawkish repricing keeps me cautious on long-dated paper until the rate picture clears. On oil, Goldman trimmed its Q4 Brent forecast to $80 from $90 on the assumption that supply eventually normalizes.
6. Digital Assets: Crypto Gets Hit First
Bitcoin and Ethereum had an ugly month. Bitcoin started June around $66,000 and slid below $60,000 by the 25th, its lowest level since 2024, threatening its first weekly close below the 200-week moving average since October 2023, a line that tends to mark the boundary between a healthy correction and something worse. Ethereum fell in step, trading down toward the $1,560 area. The crypto Fear and Greed Index sank into extreme fear, bottoming somewhere in the teens. The drivers were the same ones hitting everything else, a hawkish Fed and vanishing rate cuts, plus heavy spot Bitcoin ETF outflows of roughly $3 billion over ten straight trading days and rumors of large-holder selling. Early in the month a broader crypto wipeout erased around $2 trillion in market value. When rates are pushing up and risk appetite is draining, the highest-beta assets always pay first, and in June they did.
Table 5: Digital Asset Performance — June 2026
| Asset | June High | End of Month Level | Key Observation |
| Bitcoin (BTC) | ~$66,000 (start of month) | Below $60,000 (June 25); lowest since 2024 | Threatened first weekly close below 200-week MA since Oct 2023 |
| Ethereum (ETH) | ~$1,560 | Fell in step with Bitcoin |
7. Summary and Outlook for July 2026
June was a round trip that ended better than it looked in the middle. Stocks set records in the first two days, then the AI-capex trade cracked when OpenAI signalled an IPO delay, dragging the semiconductors down more than a trillion dollars and briefly freezing the Korean market. But the money rotated into healthcare, biotech and industrials rather than leaving, breadth held up, and a two-day quarter-end rally left the Dow at a record and the S&P near its highs. Q2 finished as the best quarter since 2020.
The bigger picture is a genuine regime tension. Inflation is still running above 4% headline, oil has collapsed which helps going forward, and a hawkish new Fed under Kevin Warsh has taken rate cuts off the table and put a hike back on it. That combination is why the 2-year yield is at multi-year highs, why gold and crypto both got hit despite all the noise, and why leadership quietly shifted from the crowded AI trade to healthcare and value. The AI story is not over, but June was the first month it had to prove itself rather than just being assumed.
In terms of positioning, the approach that has worked all year still applies with one adjustment. Ride the existing winners with disciplined stops rather than chasing them, look for entries on pullbacks instead of breakouts at these levels, and keep the healthcare and biotech rotation firmly on the radar because that is where the fresh leadership is. Stay short duration in bonds until the Warsh Fed shows its full hand, treat gold as a core hedge but expect chop while real yields climb, and stay patient on crypto until it can hold a level rather than break one. Personally, I would rather trade a market that argues with itself than one that only knows how to go up. The arguing is where the opportunities live.
If you want to keep pace with these moves as they happen, rather than reading about them a month later, that is exactly what we do together inside the community. Come join us.
 Our flagship mentoring program is suitable for both beginners and advanced traders, covering the 4 strategies which I used over the past 15 years to build up my 7-figure personal trading portfolio.
 If you're looking for the best trading opportunities every day across various markets, and don't want to spend hours doing the research yourself, check out our private Telegram channel!

Leave a Reply
Want to join the discussion?Feel free to contribute!