• Link to Facebook
  • Link to X
  • Link to Instagram
  • Link to Youtube
  • Link to LinkedIn
  • Link to Mail
Synapse Trading
  • Home
  • About
    • My Background
    • My Trading Journey
    • My Travel Log
    • Media & Interviews
  • Mentoring
    • Trading Mastery Program
    • Results & Testimonials
  • Signals
    • Telegram (Free to join!)
    • Daily Trading Signals
    • Daily Trading Signals (Results)
  • Resources
    • Free Trading Guides
    • Tools & Resources
    • Blog & Infographics
  • Contact
    • Contact Us
    • Partnership Opportunities
  • Click to open the search input field Click to open the search input field Search
  • Menu Menu

Tag Archive for: reversal price patterns

Spencer Li

Expanding Triangle Pattern Trading Strategy Guide (Updated 2025)

Technical Analysis & Price Action
Thumbnail Expanding Triangle Price Pattern Strategy Guide

Have you faced a market where there are large price swings and high volatility? How do you profit from such markets?

The expanding triangle pattern is one such example, where buyers and sellers fight for control, until one side capitulates and the other side takes control of the market.

While this fight is going on, there are several ways to take advantage and profit from these large price movements, either by trading the swing themselves, or waiting till a clear direction is established before taking a position.

In this post, I will show you how to take advantage of the expanding triangle pattern to trade ranges, breakouts, and reversals, by using the best trading strategies for this price pattern.
 

expanding triangle INFOGRAPHIC confirmed

What is an Expanding Triangle?

The expanding triangle, as its name suggests, is a triangle, but it differs from the other 3 types of triangle patterns which we covered in the previous chapter.

All triangle patterns consist of 2 lines, but in the previous 3 triangles (symmetrical, ascending, descending), the lines were converging, whereas for the expanding triangle, the lines are diverging.

This means that instead of compressing prices into a fixed breakout point some time within the pattern, this pattern sees prices moving further and further away from each line in the pattern.

This ultimately leads to wider swings (higher highs and lower lows) and increased volatility, making it harder to predict when a breakout will happen. Also, since it neither exhibits higher highs and higher lows (uptrend) nor lower highs and lower lows (downtrend), this makes it hard to pinpoint the current trend.

Historically, it also has many names associated with the same pattern:

  • Expanding triangle
  • Broadening triangle
  • Megaphone formation
  • Broadening formation

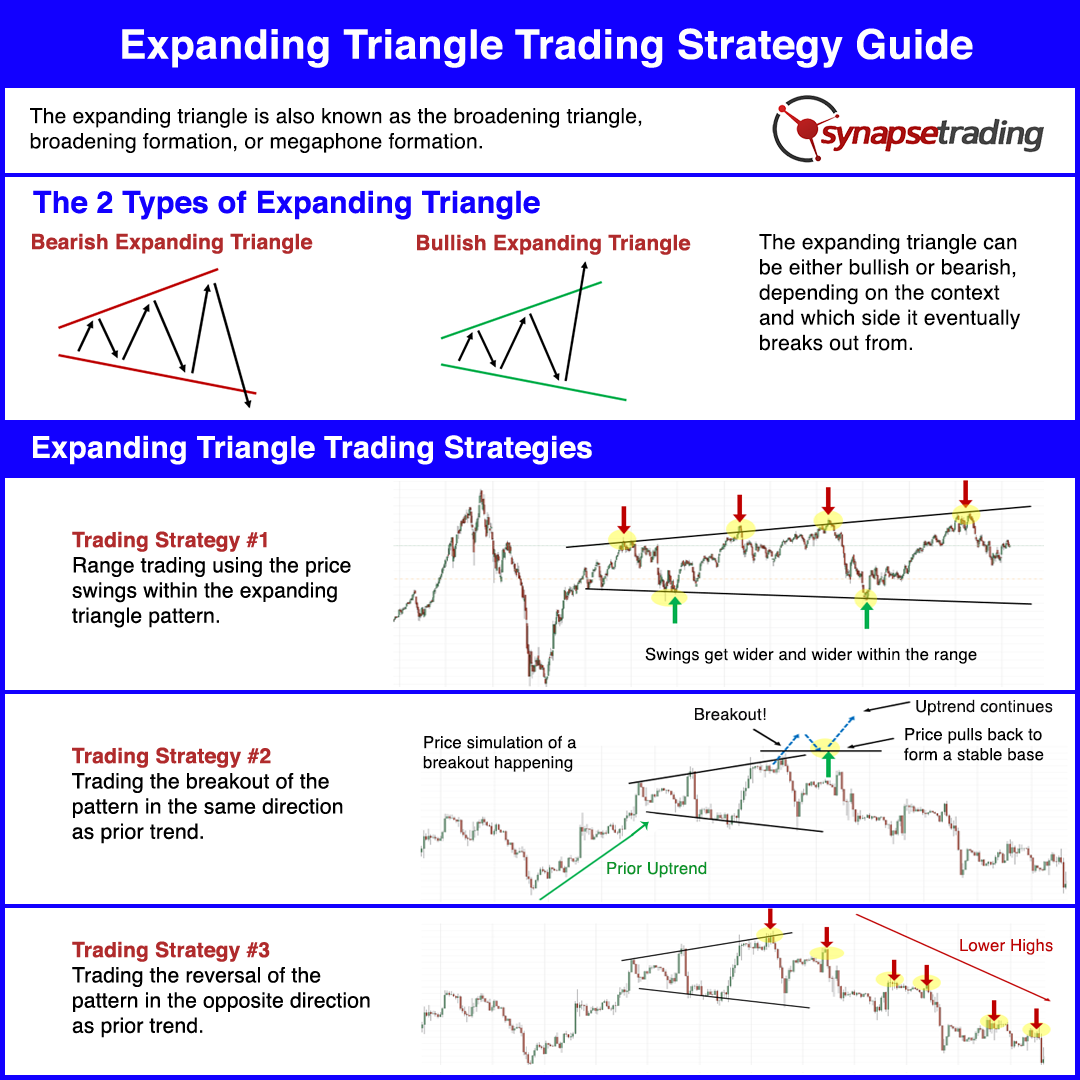
The expanding triangle can be either bullish or bearish, giving rise to the bullish expanding triangle or the bearish expanding triangle.

For stock markets, the bearish version seems to be more common, since market bottoms tend to be faster (due to the faster decrease of prices during the crash), so we tend to see it more during market tops.


Expanding Triangle Psychology

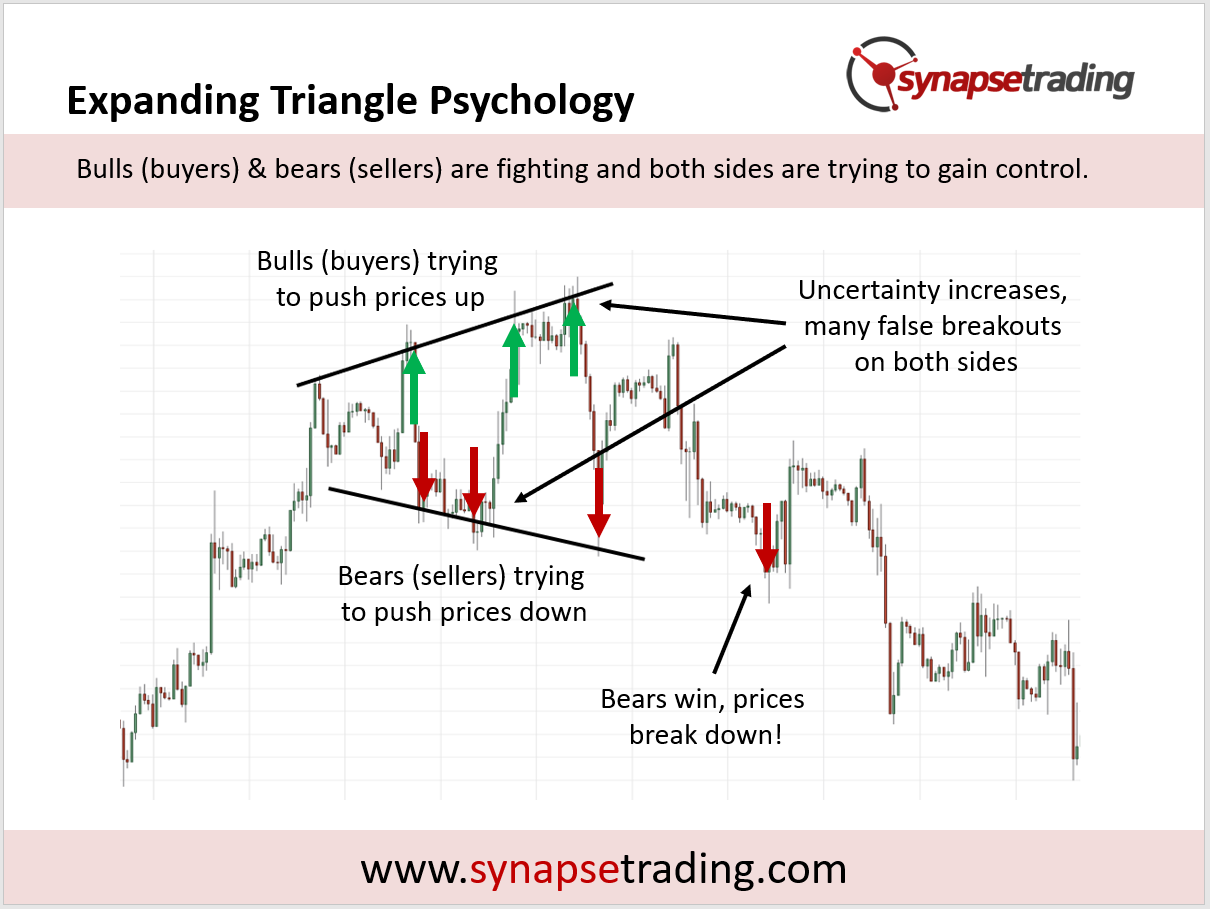
When you see the expanding triangle and its widening swings, it is a clear sign of uncertainty in the market.

Bulls and bears are fighting to gain control, but it is not clear which side is winning because each time price makes a new high or low, it appears that either side is winning, only to see the other side gain back control.
expanding triangle psychology

This makes it hard for market players to fully commit until there is more clarity.

The reason why this is classified as a reversal pattern is because the larger and larger swings point to increasing uncertainty, and the higher the uncertainty, the more chance that the prior trend will reverse.


Expanding Triangle Trading Strategies

There are 3 main strategies, of which the first exploits the wide swings to attempt range trading, while the other two attempt to trade the breakout of prices.

  1. Range trading (using the swings)
  2. Breakout (with trend)
  3. Reversal (change of trend)

Since this pattern is inherently uncertain (and hence risky), good risk management and precision of entry is important to get a good entry price, because the chance of getting stopped out is high if your entry is less than ideal.

Now, let’s go through each strategy in greater detail.


Expanding Triangle Trading Strategy #1

Our first strategy for the expanding triangle pattern is make use of the wide swings between the range of the triangle pattern, and aim to take positions near the extremes of the swings.

This is very similar to range trading, or a rectangle pattern, where we go long near support levels and go short near resistance levels, except that this time the support and resistance levels are diverging lines instead of horizontal lines.

In the example above, we see that prices bounce off the lines on both sides, and I have highlighted the potential buying and selling opportunities with green and red arrows respectively.

For trading, we would look to enter near the lines of the expanding triangle, while using a wider stoploss, since this pattern is know for its high volatility. 

As the lines diverge and the swings get wider, the reward to risk for each trade actually becomes better, because the risk remains the same (based on your entry technique), but the reward increases as the target moves further away.

Do note, however, that eventually the pattern will lead to a breakout, so remember to manage your trading position as prices move within the expanding triangle.


Expanding Triangle Trading Strategy #2

In the first strategy, we treated the expanding triangle as a trading range, and traded the price movements within the range.

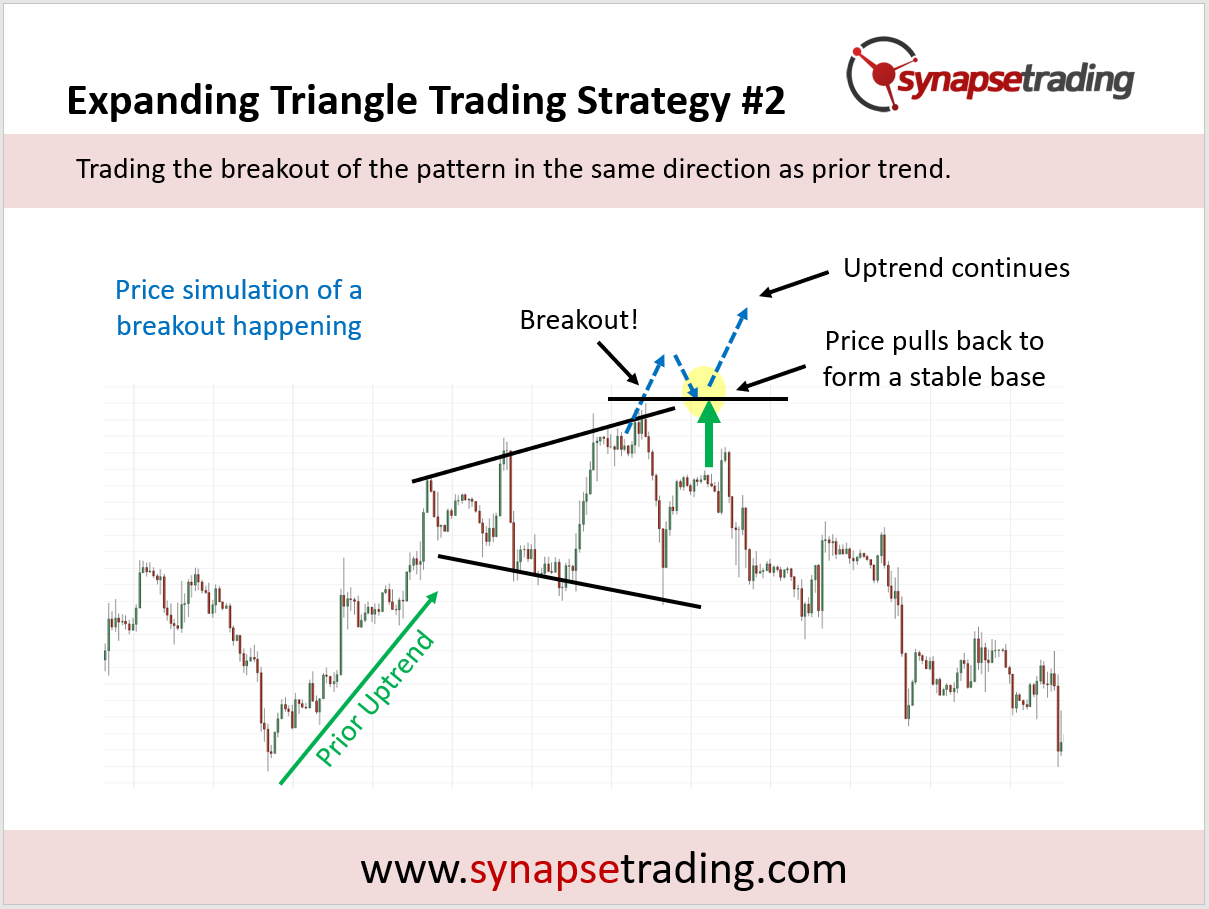
The second strategy we are going for is to treat the expanding triangle as a continuation pattern, and look for a breakout in the same direction as the prior trend.
Personally, I do not like this strategy, as I feel that the odds are not as good, and it is hard to find many instances of a successful breakout. The probability of a reversal is higher due to uncertainty of the pattern.

As such, I was unable to find a good chart example, and I have simulated a price breakout instead.

In the example above, we see a prior uptrend, followed by the expanding triangle, then we see prices break out (simulated prices in blue dotted lines).

The breakout is inherently challenging because prices are trying to break above a line which is sloping upwards, which means prices need to move up a lot in a short period of time. If the breakout is too gradual, it will appear to just be moving along the edge of the line, making it hard to tell whether a real breakout has taken place.

The best breakdown will be one in which prices shoot past the line, then pulls back to form a stable base.

For trading, we would look to enter near the stable base once it has been established, to act as a launchpad for the next leg of movement upwards.

Note that this strategy works just as well in a downtrend, you’ll just have to flip the pattern around for a downside breakout.

This strategy works best if the prior trend (before forming the triangle pattern) is strong, and has a higher chance of success if the triangle is smaller, in terms of height and duration.


Expanding Triangle Trading Strategy #3

In our final strategy, instead of looking for a breakout in the prior trend direction (strategy #2), we now look for a breakout in the opposite direction, in other words a trend reversal.

To be more specific, we are not looking for a breakout per se, but rather an opportunity to initiate a position in the opposite direction of the prevailing trend.

This means that instead of a breakout, we can look for a low-risk entry point for our first entry. Recall the technique we used in strategy #1 for trading the range, and entering near the extreme swing.

In the example above, which features the same chart as strategy #2, instead of looking for an upside breakout, we will be looking for a reversal trade opportunity.

For trading, we can initiate a low-risk short position near the upper bound of the range, indicated by the yellow highlight and red arrow. As prices start to form lower highs and lower lows (thus confirming the downtrend), we can choose to add short positions.

Note that this strategy works just as well in a bullish trend reversal, you’ll just have to flip the pattern around for an upside reversal.

This strategy works best if the prior trend (before forming the triangle pattern) is weak and in a relatively late stage, and has a higher chance of success if the triangle is larger, in terms of height and duration.


Profit Target for Expanding Triangle

Once an expanding triangle pattern is completed, one of the most useful things about it is its ability to provide a price projection, which can be used to estimate a minimum profit target for your trade.

This can be done by taking the maximum height of the triangle, and projecting that distance from the breakout point.

expanding triangle profit target

In the chart above, the maximum height of the expanding triangle is indicated by the blue rectangular box, which is then used as a price projection at the breakout point.

The black horizontal arrow indicates the price level which serves as the minimum profit target for the expanding triangle pattern breakout.

This price projection technique can be used in conjunction with other methods, such as support and resistance levels, and if there is any confluence, gives an added layer of confirmation.


Tips from the Trading Desk

  1. With much uncertainty surround this pattern, it is better to look for low risk entries to enter early into the trend reversal, rather than look for breakouts to continue the existing trend
  2. Look to fade both sides (trade within the range) if there are extreme moves
  3. Avoid trading when price is in the middle of the range

avoid middle expanding triangle

When prices are in the middle of the expanding triangle, there is no edge because the odds of going up or down are about 50-50.

And as you can see in the yellow circles, when prices are in the middle, they can “look” like they are breaking out in one direction, and make a 180 U-turn just a few bars later.

This means that if you try to trade these breakouts in the middle of the range, you will get whipsawed terribly.

Hence, it is better to avoid taking a position when prices are in the middle of the pattern, and instead wait till there is a good setup.


Now that I have shared the various trading strategies for the expanding triangle price pattern, which is your favourite strategy?

Let me know in the comments below.


thumbnail the definitive guide to trading price chart patterns

If you would like to learn all the different price chart patterns, also check out: “The Definitive Guide to Trading Price Chart Patterns”

2 Comments/by Spencer Li
https://synapsetrading.com/wp-content/uploads/2022/07/Thumbnail-Expanding-Triangle-Price-Pattern-Strategy-Guide.png 720 1280 Spencer Li https://synapsetrading.com/wp-content/uploads/2019/10/logo.jpg Spencer Li2022-07-18 15:26:042025-01-09 10:10:23Expanding Triangle Pattern Trading Strategy Guide (Updated 2025)
Spencer Li

Cup and Handle Pattern Trading Strategy Guide (Updated 2025)

Technical Analysis & Price Action
cup and handle pattern trading strategy

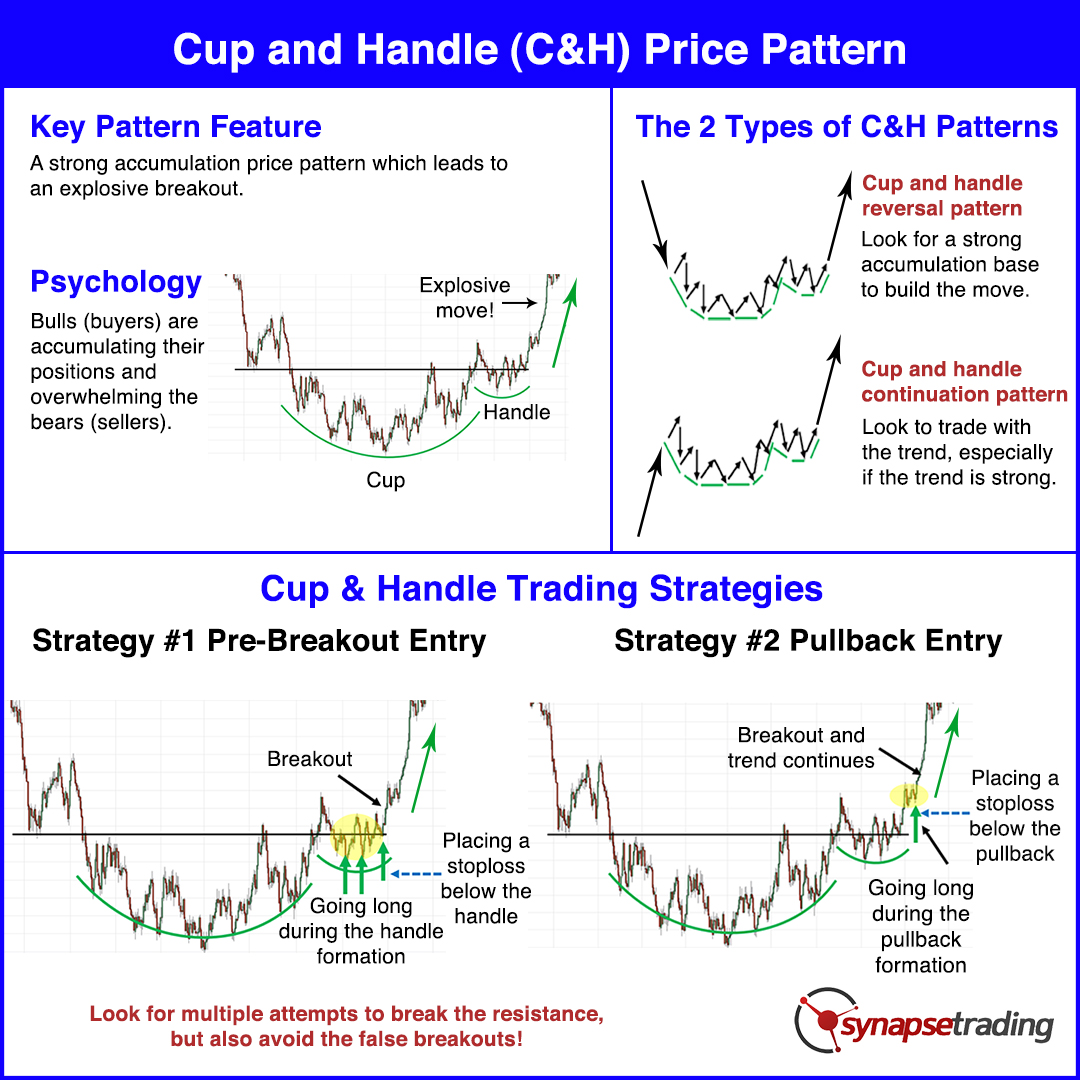
The cup and handle is an accumulation buying pattern, which is found during long periods of consolidation, and can lead to powerful explosive moves once the pattern is fully completed.

There are 2 main varieties of this pattern – the cup and handle reversal pattern, and the cup and handle continuation pattern.

In this post, I will show you how to take advantage of the cup and handle pattern to trade breakouts, how to avoid false breakouts, and the best trading strategies for this price pattern.


Cup and Handle Pattern Trading Strategy Guide


What is a Cup and Handle Price Pattern?

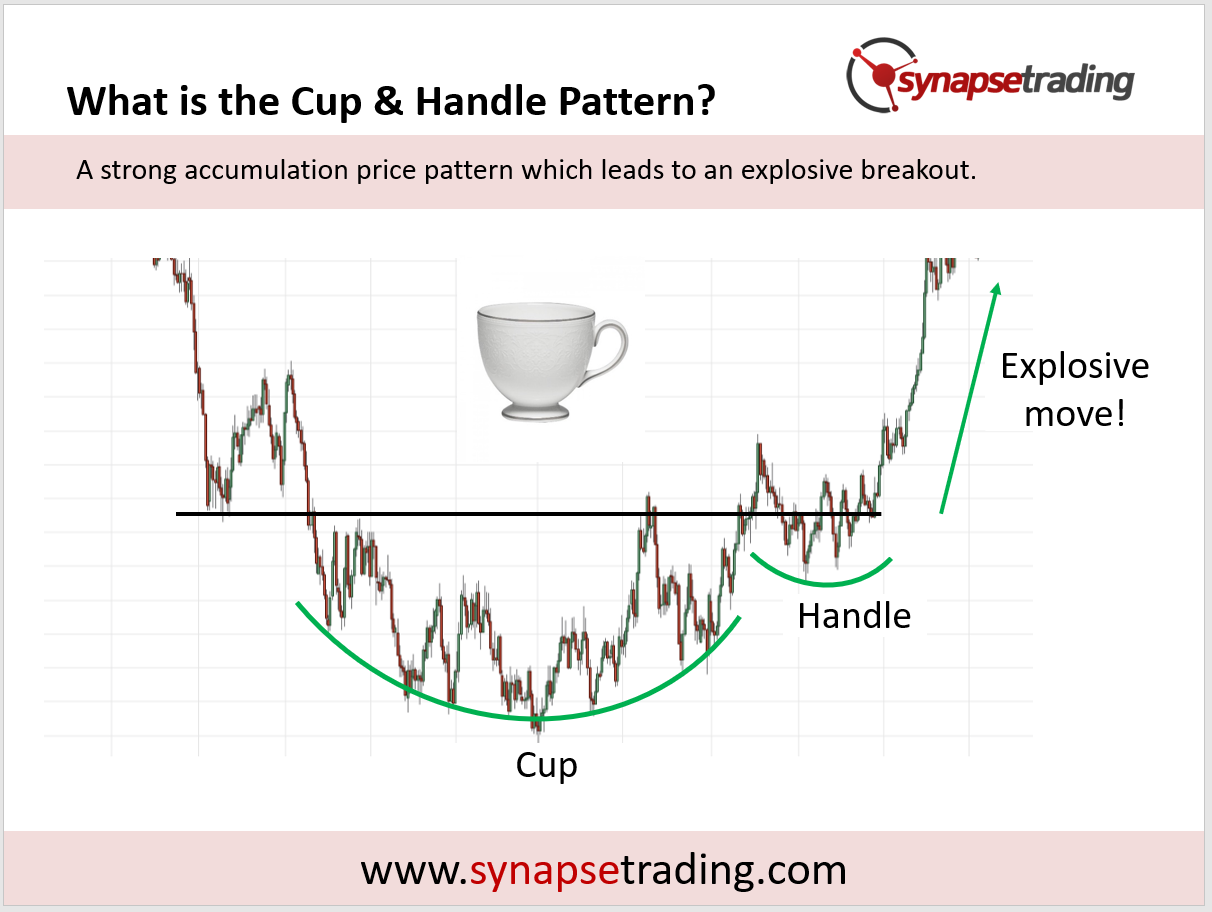
The cup and handle is an accumulation buying pattern, which is found during long periods of consolidation, and can lead to powerful explosive moves once the pattern is fully completed.

In the diagram below, you can see that the price pattern consists of a larger accumulation base (the cup), before forming a smaller accumulation base (the handle), before finally leading to a breakout.

What is a Cup and Handle Price Pattern

From a practical viewpoint, we will usually start to notice the pattern only when it starts forming the “cup” part of the pattern, which is quite identifiable by the smooth gradual curve upwards of trending swing counts of higher highs and higher lows on the chart.

The confirmation will come from the “handle” part of the price pattern, which is like a small pullback before the price explodes upwards. You can think of it as pushing down on a loaded spring, to build up more pressure just before the release.


The 2 Types of Cup and Handle Patterns

Unlike other chart patterns, the cup and handle pattern does not work equally for both the bullish and bearish scenario, as it is almost exclusively found in the bullish scenario only. Hence, we don’t hear people talking about “bullish cup and handle” or “bearish cup and handle”, because when they say “cup and handle”, it is understood to refer to the bullish version.

Based on the 2 main categories of chart patterns (continuation vs reversal), most people tend to classify the cup and handle pattern under the “Reversal Patterns” category, however I feel that the cup and handle can be both a reversal or continuation pattern.

In the diagram below, I illustrate the 2 different types of cup and handle patterns.

The 2 Types of Cup and Handle Patterns

a) Cup and Handle Reversal Pattern

In the reversal cup and handle, prices start off in a prolonged downtrend, where they gradually lose momentum and become more sideways. Prices start to bottom out and form a reversal base, before leading to a change in direction.

b) Cup and Handle Continuation Pattern

In the continuation cup and handle, prices are on an existing uptrend, and when the trend loses some steam or takes a pause, prices start to move sideways. The cup and handle pattern helps to buy up more buying pressure, before prices break to new highs and resume the uptrend.

In both scenarios, the context is very different, but the pattern is the same, and can be traded in exactly the same way.


Cup and Handle Pattern Psychology

In the cup and handle pattern, as the downtrend starts to weaken (less bears/sellers), the bulls/buyers start trying to take control from the bears, by gradually accumulating long positions.

Cup and Handle Pattern Psychology

As they build up their positions, we start to see a wide U-shape bottom (the cup), where bulls and bears are almost balanced. This suggests that the bears are no longer in control, and the downtrend has been neutralized.

In the final stage, where the handle forms, this is where the final battle of the bulls and bears take place.

By this time, the bulls have the upper hand as they have been accumulating positions during the cup formation, which in turn attracts more buyers.

Once the last bears are killed, bulls take full control, and the explosive price breakout takes place.


Cup and Handle Pattern Trading Strategies

There are 2 main strategies, which focus on the final battle between the bull and bears, because that is usually the tipping point where large explosive moves happen once the bears give up and get overwhelmed by the bulls.

  1. Pre-Breakout Entry: Enter before the breakout
  2. Pullback Entry: Wait for a pullback after the breakout

Cup and Handle Pattern Trading Strategies

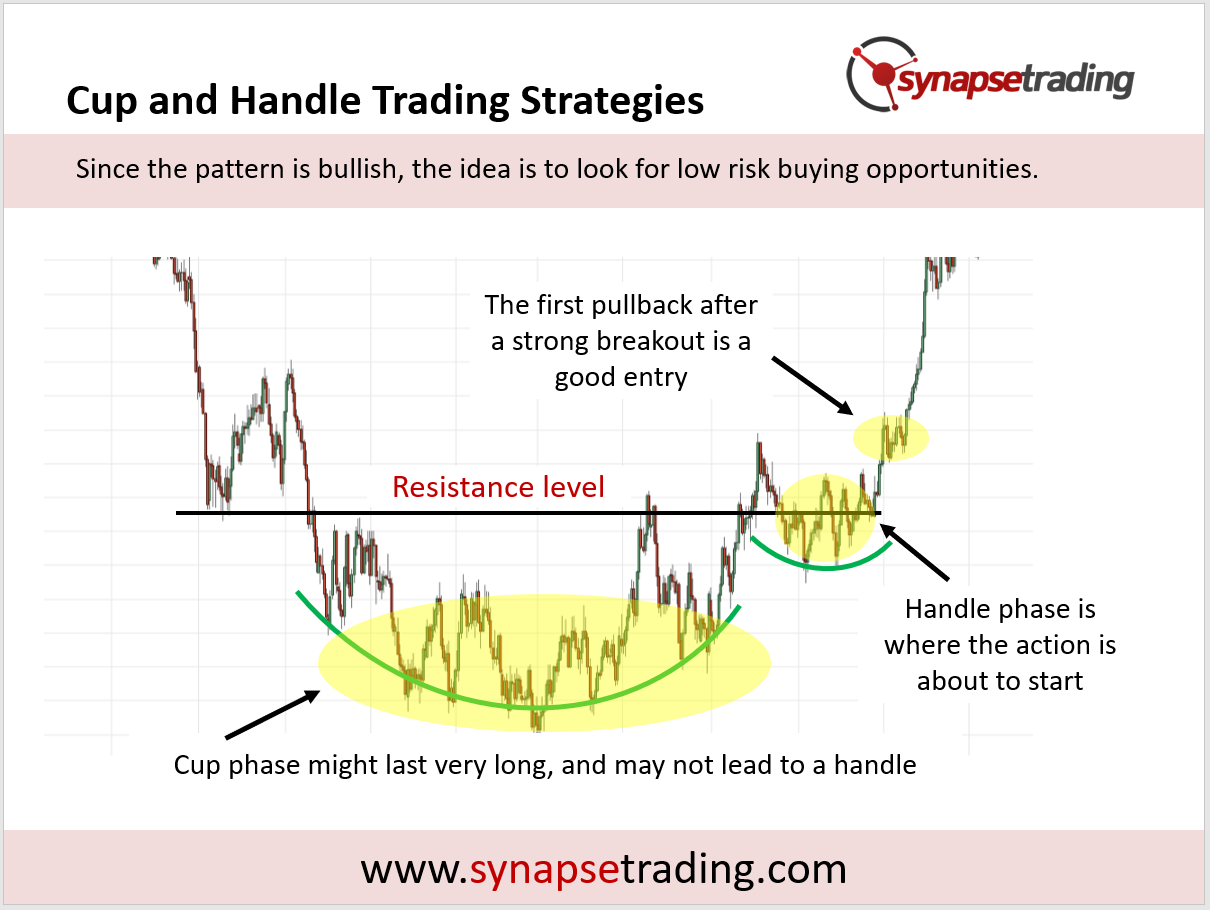
Since the cup and handle is inherently a bullish pattern, the basic idea is to look for low risk buying opportunities to enter.

Looking at the diagram above, you might think that the best place to enter a trade is during the cup phase, because you can get the best entry price.

However, during the cup phase, the odds are 50-50, and there is no real edge, because the market is still sideways at that point of time.

In addition, the cup phase might last a really long time, and may not lead to a handle.

Hence, it makes more sense to make good use of your trading capital, and only enter the trade as the action is about to start.

The first opportunity would be to enter during the handle phase before the breakout, but if you miss that, they next best chance is to enter on the first pullback after the breakout.

Now, let’s go through each strategy in greater detail.


Trading Strategy #1: Pre-Breakout Entry

Our first strategy for the cup and handle price pattern is to enter just before the completion of the pattern, during the handle formation.

Cup and Handle Pattern Trading Strategies 1

During the cup formation, buyers would have been accumulating long positions and building bullish pressure, with the occasional test of the resistance level by trying to break out.

As the handle forms, it is very close to the breakout happening, and this provides a good low-risk opportunity to enter the trade just before the action begins.

Once the breakout happens, the price and volume is expected to surge, which would make it more challenging to enter a position, hence it is recommend to take a position before that.

For trading, we would look to enter during the handle formation, which would be very close to the resistance level.

We can then place a stoploss below the handle, and since the handle is usually pretty small relative to the pattern, the risk will not be very high.


Trading Strategy #2: Pullback Entry

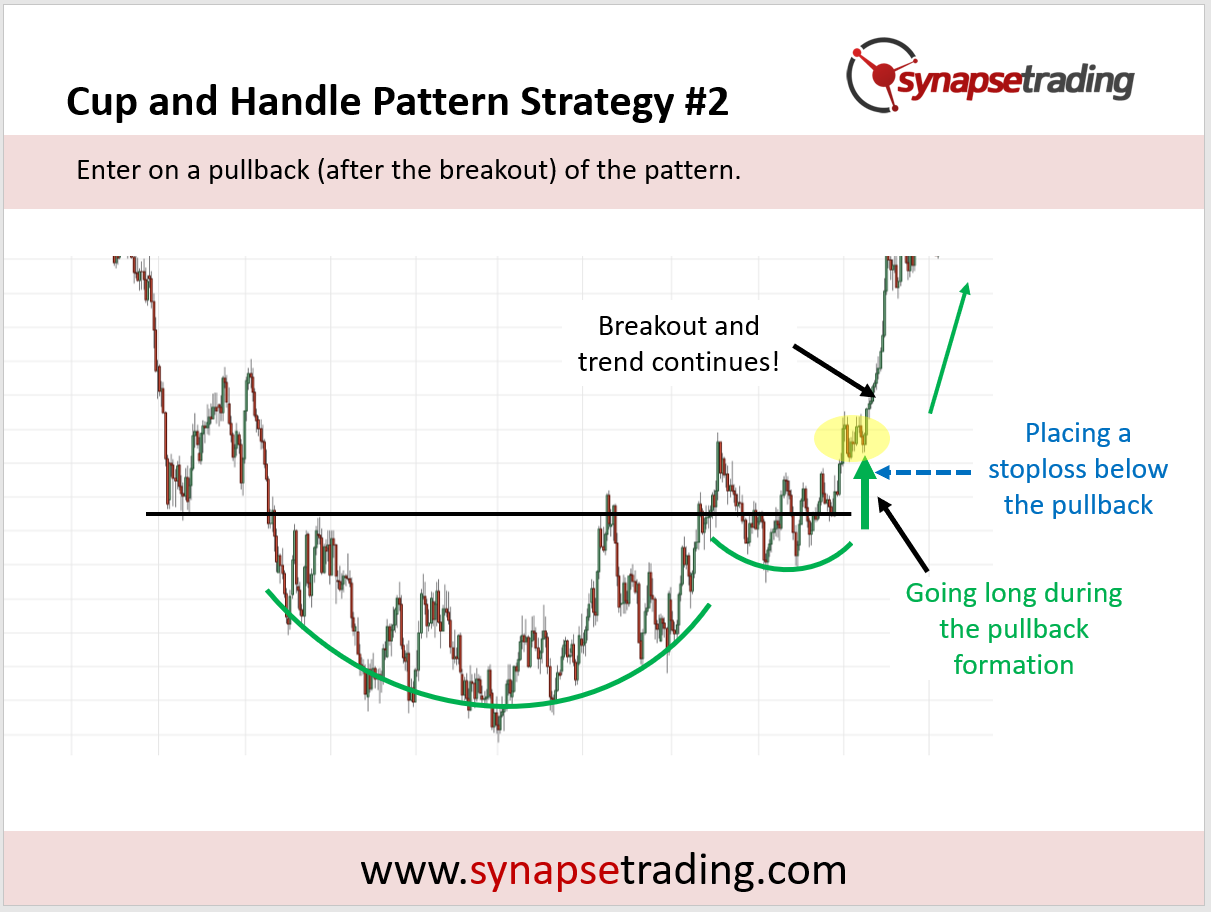
Our next strategy for the cup and handle pattern is to enter on the first pullback after the initial breakout.

Cup and Handle Pattern Trading Strategies 2

As covered in the previous setup, one of the ways to trade the cup and handle pattern is to enter just before the price breaks out of pattern.

However, sometimes the breakout might be too fast, or you might have missed the breakout opportunity.

After such a long build-up (the cup and also the handle), it is very likely that any resulting move up would have more than 1 leg, so the first pullback/pause is a good place to enter because there is a high chance of a 2nd leg after the trend resumes.

In the example above, we see prices surge after the initial breakout, followed by a small pause which looks like a bull flag, before prices continue to surge again after breaking out from the flag pattern.

That small pause (in this case the bull flag) gives us a good low risk opportunity to get into the trade to ride the next wave of uptrend. Do note that the pause may not always be a flag, sometimes it might take other forms, but the idea is the same.

For trading, we would look to enter during the pause (formation of the small flag), when the risk and volatility is low.  The bottom of the pullback pattern would be a good place to put your stoploss.

If you have already taken a position using Strategy #1 on the pre-breakout, you can also use Strategy #2 to add more positions on the first pullback.


Profit Target for the Cup and Handle Pattern

Once the cup and handle pattern is identified, you can use the completed pattern to do a price projection, which can serve as a good estimate for a target profit for your trade.

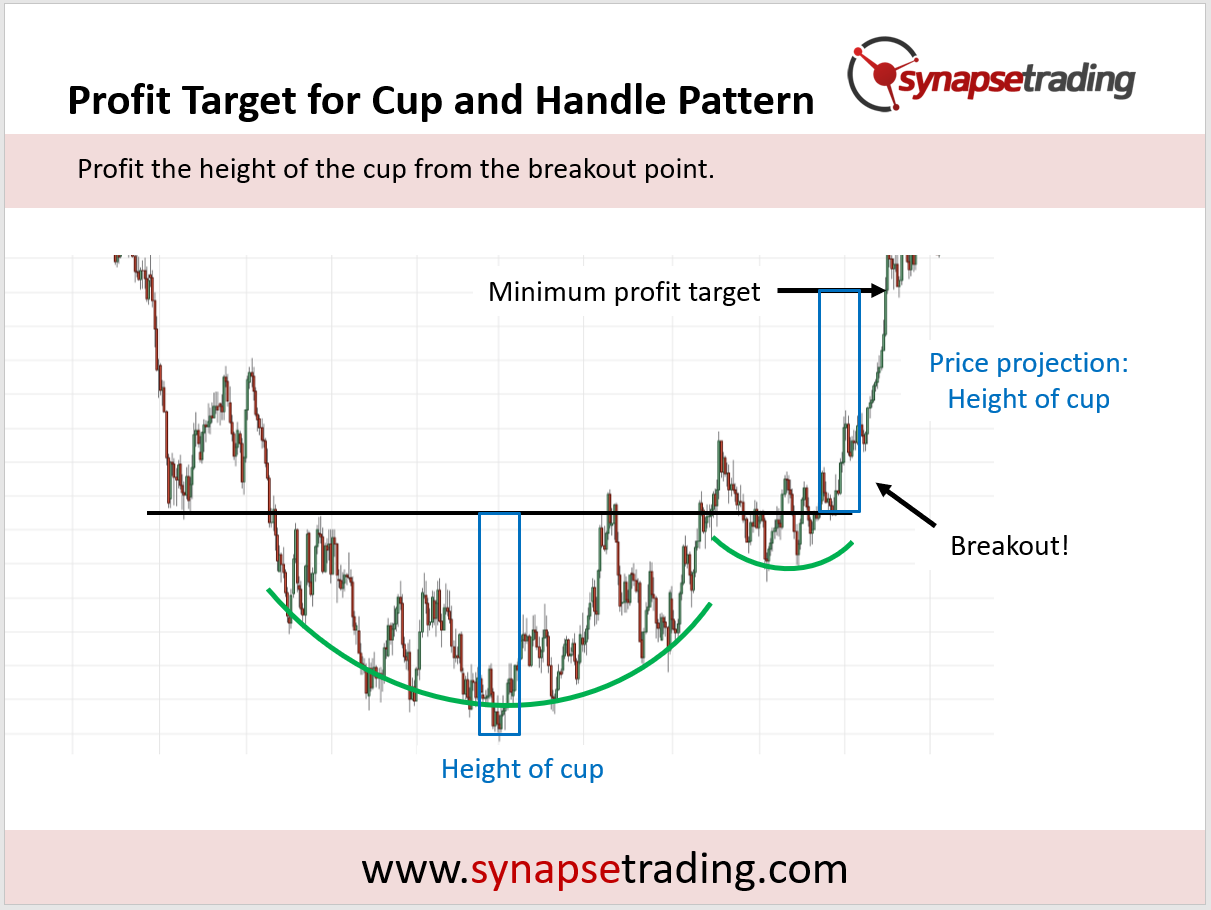
To measure the target price, take the maximum height of the cup, and project that distance from the breakout point.

Profit Target for the Cup and Handle Pattern

In the chart above, the maximum height of the cup is indicated by the blue rectangular box, which is then used as a price projection at the breakout point.

The black horizontal arrow indicates the price level which serves as the minimum profit target for the cup and handle pattern breakout.

To get an added layer of confirmation, you can look for confluence with with tools and methods, such as support and resistance levels.


Tips from the Trading Desk

  1. For cup and handle continuation, look to trade with the trend, especially if the trend is strong.
  2. For cup and handle reversal, look for a strong accumulation base to build the move.
  3. Look for multiple attempts to break the resistance, but also avoid the false breakouts!

Tips from the Trading Desk

As you can see from the chart above, a key component of the cup and handle pattern lies in the resistance level, because in a sense the whole build-up during the cup and the battle during the handle is an attempt to break though this level.

Hence during the build-up phase, we should look out for attempts to break the resistance levels, and it is expected that the first few attempts will fail, so do not try to trade those breakouts.

These “false breakout” attempts are more to probe for weaknesses, and the chances of a successful breakout at this point of time is low because there is insufficient build-up, which usually takes the form of the handle.

Hence, it is more prudent to only enter this setup during the handle formation, especially if previous attempts have been made to break the resistance.

Now that I have shared the various trading strategies for the cup and handle price pattern, which is your favourite strategy?

Let me know in the comments below.


thumbnail the definitive guide to trading price chart patterns

If you would like to learn all the different price chart patterns, also check out: “The Definitive Guide to Trading Price Chart Patterns”
22 Comments/by Spencer Li
https://synapsetrading.com/wp-content/uploads/2021/01/cup-and-handle-pattern-trading-strategy.png 720 1280 Spencer Li https://synapsetrading.com/wp-content/uploads/2019/10/logo.jpg Spencer Li2021-01-06 00:52:512025-01-09 13:14:06Cup and Handle Pattern Trading Strategy Guide (Updated 2025)

Free Trading Guides

Free Trading Guides

Blog Categories

  • Beginner's Guide
  • Blockchain & Crypto
  • Book Summaries
  • Economics & News Trading
  • Investing & Portfolio Management
  • Living Your Best Life
  • Market Analysis
  • Markets & Products
  • News & Events
  • Promotions
  • Risk & Money Management
  • Stock Trading
  • Technical Analysis & Price Action
  • Testimonials
  • Tools & Resources
  • Trading Psychology
  • Trading Strategies
  • Trading Tips
  • Travel & Lifestyle

Free Trading Guides

Free Trading Guides

Contact Us

Synapse Trading Pte Ltd
Registration No. 201316168H

Whatsapp: +65-8897-1204
Telegram: @iamrecneps
Email: info@synapsetrading.com

Links

Disclaimer
Privacy policy
Terms & Conditions
Contact us
Partnerships

© 2012-2024 Synapse Trading | All rights reserved | - powered by Enfold WordPress Theme
  • Link to Facebook
  • Link to X
  • Link to Instagram
  • Link to Youtube
  • Link to LinkedIn
  • Link to Mail
Scroll to top Scroll to top Scroll to top