
Bullish Three Line Break
Definition
A bullish three line break structure is comprised of four Japanese candlesticks.
The first three candlesticks are bullish (green) and small.
The opening occurs at the closing price of the previous candlestick, and the closing occurs at the highest point of the candlestick.
The fourth candlestick is large, bearish (red), and encompasses the three bullish candlesticks.
It must close below the opening level of the first one.
Characteristic
A bullish three line break structure often forms after a significant rise characterized by several large green Japanese candlesticks.
Significance
Contrary to what one might think, this does not signal a reversal of the trend.
A bullish three line break is a continuation pattern; it indicates continuation of the bullish movement.
It is the sign of significant profit-taking that allows the increase to start again on a good basis.
Note
It is important that the three bullish candlesticks close at their high point.
Invalidation
If the closing of the last candlestick does not occur below the opening level of the first candlestick, or if the closing does not occur at the low point, then the bullish three line break structure is invalidated.
Bearish Three Line Break
Definition
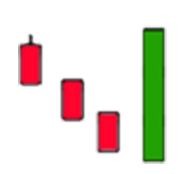
A bearish three line break structure is comprised of four Japanese candlesticks.
The first three candlesticks are bearish (red) and small.
The opening occurs at the closing price of the previous candlestick, and the closing occurs at the lowest point of the candlestick.
The fourth candlestick is large, bullish (green), and encompasses the three bearish candlesticks.
It must close below the opening level of the first one.
Characteristic
A bearish three line break structure often forms after a significant drop characterized by several large red Japanese candlesticks.
Significance
Contrary to what one might think, this does not signal a reversal of the trend.
A bearish three line break is a continuation pattern; it indicates continuation of the downward movement.
This is a sign of significant profit-taking that allows the drop to start again on a good basis.
Note
It is important that the three bearish candlesticks close at their low point.
Invalidation
If the closing of the last candlestick does not occur below the closing level of the first candlestick, or if the closing does not occur at the high point, then the bearish three line break structure is invalidated.
Concluding Thoughts
The bullish and bearish three line break patterns are continuation patterns that, despite their appearance, do not signal a reversal.
Instead, they indicate a temporary pause for profit-taking before the original trend continues.
Understanding these patterns can help traders identify moments of consolidation within a trend, allowing them to make informed decisions about the continuation of the market direction.
It is crucial to validate these patterns with proper closing levels to avoid false signals.
The Synapse Network is our dedicated global support team, including event managers, research teams, trainers, contributors, as well as the graduates and alumni from all our previous training program intakes.
