What Is a Bullish Harami?
A bullish harami is a basic candlestick chart pattern indicating that a bearish trend in an asset or market may be reversing.
This pattern is often used by traders to identify potential points of reversal and may signal a shift from a downward trend to an upward trend.
Understanding a Bullish Harami
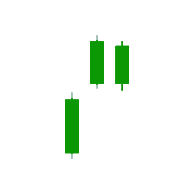
The bullish harami pattern is a candlestick chart indicator suggesting that a bearish trend may be coming to an end.
It is generally identified by a small increase in price, represented by a white candle, that is contained within the downward price movement of the previous days, shown by black candles.
This pattern is important for traders and investors as it may signal an opportunity to enter a long position on an asset.
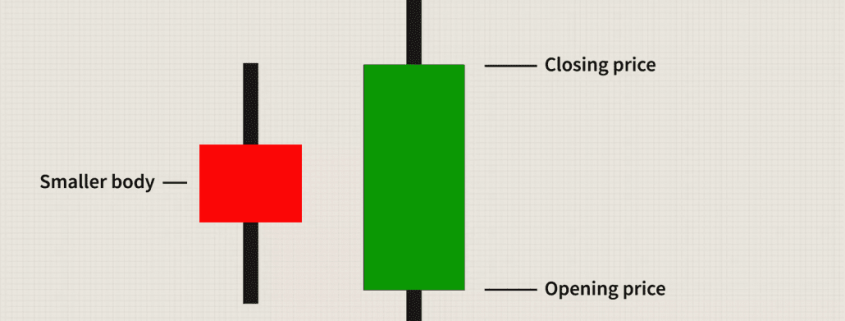
A candlestick chart, which this pattern is based on, is a type of chart used to track the performance of a security.
Named for its rectangular shape with lines protruding from the top and bottom, the chart resembles a candle and wicks.
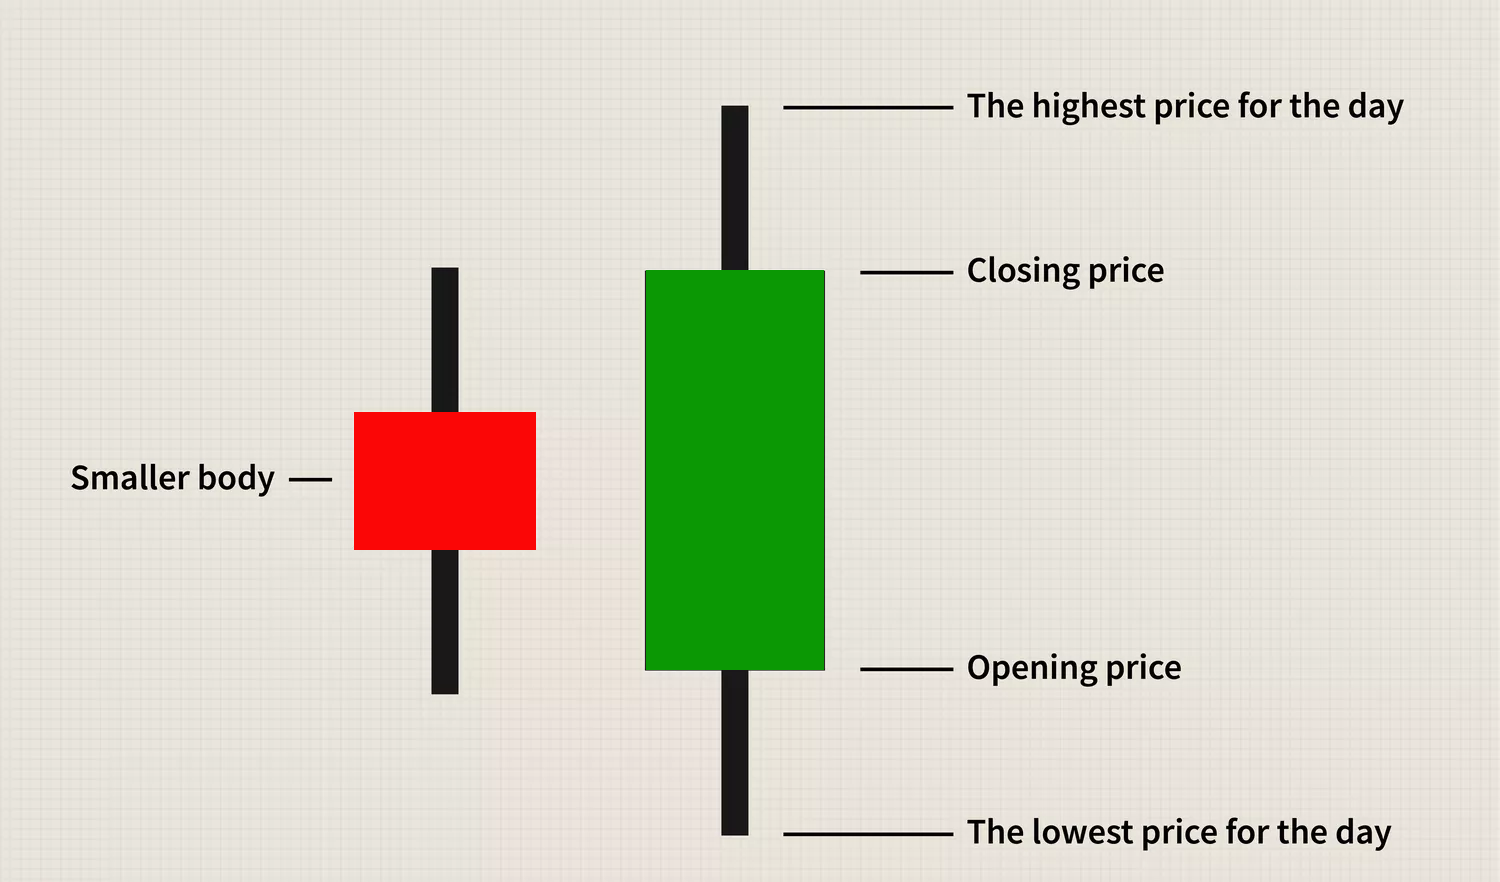
The candlestick chart typically represents the price data of a stock on a single day, including opening price, closing price, high price, and low price.
To identify a harami pattern, investors must first examine daily market performance as reported in candlestick charts.
The harami pattern emerges over two or more days of trading.
A bullish harami relies on the initial candles to indicate that a downward price trend is continuing and that the bearish market is pushing the price lower.
The bullish harami is characterized by a long candlestick followed by a smaller body, often referred to as a doji, which is completely contained within the vertical range of the previous body.
The word “harami” comes from an old Japanese word meaning “pregnant,” which is visually represented by the pattern where a smaller body is contained within the previous day’s candle, resembling a pregnant woman.
For a bullish harami to be confirmed, the smaller body on the subsequent doji should close higher within the body of the previous day’s candle.
This signals a greater likelihood that a reversal will occur.
Bullish Harami, Bearish Harami, and Advanced Candlestick Patterns
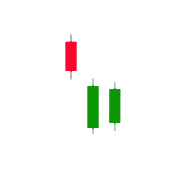
While the bullish harami signals a potential reversal in a bearish trend, its counterpart, the bearish harami, suggests the opposite: a potential reversal in a bullish trend.
Both patterns are essential tools in candlestick chart analysis, which offers a wide range of patterns to predict future trends.
These include basic patterns like bullish and bearish crosses, evening stars, rising threes, and engulfing patterns.
For those seeking deeper insights, advanced candlestick patterns such as island reversal, hook reversal, and san-ku or three gaps patterns can provide more detailed analysis and predictions.
Concluding Thoughts
The bullish harami is a valuable pattern for traders looking to spot potential reversals in a bearish trend.
While it offers a straightforward signal, it should be used in conjunction with other technical indicators and analysis to confirm the trend reversal.
Understanding and recognizing this pattern can help traders make more informed decisions and capitalize on emerging market opportunities. As with all trading strategies, a well-rounded approach that includes various tools and indicators will enhance the reliability of the pattern and improve overall trading outcomes.
The Synapse Network is our dedicated global support team, including event managers, research teams, trainers, contributors, as well as the graduates and alumni from all our previous training program intakes.