The Inverted Hammer Candlestick Pattern is a powerful tool for traders looking to identify trend reversals and potential buying opportunities.
But what is the Inverted Hammer Candlestick Pattern, and how can it be used to make profitable trades?
In this blog post, I’m going to teach you all about this candlestick pattern, how to identify it, the strategies to trade it, and some practical applications of this pattern.
How to Identify the Inverted Hammer
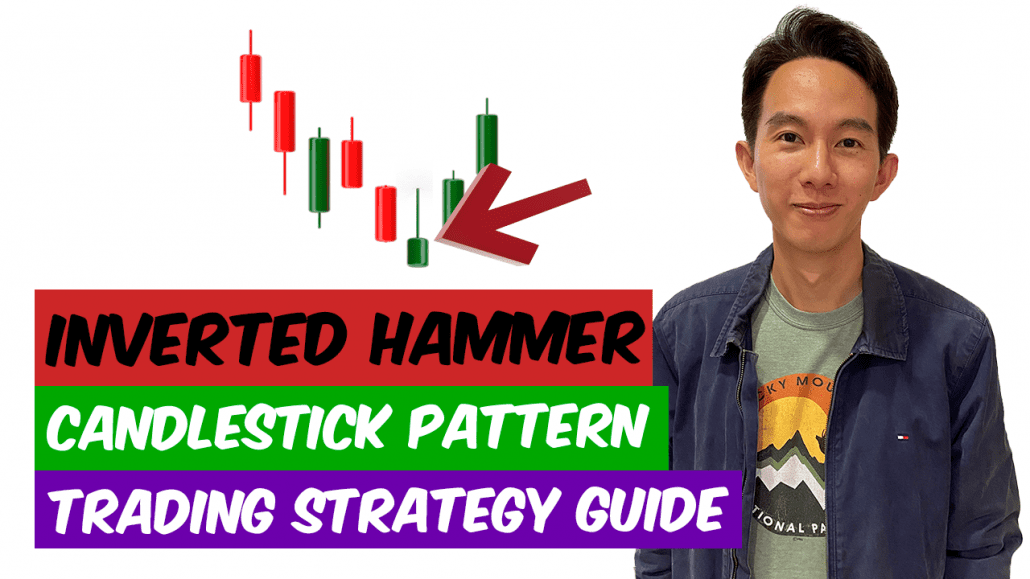
First, let’s take a look at how to identify the Inverted Hammer Candlestick Pattern.
This pattern is formed when the following conditions are met:
- The market is in a downtrend
- The candlestick has a small body, typically white in color
- The candlestick has a long upper shadow
- The lower shadow is small or absent
In other words, the Inverted Hammer Candlestick Pattern looks like a small white candle with a long tail pointing upwards.
This pattern indicates that, while the market was initially moving downwards, buyers were able to push prices up towards the end of the trading period.
Psychology of the Pattern
The psychology behind the Inverted Hammer Candlestick Pattern is one of potential bullish reversal.
While the market was previously moving downwards, the presence of buyers able to push prices upwards suggests that the downtrend may be coming to an end.
This can be a good opportunity for traders to enter the market and potentially profit from a potential uptrend.
How to Use it to Trade
So, how can the Inverted Hammer Candlestick Pattern be used to trade?
One strategy is to look for this pattern at key support levels.
If the market is approaching a key support level and an Inverted Hammer Candlestick Pattern appears, this may be a good opportunity to enter the market and buy.
Stop loss orders can be placed below the low of the Inverted Hammer Candlestick, while profit can be taken at resistance levels or using a trailing stop.
Where to Enter a Trade
When using the Inverted Hammer Candlestick Pattern as a potential bullish reversal signal, traders can enter the market by placing a buy order at the open of the next candlestick.
This allows traders to take a position in the market as soon as possible after the pattern appears.
Where to Place the Stoploss
Stop loss orders can be placed below the low of the Inverted Hammer Candlestick.
This allows traders to limit their potential losses in case the market does not move in their favor.
Where to Take Profit on the Trade
Profit can be taken at resistance levels or using a trailing stop.
By taking profit at a resistance level, traders can capitalize on the potential uptrend.
Alternatively, a trailing stop can be used to lock in profits as the market moves in the trader’s favor.
How to Combine with Trendlines
The Inverted Hammer Candlestick Pattern can also be combined with trendlines to identify potential trend reversals.
By drawing a trendline through the lows of the candlesticks, traders can identify a potential uptrend if the Inverted Hammer Candlestick appears near the trendline.
This can be a good opportunity to enter the market and potentially profit from an uptrend.
How to Combine with Support and Resistance Levels
Support and resistance levels can also be useful in conjunction with the Inverted Hammer Candlestick Pattern.
If the market is approaching a key support level and an Inverted Hammer Candlestick appears, this may be a good opportunity to enter the market and buy.
Stop loss orders can be placed below the low of the Inverted Hammer Candlestick, while profit can be taken at resistance levels or using a trailing stop.
How to Combine with Price Patterns
The Inverted Hammer Candlestick Pattern can also be combined with other price patterns to increase the reliability of trade signals.
For example, if the Inverted Hammer Candlestick appears in conjunction with a Double Bottom pattern, this may be a particularly strong signal for a potential trend reversal.
How to Combine it with Price Action
Price action analysis is the study of the movement of a security’s price over a given period of time.
When combined with the Inverted Hammer Candlestick Pattern, price action analysis can help traders identify potential bullish reversal signals and make informed trading decisions.
To combine the Inverted Hammer Candlestick Pattern with price action analysis, traders can look for other bullish reversal patterns in conjunction with the Inverted Hammer.
For example, if the market is in a downtrend and an Inverted Hammer Candlestick appears, traders can look for other bullish reversal patterns, such as Bullish Engulfing Patterns or Hammer Patterns, to confirm the potential trend reversal.
How to Combine it with Trend-following Indicators
Trend-following technical indicators such as moving averages, MACD, and ADX can also be useful in combination with the Inverted Hammer Candlestick Pattern.
By using these indicators to confirm a potential trend reversal, traders can increase the reliability of their trade signals.
How to Combine with Oscillators
When the RSI is combined with the Inverted Hammer Candlestick Pattern, traders can look for bullish reversal signals in oversold markets.
For example, if the market is in an downtrend and the RSI is below 30, the appearance of an Inverted Hammer Candlestick Pattern may be a good opportunity to buy.
Similarly, the Stochastics indicator is a momentum oscillator that measures the location of a security’s price relative to its price range over a set period of time.
Like the RSI, the Stochastics indicator can be useful in identifying overbought and oversold conditions.
When combined with the Inverted Hammer Candlestick Pattern, traders can look for bullish reversal signals in oversold markets.
Limitations of Inverted Hammer Pattern
It’s important to keep in mind that the Inverted Hammer Candlestick Pattern is not a perfect trading tool and should not be relied upon exclusively.
It’s always important to use a range of indicators and techniques to increase the reliability of trade signals and to minimize risk.
The pattern may also be less reliable in volatile or low volume markets, as these conditions may create false signals.
Practical Applications & Tips
As a professional trader, I have a strong understanding of how to trade effectively and consistently.
This knowledge has helped me to level the playing field against other retail traders, and has given me an edge in the market.
My former experience in fund trading has also given me valuable insights into how professionals trade differently, and I have been able to apply this knowledge to my personal trading.
Finally, I make use of the principle of confluence in my trading, looking for alignment between different approaches and techniques.
I use a multi-faceted approach that combines different indicators and techniques, such as trendlines, support and resistance levels, and oscillator indicators.
This approach helps me to make the most informed trades possible, and has helped me to consistently grow my trading account.
Concluding Thoughts
In conclusion, the Inverted Hammer Candlestick Pattern is a valuable tool for traders looking to identify trend reversals and potential buying opportunities.
By combining this pattern with other techniques and indicators, traders can increase the reliability of their trade signals and maximize their chances of making profitable trades.
While the Inverted Hammer Candlestick Pattern is not a perfect trading tool, it can be a valuable addition to any trader’s toolkit.
Now that I have covered all about this candlestick pattern, is it something that you will add to your trading toolbox?
Let me know in the comments below.

If you would like to learn more about all the different candlestick patterns, also check out: “The Definitive Guide to Candlestick Patterns”
After trading for 18 years, reading 1500+ books, and mentoring 1000+ traders, I specialise in helping people improve their trading results, by using tested trading strategies, and making better decisions via decision science.


