Table of Contents
What Is a Bearish Engulfing Pattern?
In technical analysis, the bearish engulfing pattern is a chart pattern that can signal a reversal in an upward price trend.
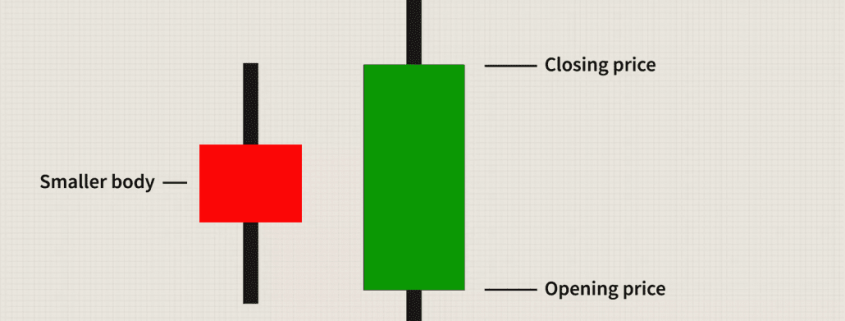
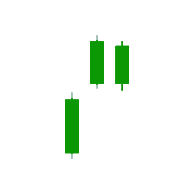
Comprising two consecutive candles, the pattern features a smaller bullish candle followed by a larger bearish candle that engulfs the first.
This formation is considered a strong indicator that the prior upward momentum is waning and a reversal is on the horizon.
Understanding the Bearish Engulfing Pattern
The bearish engulfing pattern is a two-candle reversal pattern.
The second candle completely engulfs the body of the first one, signaling a potential shift in market sentiment from bullish to bearish.
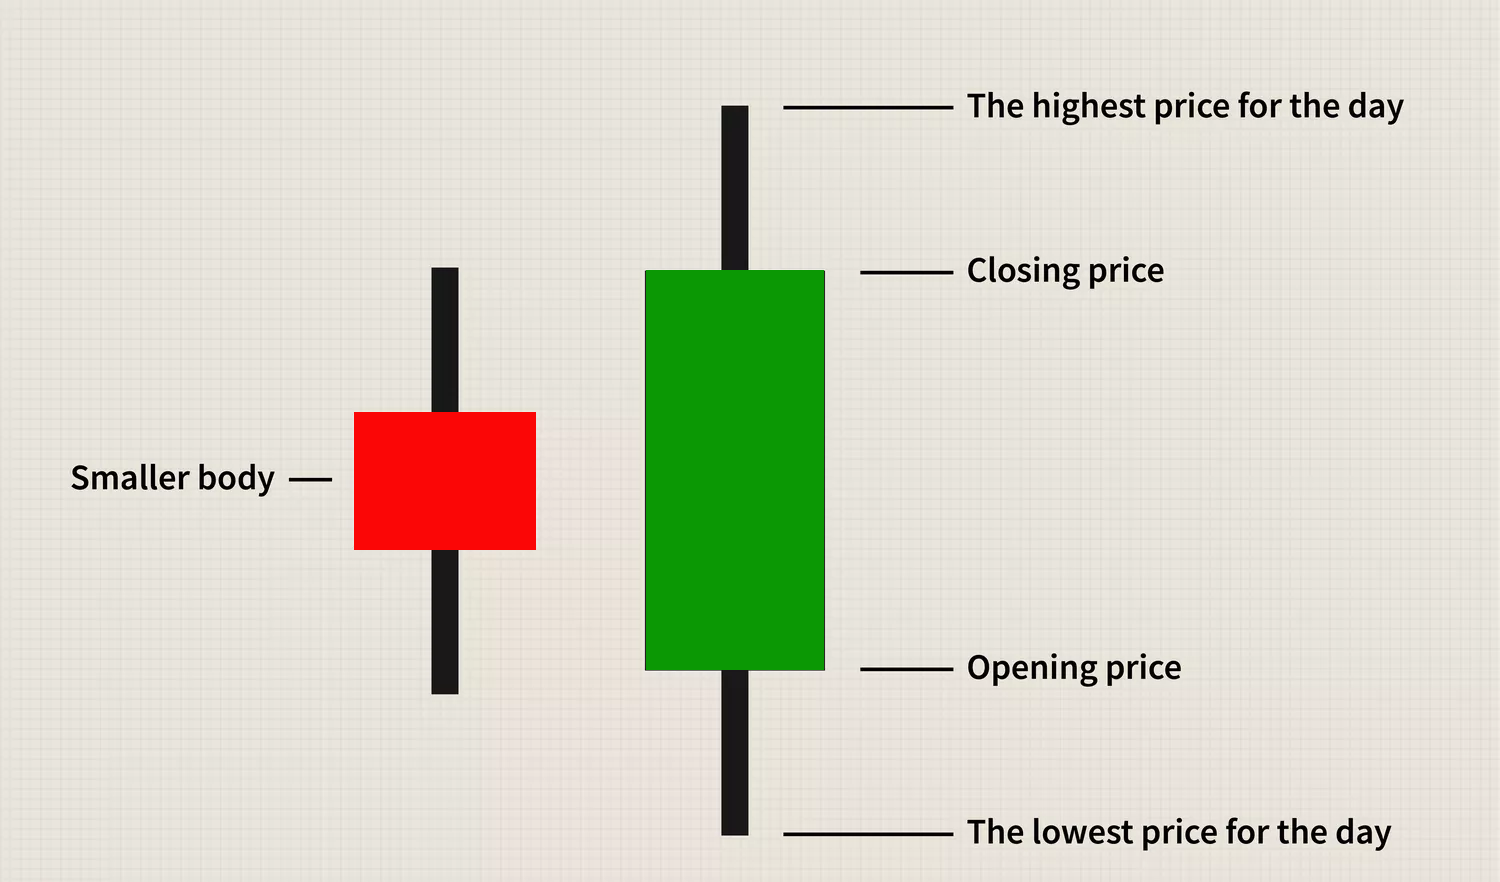
For the pattern to be valid, the body of the down candle must engulf the up candle, meaning the high must be higher, and the low must be lower than the previous candle.
This pattern is more significant if it occurs after a price advance, indicating that the uptrend may be losing strength and a downtrend could be imminent.
Interpreting the Bearish Engulfing Pattern
The bearish engulfing pattern serves as a warning sign, signaling a potential reversal from a bullish to a bearish trend.
It indicates a sudden shift in market sentiment where sellers have overtaken buyers.
When this pattern appears after an uptrend, it suggests that the bullish momentum is weakening.
This pattern is often an early indicator that a downtrend may be on the horizon.
For investors holding long positions, it can be a signal to consider exiting or tightening stop-loss levels.
For traders shorting the asset or market, this pattern can mark a good entry point, though additional confirmation is typically needed.
The Psychology Behind the Bearish Engulfing Pattern
The psychology behind the bearish engulfing pattern reflects the shifting dynamics between buyers and sellers.
Initially, there is optimism as the pattern usually occurs after a period of upward price movement, indicating that buyers have been in control.
The small bullish candle suggests that buyers still expect the upward trend to continue.
The appearance of a large bearish candle that engulfs the previous bullish candle signals a change in sentiment.
This indicates that sellers have entered the market with enough force to overshadow the previous gains.
This shift can prompt those holding long positions to sell and exit, while bearish traders may see this as an opportunity to enter short positions.
Both bears and bulls may seek additional confirmation that the pattern signifies what it suggests.
If the price continues to move downward after the pattern, it would validate the bearish sentiment, reinforcing the likelihood of a downtrend.
Trading the Bearish Engulfing Pattern
The bearish engulfing pattern is often used as a technical signal for a potential reversal from bullish to bearish sentiment.
This pattern is typically seen at the end of an uptrend and can be more significant when accompanied by high trading volume.
To confirm the bearish signal, traders can wait for a subsequent bearish candle in the next session or look for a gap down, where the opening price is lower than the previous session’s closing price.
Additional technical tools, such as moving averages or RSI, can be used to confirm the bearish signal.
For example, a crossover in MACD or an RSI heading below 70 could provide additional confirmation.
When trading this pattern, traders typically initiate a short position after confirming the bearish signal, with a stop loss set above the highest point of the engulfing candle.
The Pros and Cons of Using the Bearish Engulfing Pattern
The bearish engulfing pattern offers several advantages as an early warning signal and is relatively easy to identify.
It is versatile and can be applied across various time frames and markets.
However, the pattern is not without its drawbacks.
It can produce false signals, especially in choppy markets, and often requires additional confirmation, which can delay action.
Moreover, it is a lagging indicator, as it forms after price changes have occurred.
Concluding Thoughts
The bearish engulfing pattern is a valuable tool for traders looking to identify potential reversals in an uptrend.
While it is a powerful signal, especially when confirmed by other technical indicators, it should not be relied upon in isolation.
The pattern’s effectiveness can vary depending on the context, and it often requires additional confirmation to reduce the risk of false signals.
As with any trading strategy, proper risk management and a well-rounded approach are essential when incorporating the bearish engulfing pattern into your analysis.