Table of Contents
What Is an Island Reversal?
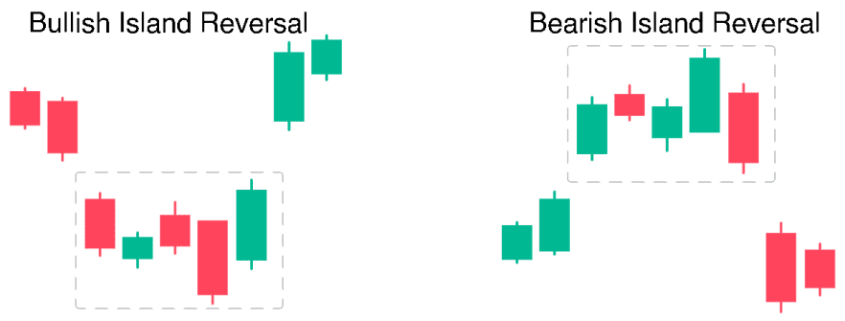
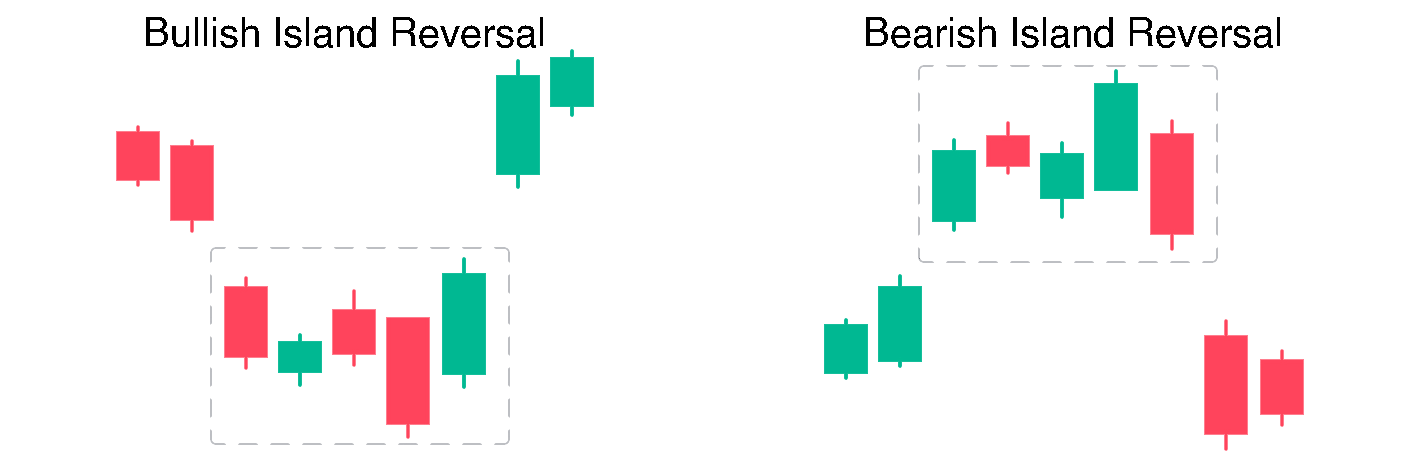
An island reversal is a price pattern that, on a daily chart, shows a grouping of days separated on either side by gaps in the price action.
Stock analysts interpret this pattern as an indication that the stock’s price may reverse the trend it is currently exhibiting, whether from upward to downward or from downward to upward.
An island reversal can be displayed on a bar chart or a candlestick chart.
Key Characteristics of an Island Reversal
This island reversal price pattern occurs when two or more gaps isolate a cluster of trading days.
The pattern usually implies a reversal and can apply to a bullish or bearish change.
Island reversals changing from upward trending prices (bullish) to downward trending prices (bearish) are much more common than the opposite.
Understanding the Island Reversal Pattern
Island reversals are a unique identifier because they are defined by price gaps on either side of a grouping of trading periods (usually days).
While many analysts and traders believe that gaps will eventually be filled—meaning that prices will retrace over any gap that previously occurs—the island reversal is based on the idea that the two gaps in the formation will often not be filled, at least not for a while.
The island reversal can be a top or a bottom formation, though tops are far more frequent between the two.
In other words, it more often indicates that the stock’s price is reaching its peak and is poised for a reversal.
Characteristics of the Island Reversal Formation
The island reversal formation has five standout characteristics:
- A lengthy trend leading into the pattern.
- An initial price gap.
- A cluster of price periods that tend to trade within a definable range.
- A pattern of increased volume near the gaps and during the island compared to the preceding trend.
- A final gap that establishes the island of prices isolated from the preceding trend.
Example of a Bearish Island Reversal
A bearish island reversal, the more common type, will be charted over a series of days or weeks and is preceded by a significant upward move.
In this example, the stock price makes a run to its highs, makes an island reversal, then returns to its highs only to make another island reversal.
This type of pattern often displays two island reversals comprising a double top price pattern, with each island reversal showing a rise in volume during the isolated section of trading days.
Inferences and Supporting Indicators
Island reversals may have a cluster of prices that span varying time frames of days, weeks, or even months.
Thus, it is essential to watch for the gaps that open and close this pattern.
Gap patterns occur when a significant difference in price is shown from one day to the next.
Gaps up will be formed from two white candlesticks, with the second showing an opening price higher than the previous day’s closing price.
Gaps down occur from two red candlesticks, with the second showing an opening price lower than the previous day’s closing price.
Island reversals, like all reversal patterns, will typically be supported by a later breakaway gap to initiate the island grouping and then by an exhaustion gap to close out the formation.
The appearance of the exhaustion gap is usually the first sign of a new trend, which will then include several runaway gaps in the new direction, followed by an exhaustion gap.
It’s important to note that several authors who have researched this price pattern claim that the pattern occurs infrequently and produces poor performance results.
Concluding Thoughts
The island reversal is a unique and rare pattern in technical analysis that signals a potential trend reversal in a stock’s price.
It is most commonly seen when a stock reaches its peak and is about to reverse downward.
While it can be a powerful indicator, it’s essential to use it in conjunction with other technical tools and analysis methods to confirm its reliability.
Given its rarity and mixed performance results, traders should approach the island reversal pattern with caution, ensuring they have a clear understanding of the broader market context before acting on it.
