Many people have emailed me saying that I have missed this rally because I was too bearish and not flexible, but it really depends on your strategy. My strategy is to take high probability “with trend” trades, and even if I am wrong a few times, catching a strong “with trend” move more than makes up for all the wrong entries. Countertrend moves, on the other hand, is a fun gamble at picking bottoms, and easy to spot on hindsight, but definitely not easy to trade and not worth the risk. That’s my opinion.

^sti-101111

For the past 2 months, there has not been more than 3 white candles in a row on the STI chart. I thought that today might be different given that Dow that surged 330 points up the night before, but the STI gave back some gains near the close, forming a black bar. While I cannot be certain that this marks the end of the rally, I think it is worth the risk to take a small short position if today’s low is taken out tomorrow. 

n21-101111 

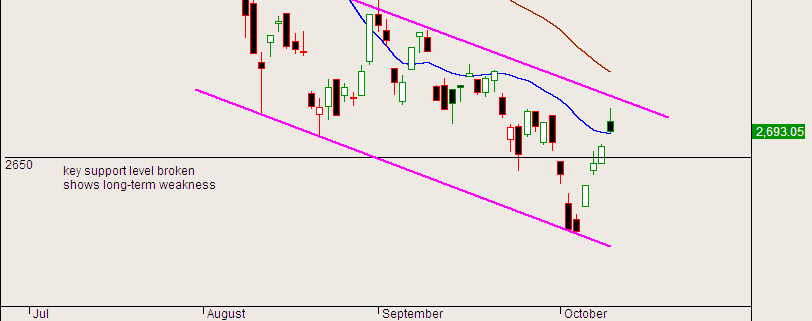
Noble is testing the middle channel line, and there was a bearish bar today on high volume. I would be watching to short if price falls below 1.360. Please read the disclaimer on my website and take note that my strategy is likely different from yours. I will cut my losses fast once I realise I am wrong, but I may not have the time to blog about it until the end of the day. Good luck!

Stock Indices

I am not a big fan of Elliot wave, nor is it my area of specialty, but last night this chart pattern jumped right out at me from the charts. It was a glaring 5 waves up followed by a corrective abc equal size. What is even more interesting is a smaller abc within the b wave. I posted this chart in the forum here soon after.

Stock Indices

This is how the day ended. There was some fresh news that pushed the index up at the last hour. Notice another 5 wave decline soon after I posted my previous chart. “Perfect” patterns like these seldom appear, but have strong predictive value when they do.

Self- attribution bias (or self-serving attributional bias) refers to the tendency of individuals to ascribe their successes to innate aspects, such as talent or foresight, while more often blaming failures on outside influences, such as bad luck. There are actually two kinds of self-attribution bias, namely self-enhancing bias and self-protecting bias.

Self-enhancing bias represents people’s propensity to claim an irrational degree of credit for their successes, for example, if people intend to succeed, then outcomes in accordance with this intention will be perceived as the results of them acting to achieve the intention, regardless of whether the actions indeed played a crucial role.


Self-Attribution Bias


Self-protecting bias represents the corollary effect – the irrational denial of responsibility of failure, for example people trying to maintain their self-esteem by protecting themselves psychologically as they attempt to comprehend their failures.

Irrationally attributing successes and failures can impair traders in two ways. First, people who aren’t able to perceive the mistakes they’ve made are, consequently, unable to learn from those mistakes. Second, traders who disproportionately credit themselves when desirable outcomes do arise can become detrimentally overconfident in their own market savvy, leading to overconfidence bias.

When trades turn out well, people like to think that their method or analysis was fantastic, and that they are good traders. When trades do not turn out well, people will blame their broker, their platform, the news – basically anything but themselves. As you can see, over time, this leads traders to think that they are much better than they actually are.

What is the best solution for this?

One way to overcome this bias is to treat both winning and losing trades as objectively as possible, tabulating and recording them to obtain a running record. It also helps to do an objective post-trade analysis, reviewing your records to learn from past mistakes. With sufficient data, one can then objectively analyse the consistency of the methods and returns, and as they say – the numbers do not lie.

“Don’t confuse brains with a bull market.”

 Review of US Indices

Review of US Indices 2

The latest headlines from Bloomberg proclaims, “Germany May be Ready to Surrender in Fight to Save Greece”. Once again, the attention has shifted to the Europe crisis, just after the anti-climax jobs and stimulus talks in the US. Looking at the weekly charts of the Dow Jones and S&P500, we see that both have violated a major trendline after exhibiting the same H&S pattern. This is bearish. Now, prices are consolidating in a tight range. We might see a test of the previous high if there is any good news. Otherwise, this bear flag might break strongly to the downside. We will have to watch the news closely. You can sign up for our mailing list by clicking here.

Leonardo Da Vinci once said that simplicity is the ultimate sophistication. Let’s take a moment to ponder that. This applies to research analysis as well. When you hear people talking about some sophisticated trading system or some flashy indicators or some complex wave projections, think again. It is more likely to be smoke and mirrors. All these tell you nothing new if you know how to read the bare charts. It’s as simple as that. Simple, and yet sophisticated. Looking back at my last few stock picks, I found that it is possible to read and understand what is happening on the charts. This makes it possible to pinpoint the low risk entry points, as seen in some of my previous posts.

https://synapsetrading.com/dbs-are-the-banks-leading-the-decline/
https://synapsetrading.com/noble-group-evening-star-signals-turn-to-the-downside/

Compare that with indicators. If you see a green arrow, do you know why it is a buy? Maybe it worked the past 3 times, but will it work this time? Maybe. Or maybe not. You won’t know. In fact, you won’t have any idea why there is a green arrow. You won’t know what is happening in the market. You won’t know what the smart money is doing. That is why chart-reading is an important skill everyone should master. Banks, funds and proprietary trading firms use it as their main tool. Maybe you should consider it too.