Candlestick patterns are an essential component of technical analysis, offering traders insights into potential market reversals. While relying solely on candlestick patterns may be unstable, they can significantly supplement a well-rounded trading system that incorporates other strategies. Among these patterns, the Tower Top and Tower Bottom are classic reversal formations that indicate a change in market sentiment.
Table of Contents
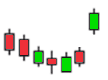
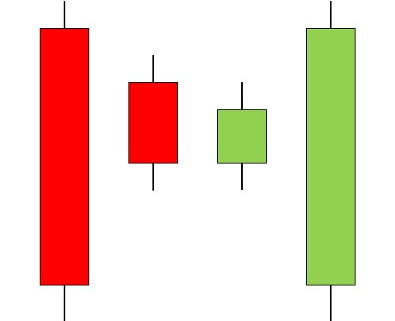
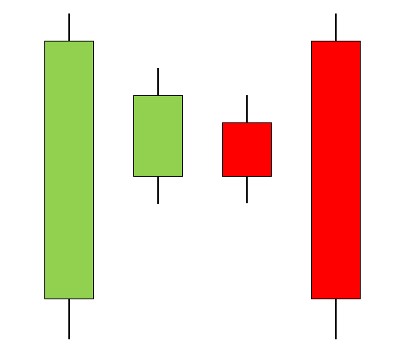
Tower Top Candlestick Pattern
The Tower Top candlestick pattern signals a potential reversal from a bullish to a bearish trend.
Formation:
- The pattern starts with a strong bullish movement, typically represented by a large green candlestick.
- This is followed by a period of sideways movement, characterized by small candlesticks, often of varying colors and sizes, indicating market indecision.
- The pattern culminates with one or more large bearish candlesticks that break the prior support levels, suggesting that the upward momentum has ended and a downtrend is beginning.
Key Characteristics:
- The pattern often appears after a significant upward movement, marked by several large green candlesticks.
- It signals a bearish reversal, indicating that buyers are losing momentum and sellers are starting to take control.
- The pattern is confirmed if the final bearish candlestick is long, signaling a strong move downward.
Chart Example:
A typical Tower Top pattern may include a sequence of small-bodied candlesticks following a large bullish candlestick. The bearish candlestick at the end of the pattern usually marks the start of a downtrend, particularly if it breaks below the lows of the preceding small-bodied candlesticks.
Notes:
- The Tower Top is most reliable when it occurs after a significant price increase.
- It does not require multiple large bearish candlesticks for confirmation; one strong bearish candlestick is often sufficient.
- The pattern is invalidated if the final bearish candlestick is not long enough to signal a clear reversal.
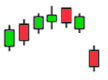
Tower Bottom Candlestick Pattern
The Tower Bottom is the bullish counterpart to the Tower Top, indicating a potential reversal from a bearish to a bullish trend.
Formation:
- The pattern begins with a strong downward movement, usually represented by a large red candlestick.
- This is followed by a series of smaller candlesticks that indicate a slowdown in the downward momentum, often moving sideways.
- The pattern is completed by a large bullish candlestick that closes near or above the levels of the preceding smaller candlesticks, suggesting that the downtrend has ended and an uptrend is beginning.
Key Characteristics:
- The Tower Bottom typically forms at the end of a prolonged downtrend.
- It suggests that sellers are losing momentum and buyers are starting to regain control.
- The pattern is confirmed when the final bullish candlestick is large, signaling a strong upward move.
Chart Example:
In a Tower Bottom pattern, you may observe a large red candlestick followed by several smaller bearish candlesticks. The pattern is confirmed when a large bullish candlestick emerges, closing near the levels of the initial large red candlestick, signaling the start of an uptrend.
Notes:
- The Tower Bottom is most effective when it follows a significant price decline.
- The pattern may be preceded by a Bullish Harami, which can act as an early indicator of the upcoming reversal.
- The pattern is invalidated if the final bullish candlestick does not show a strong reversal.
Limitations
While Tower Top and Tower Bottom patterns can be effective when correctly identified, they also carry the risk of misinterpretation.
Common Pitfalls:
- Misreading the pattern can lead to premature exits or entries, resulting in potential losses.
- Patience is crucial when identifying these patterns, as a failed Tower Top or Bottom can result in inaccurate predictions of market direction.
Key Considerations:
- Ensure that the pattern is supported by other technical indicators or significant support/resistance levels before making trading decisions.
- Avoid making hasty conclusions based solely on the appearance of two consecutive peaks or troughs.
Concluding Thoughts
The Tower Top and Tower Bottom candlestick patterns are powerful tools for identifying potential market reversals.
When used correctly, they can provide valuable insights into shifts in market sentiment, helping traders anticipate changes in trend direction.
However, these patterns should be used in conjunction with other technical indicators and a solid understanding of market dynamics to maximize their effectiveness and minimize the risk of misinterpretation.