For subscribers of our “Daily Trading Signals”, we now also include a “Weekly Market Report”, where we provide a weekly deep-dive on the market, including fundamentals, technical, economics, and portfolio management:
Click here to subscribe for the latest market report (20 November 2023)
Click here to see the archives of all our past market reports
Market Recap & Upcoming Week
Last week in the markets was marked by a “just right” economic scenario, mirroring the tale of Goldilocks, with stocks reaching a two-month high and easing recession fears. Inflation showed signs of moderation, with the October Consumer Price Index (CPI) remaining unchanged and the annual rate dropping from 3.7% to 3.2%.
This decrease was aided by lower gas prices and a 20% reduction in oil prices since September. Core CPI also saw a slight decrease, indicating an overall slowing of inflation, which might lead the Federal Reserve to revise its projections downwards in their upcoming meeting.
Economic growth is gently decelerating but still expanding at a solid pace, indicating a gradual shift in the economy. Retail sales in October dipped slightly but less than expected, suggesting a slowing yet continuous consumer activity.
The job market is cooling, with jobless claims rising but still below historical averages, hinting at a strong economic foundation. Additionally, falling yields in Treasury bonds suggest a change in the Fed’s policy, possibly marking the peak of the rate hike cycle. This shift has led to a rally in both equity and bond markets, with the possibility of rate cuts in the second half of 2024.
The equity market’s broadening leadership and potential for laggards to catch up as yield pressures ease point towards an optimistic outlook for 2024.
This week, the trading landscape in the U.S. is shaped by the Thanksgiving holiday, with markets closing on Thursday and concluding early on Black Friday.
This period marks a significant retail event, with major retailers like Amazon, Target, Walmart, Best Buy, Home Depot, and Costco launching Black Friday sales, offering a variety of deals and promotions. The focus is not just on consumer behavior during this key shopping period but also on how these retail giants perform amid the festive buzz.
In addition to the retail frenzy, the week also brings attention to a few remaining earnings reports, notably from Lowe’s, Best Buy, Dick’s Sporting Goods, Abercrombie & Fitch, Kohl’s, and Nordstrom.
All eyes might be on Nvidia, the tech giant known for its strides in artificial intelligence, as it announces its earnings on Tuesday.
Furthermore, market participants will be keenly observing updates on existing home sales and consumer sentiment, along with eagerly awaiting the insights from the Federal Open Market Committee’s (FOMC) latest meeting minutes, also scheduled for release on Tuesday.
Daily Trading Signals (Highlights)

CADCHF – Prices just broke new lows, one step closer to our TP! 💪🏻

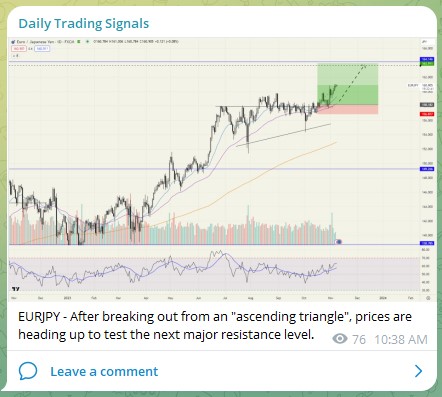
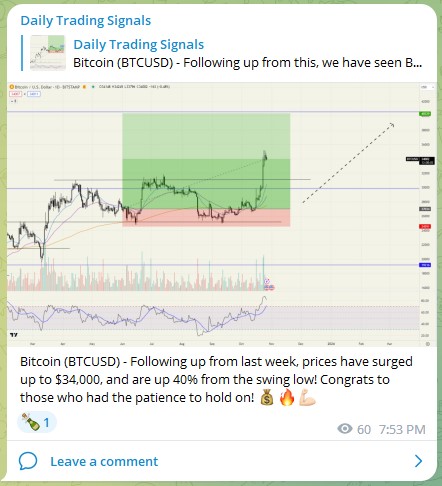
EURJPY – Following up on this trade, it has hit our TP for +580 pips profit! Congrats to those who took this trade! 💰🔥💪🏻

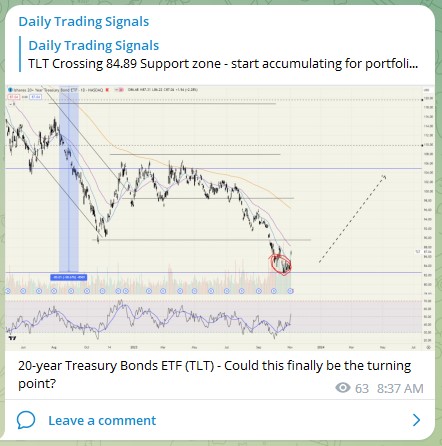
20-year Treasury Bonds ETF (TLT) – Prices rebounded almost 10% off the lows! 💰🔥💪🏻
Subscribe for real-time alerts and weekly reports:
👉🏻 https://synapsetrading.com/daily-trading-signals