Free trading guide
The Definitive Guide to Technical Trading Indicators
 By Spencer Li, CFTe · Last updated 16 October 2026
The 5 families of indicators, what each one measures, and how to combine 2 or 3 without drowning in them.

Free trading guide
By Spencer Li, CFTe · Last updated 16 October 2026
The 5 families of indicators, what each one measures, and how to combine 2 or 3 without drowning in them.
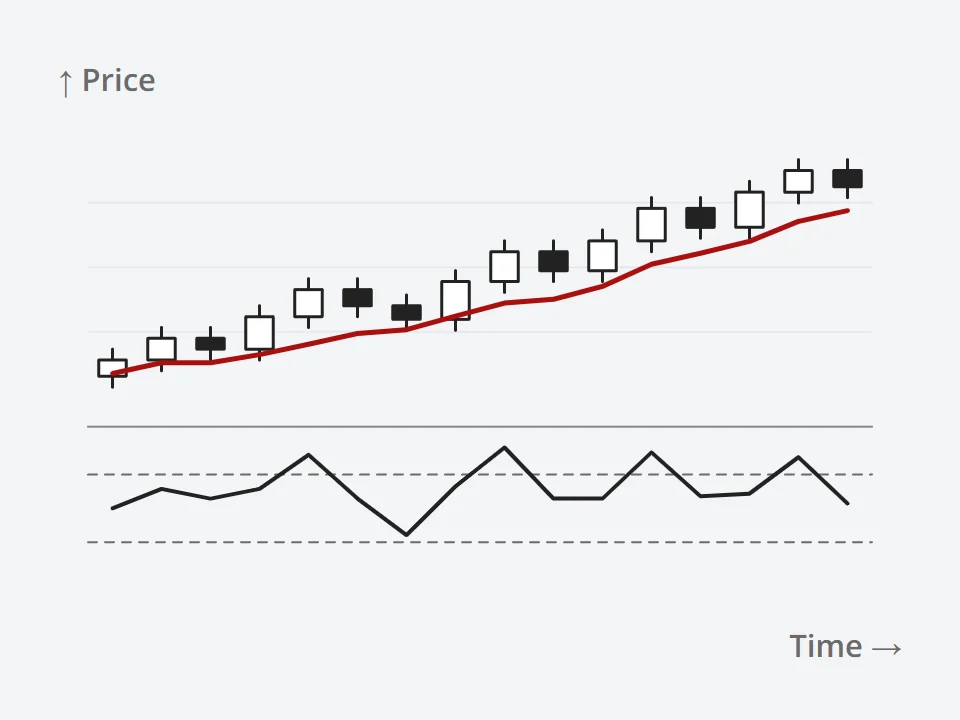
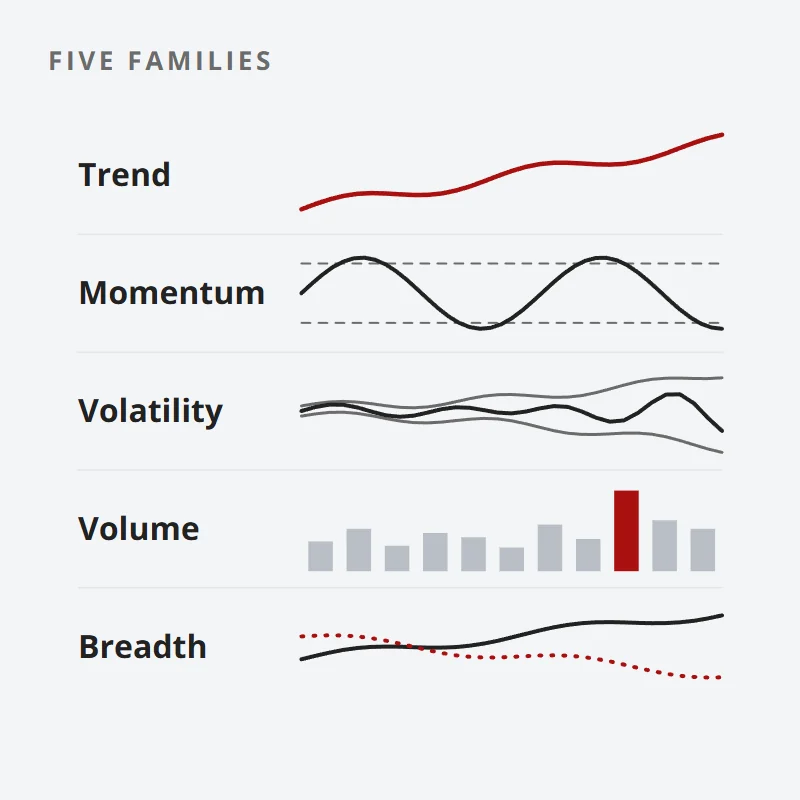
A technical indicator is a formula run on a market's price and volume, then drawn on the chart so one thing is easier to see: the trend, the momentum, the volatility or the money behind a move. They come in 5 families, and this guide answers each one on the page.
The short version first. An indicator can never know more than the price it was built from, so it works best as a second opinion on a chart you can already read. Pick 1 or 2 from different families, learn them well, and leave the rest.
Chapter 1 of 7
Every bar on a chart holds 5 pieces of raw information: the open, the high, the low, the close and the volume. An indicator takes those same 5 numbers and runs a formula over them. A 20-day moving average, for example, adds up the last 20 closing prices, divides by 20, repeats that every day and joins the dots.
That has 2 consequences, and both matter more than any single indicator. An indicator can never be faster than price, because it is built from price. And it smooths away detail, so it can hide the very bar you needed to see.
Indicators are 1 of the 3 main types of technical analysis. The other 2 are classical charting, where you draw support, resistance, trendlines and chart patterns by eye, and price action, where you read the bars themselves. Most traders end up using a mix of all 3.
Personally, I learned to read price first and treat indicators like the training wheels on a bicycle. They help while you learn, and you lean on them less as your eye improves. Walk onto a bank or fund trading floor and look at the screens. Most of the charts are close to blank.
Further reading

Free checklist
The 15-Minute Swing Trader's Checklist is the daily and weekly routine I use to find, manage and review trades in about 15 minutes a day. Five pages, free, straight to your inbox.
Free 5-page PDF, then occasional trading emails. Education only, not financial advice. Unsubscribe anytime. Kit stores your email in the US: see our privacy policy.
Chapter 2 of 7
A trend indicator answers one question: is the market going up, down or sideways? It is the most important question on the chart.
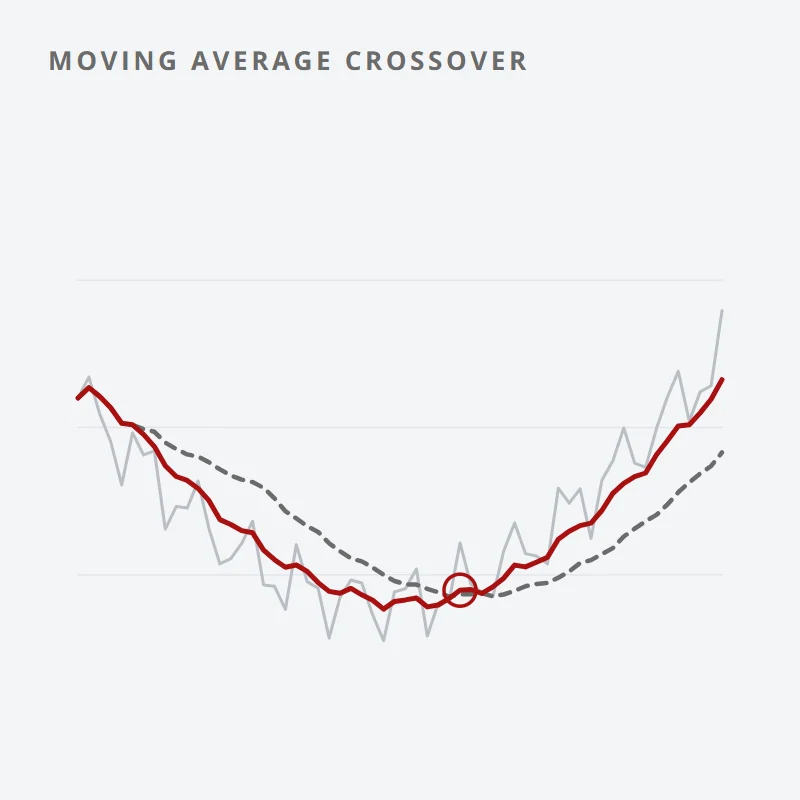
The moving average is the workhorse. A simple moving average gives every day the same weight. An exponential moving average gives recent days more weight, so it turns sooner and also gives more false turns. Many swing traders use a long average, such as the 200-day, as a filter. Price above a rising line means look for longs, and price below a falling line means look for shorts or stay out.
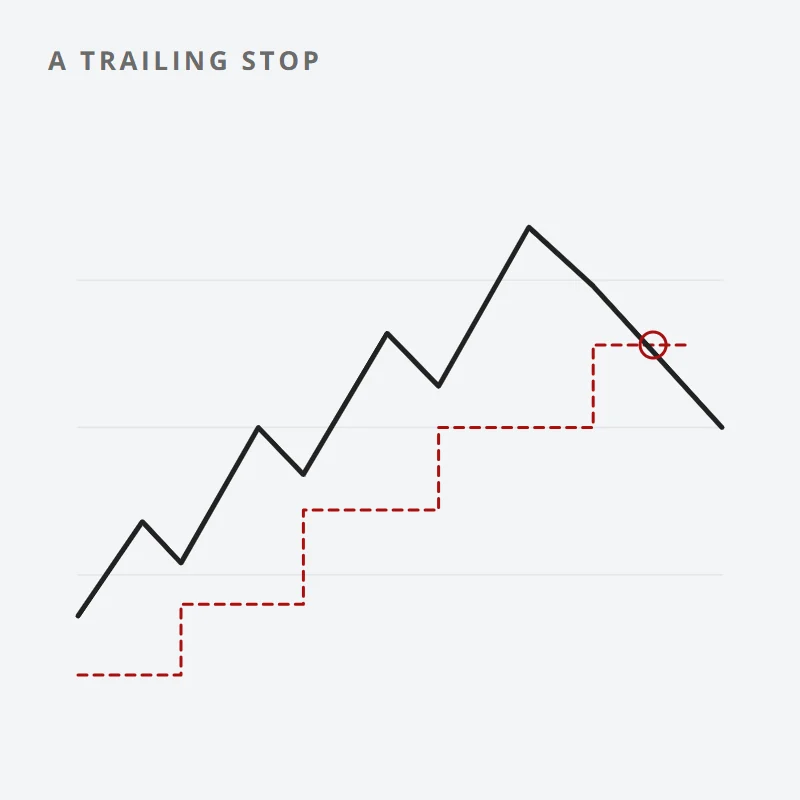
2 other tools here measure how strong a trend is rather than which way it points. The Average Directional Index, or ADX, runs from 0 to 100, and a reading above about 25 is the usual sign of a trend worth following. Parabolic SAR plots dots that trail behind price and flip sides when the trend turns, which makes it a handy trailing stop.
The cost is lag. A trend indicator confirms a move after it has started, so it always misses the first part and gives some back at the end. In a sideways market it is worse, because price crosses the average again and again, and every cross is a false signal. So the first question is always the market's regime. Decide whether it is trending before you trust a trend tool.
Further reading
Chapter 3 of 7
Momentum is the speed of a move. An oscillator measures that speed and squeezes it into a fixed band, so you can see when a move is stretched.
The Relative Strength Index, or RSI, is the best known. J. Welles Wilder published it in 1978 with a 14-period default. It swings between 0 and 100, and readings above 70 are called overbought and below 30 oversold. The stochastic oscillator compares today's close with the recent high-low range. MACD, short for moving average convergence divergence, tracks the gap between a 12-period and a 26-period EMA, with a 9-period signal line.
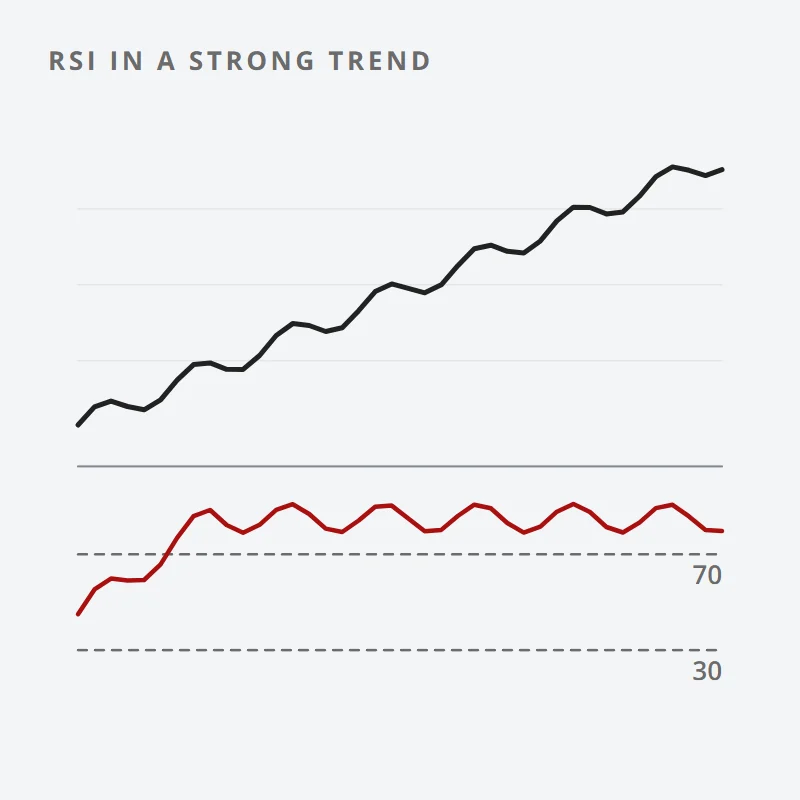
Here is the trap, and it catches most beginners at least once. In a strong uptrend, RSI can sit above 70 for weeks. A trader who sells every "overbought" reading keeps shorting into strength, takes loss after loss, and only accepts the trend when the damage is done. Overbought describes a strong market, and a strong market can stay strong for a long time.
So where do oscillators earn their place? In ranges, where price really does swing between extremes. As a timing aid inside a trend you have already identified, such as waiting for an uptrend's pullback to cool RSI off before you look for an entry. And in divergence: price makes a new high and the oscillator does not, which tells you the move is running out of fuel.
Further reading
Chapter 4 of 7
Volatility is how far price normally travels. It decides 2 things every trader has to get right: where the stop goes, and how big the position can be.
The Average True Range, or ATR, is another of Wilder's 1978 tools, and it is the plainest measure of all. It averages each bar's true range, which is the high-to-low distance plus any gap from the previous close. Say a stock's 14-day ATR is 2% of its price. A stop placed 0.5% away sits inside the normal daily noise, and it will be hit for no reason at all.
Bands and channels draw that volatility around price. Bollinger Bands, built by John Bollinger in the 1980s, sit 2 standard deviations above and below a 20-period average. Keltner Channels use ATR instead. Donchian Channels simply mark the highest high and lowest low of the last N bars, the breakout rule made famous by the Turtle traders in the 1980s.
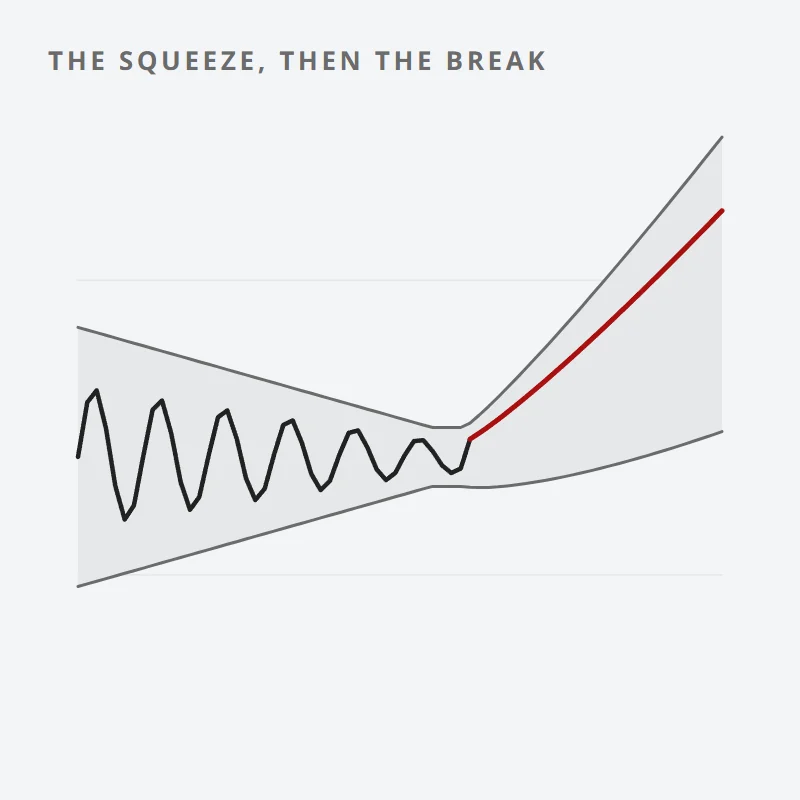
2 readings are worth learning first. When the bands squeeze tight, volatility is low, and quiet markets tend to be followed by bigger moves. And when price rides the upper band in a trend, that is strength, the same lesson as the overbought oscillator.
For a beginner this may be the most useful family of all, because it teaches risk before it teaches entries.
Further reading
Chapter 5 of 7
Volume is the number of shares or contracts that changed hands. Price tells you where the market went. Volume tells you how many people agreed.
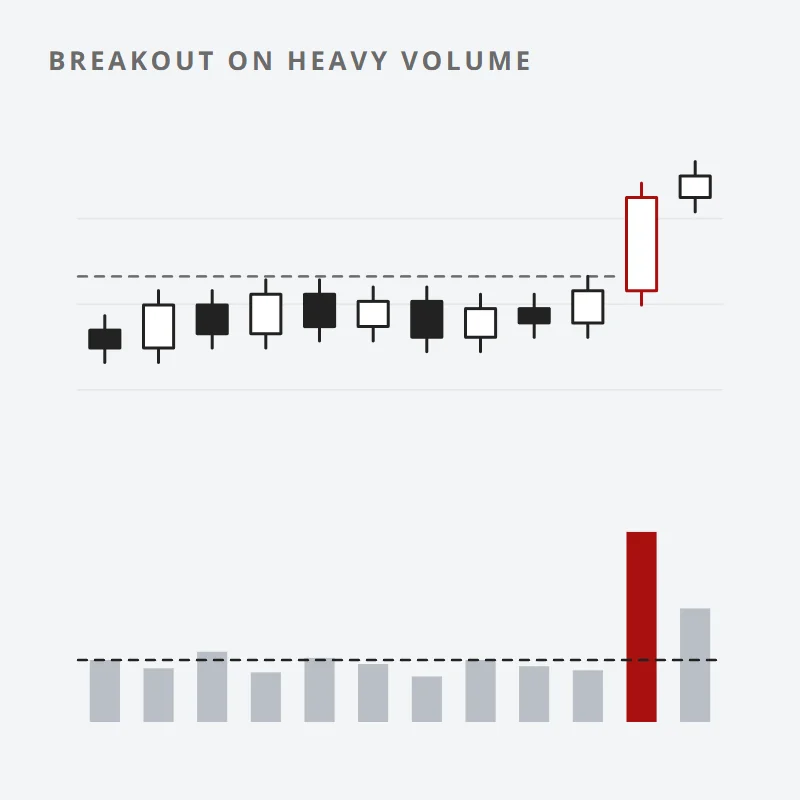
A breakout on 2 or 3 times the average volume has real money behind it. The same breakout on thin volume is much easier to reverse. Volume indicators turn that idea into a line you can read.
On-Balance Volume, or OBV, came from Joseph Granville in 1963. It adds the day's volume when price closes up and subtracts it when price closes down. If OBV climbs while price goes sideways, buyers may be quietly building positions before the move. The Accumulation/Distribution line and Chaikin Money Flow refine this by asking where in the day's range the close landed. VWAP, the volume-weighted average price, is the day trader's version: the average price paid today, weighted by size, which many institutions use to grade their own fills.
There are 2 cautions. Volume data is clean on exchanges, such as stocks and futures, and patchy in spot forex, where there is no central exchange and each broker sees only its own flow. And volume confirms far more often than it leads. Use it to check a move you have already spotted on price.
Further reading
Chapter 6 of 7
Market breadth measures how many stocks are actually taking part in a rally, and it works on a whole market, such as the NYSE or the S&P 500, rather than on a single stock.
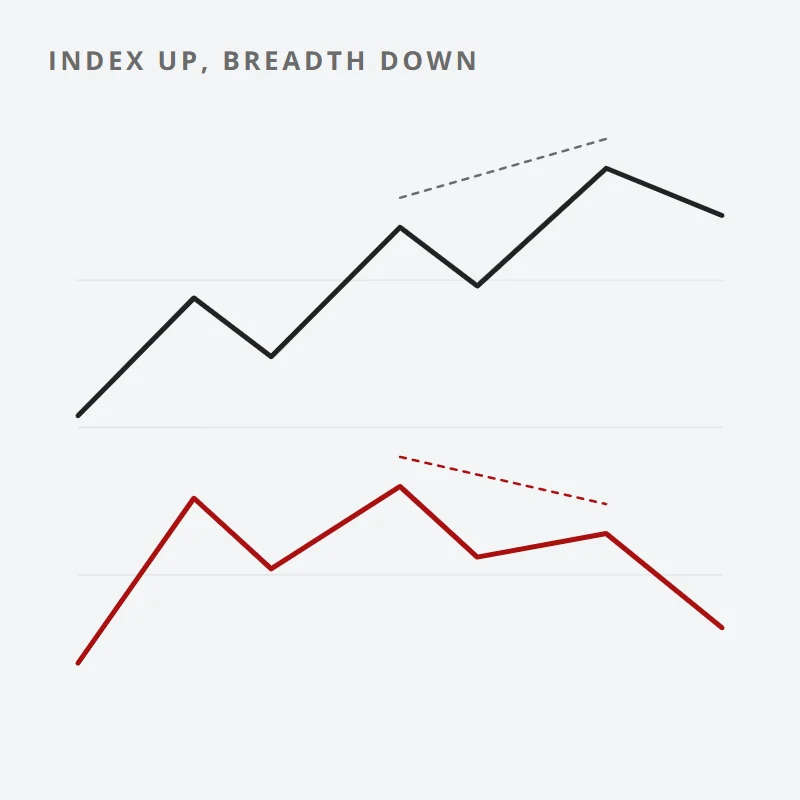
The Advance/Decline line keeps a running total of advancing stocks minus declining stocks each day. When an index makes a new high and the A/D line does not, the rally is being carried by fewer and fewer names, and that is a warning worth noticing. The McClellan Summation Index smooths the same data into a slower gauge of the market's trend. The Arms Index, also called TRIN, compares advancing and declining stocks with the volume behind each, and very high readings tend to show up during panic selling.
Breadth tools do not give entries. They tell you what kind of market you are trading in. If you trade individual stocks, that matters, because most stocks follow the broad market, and a strong chart in a weak market is swimming against the tide.
Further reading
Chapter 7 of 7
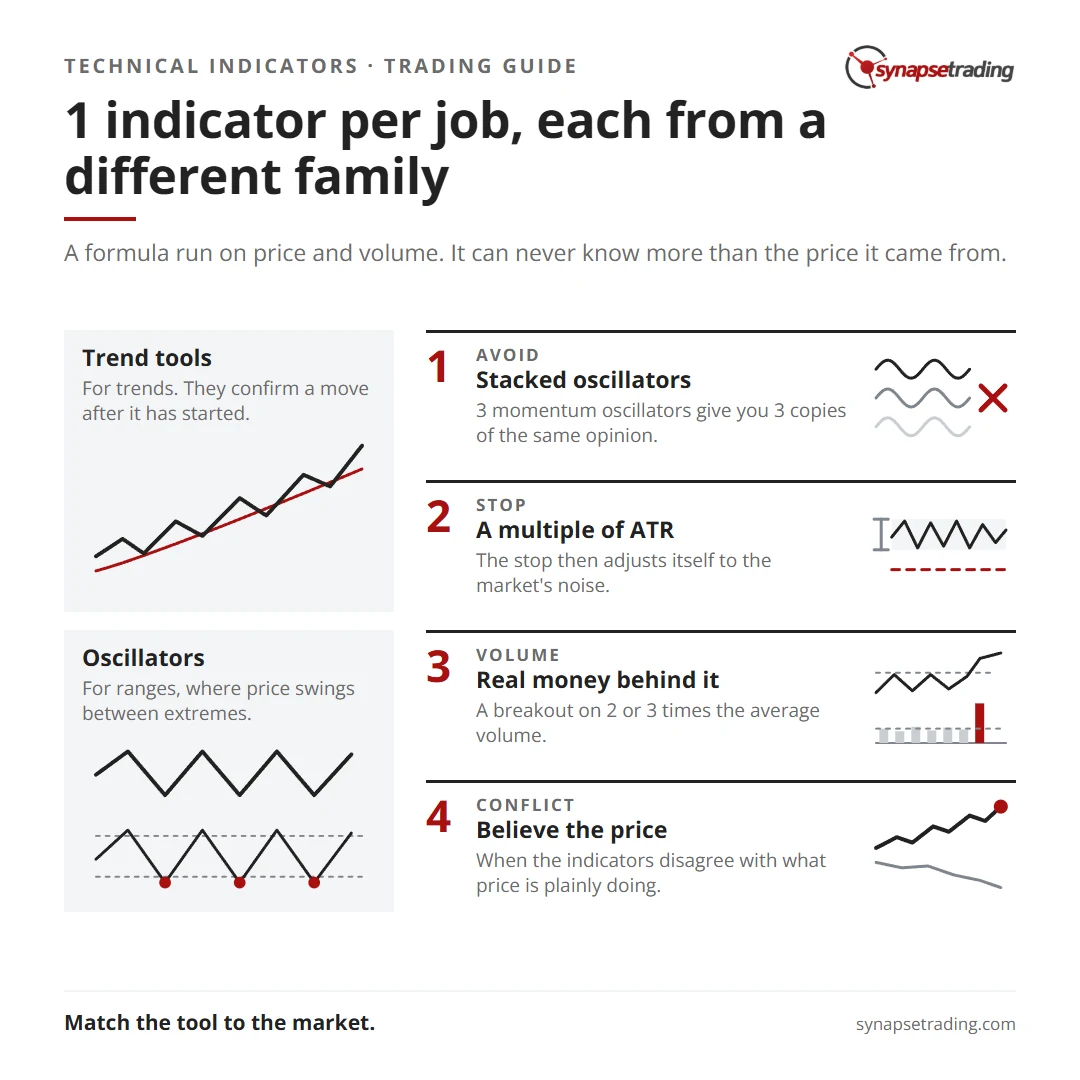
The way to combine indicators without drowning in them is a simple rule: 1 indicator per job, each from a different family.
Stacking 3 momentum oscillators gives you 3 copies of the same opinion. RSI, stochastics and CCI are all built from recent price change, so when one says overbought the others usually agree. The agreement feels like confirmation, and it is really an echo. A cleaner kit gives each tool its own question:
| The question | Family | One example |
|---|---|---|
| Which way is the market going? | Trend | 200-day moving average |
| Is the move stretched? | Momentum | 14-day RSI |
| How far does price normally move? | Volatility | 14-day ATR |
| Is real money behind the move? | Volume | OBV |
Use them for exits as well as entries. A stop set at a multiple of ATR adjusts itself to the market's noise. A trailing moving average or Parabolic SAR lets a winning trade run until the trend turns.
Last, know when to switch them off. Indicators fail most often in the regime they were not built for, trend tools in a range and oscillators in a strong trend. They also fail around big news, when price gaps straight past every line on the chart. When the indicators disagree with what price is plainly doing, believe the price.
Further reading
Quick answers
There is no single best one. A moving average is the easiest place to start, because it answers the most important question, which way the market is going. ATR is a good second, so your stops fit the market's normal range.
2 or 3 at most, each from a different family. More than that usually means several copies of the same signal and a trader waiting for an agreement that never comes.
They describe the past exactly and the future only in odds. Every indicator gives false signals, most often in the wrong market regime, so judge an indicator-based method over 100 to 200 trades, never over 1 or 2.
Some do, sparingly. Many read price first and keep 1 or 2 indicators for context, such as a long moving average for the trend and ATR for risk.
Next in the series: the Money and Risk Management guide, where stops turn into position sizes.
About the author
Spencer Li is The 15-Minute Trader and the founder of Synapse Trading. He is a Certified Financial Technician (CFTe) with 15+ years of trading, run from 70+ countries. He holds a B.Acc and B.BM from SMU. Every trade he takes is public, dated, losses left in. He teaches rules-based swing trading in 15 minutes a day, one system for any market.
Education, not financial advice. Synapse Trading is not licensed by MAS to advise on investment products. Trading carries risk of loss; past performance is not indicative of future results.
The free 15-Minute Swing Trader's Checklist turns this guide into a routine: find the setup, size the trade, log the result.
Free 5-page PDF, then occasional trading emails. Education only, not financial advice. Unsubscribe anytime. Kit stores your email in the US: see our privacy policy.