
• Link to Facebook
  • Link to X
  • Link to Instagram
  • Link to Youtube
  • Link to LinkedIn
  • Link to Mail
Free PDF: The 15-Minute Swing Trader's Checklist, the daily routine of a trader since 2007
Synapse Trading
  • Mentoring
    • Trading Mastery Program
    • All mentoring options
  • Signals
    • Daily trading signals
    • Signals trade log
  • Results
    • Student results and testimonials
    • Public trade log, losses left in
  • Free guides
    • Start here
    • Trading foundations
    • Technical analysis
    • Strategies and systems
    • Risk and money
    • Trading psychology
    • Markets and products
    • Free trading guides
    • Tools and resources
    • Blog
  • About
    • My background
    • My trading journey
    • Media and interviews
    • Travel log
  • Contact
    • Contact me
    • Partnerships
  • Start free
  • Click to open the search input field Click to open the search input field Search
  • Menu Menu
The Synapse Network

McClellan Summation Index Indicator
Technical Analysis & Price Action
The McClellan Summation Index - indicators
Home › Trading guides › Technical indicators guide

Want the daily routine? Get the free 15-Minute Swing Trader’s Checklist. Get it free →

The McClellan Summation Index is a long-term market breadth indicator developed by Sherman and Marian McClellan.

It is essentially a cumulative version of the McClellan Oscillator, designed to track intermediate to major market trends and reversals.

Understanding the McClellan Summation Index

This index helps traders and analysts assess bullish or bearish market sentiment and the strength of trends.

Unlike traditional price-based indices such as the S&P 500 or the Dow Jones Industrial Average, the McClellan Summation Index provides a unique perspective by quantifying market movements based on stock advances and declines.
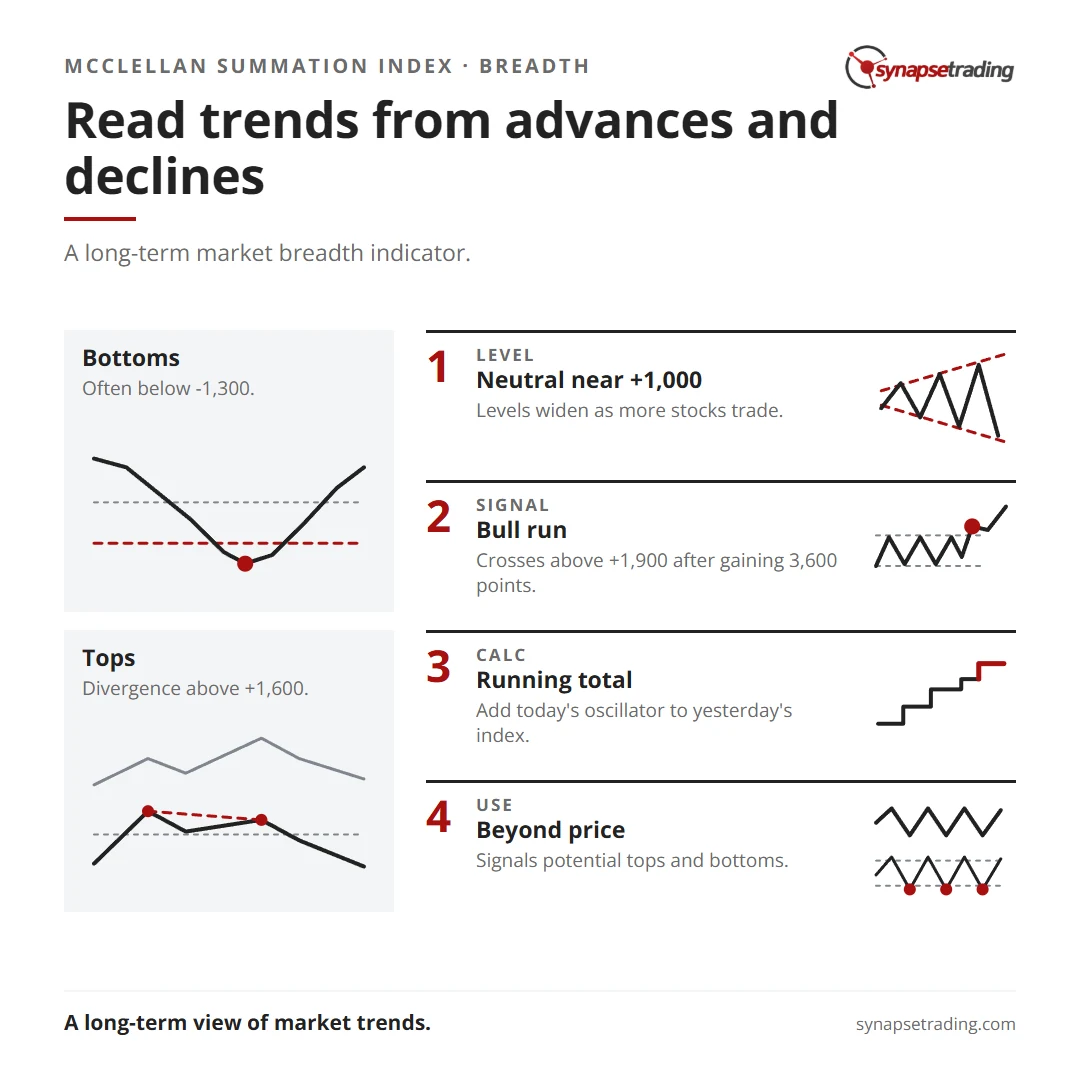
Read trends from advances and declines. Summary card for the post: McClellan Summation Index Indicator.

Key Levels and Interpretation

The McClellan Summation Index has a neutral reading around +1,000, but over time, the thresholds for overbought and oversold levels have expanded due to the increase in the number of stocks traded on exchanges like the NYSE.

Some basic rules of thumb for interpreting the index include:

  • Major market bottoms often occur below -1,300
  • Major tops are usually associated with divergence above +1,600
  • Large bull runs may be indicated when the index crosses above +1,900 after gaining 3,600 points from a prior low

Calculation of the McClellan Summation Index

The McClellan Summation Index is calculated by adding the current day’s McClellan Oscillator value to the previous day’s Summation Index value, making it a cumulative indicator of market movements.

This allows the index to reflect the ongoing impact of stock advances and declines over time, offering a long-term view of market trends.

Concluding Thoughts

The McClellan Summation Index is a powerful tool in technical analysis for identifying intermediate to major market trends.

Its ability to gauge market sentiment and signal potential tops and bottoms provides valuable insights for traders and investors seeking to navigate broad market movements beyond simple price-based analysis.


Want the daily routine? Enter your email for the free 15-Minute Swing Trader's Checklist.

Free 5-page PDF, then occasional trading emails. Education only, not financial advice. Unsubscribe anytime. Kit stores your email in the US: see our privacy policy.

Want to learn the full method? The Trading Mastery Program teaches the 4 strategies I have traded since 2011. It suits beginners and experienced traders.

Rather follow the trades as they happen? Daily Trading Signals is our Telegram channel: my trade ideas with entry, stop and exit, and every trade is public.

Questions about this post? Ask in the free Telegram channel →

Educational content only, not personalised financial advice. Trading carries risk, including loss of capital. Past performance is not indicative of future results. Synapse Trading is not licensed or regulated by MAS.

Part of the Technical indicators guide · all posts on Technical Analysis & Price Action

← Previous: What are Market Breadth Indicators & How do They Work?Next: Arms Index (TRIN) Indicator →

More from this guide

  • Advance/Decline (A/D) Line Indicator
  • What is Market Breadth?
  • Advance/Decline Ratio (ADR) Indicator
by The Synapse Network
Share this entry
  • Share on Facebook
  • Share on X
  • Share on WhatsApp
  • Share on Pinterest
  • Share on LinkedIn
  • Share on Tumblr
  • Share on Vk
  • Share on Reddit
  • Share by Mail
  • Visit us on Yelp
  • Link to Instagram
  • Link to Youtube
https://synapsetrading.com/wp-content/uploads/2026/10/mcclellan-summation-index-indicator-card.webp 630 1200 The Synapse Network https://synapsetrading.com/wp-content/uploads/2026/10/synapse-logo-horizontal-light.png The Synapse Network2023-09-20 00:45:542026-09-03 11:29:04McClellan Summation Index Indicator

Free checklist

The 15-Minute Swing Trader’s Checklist

The daily and weekly routine I use to find, manage and review trades in about 15 minutes a day, trading since 2007.

Get the free checklist

Topics

  • Trading foundations
  • Technical analysis
  • Strategies and systems
  • Risk and money
  • Trading psychology
  • Markets and products

Synapse Trading

Swing trading for busy professionals, in 15 minutes a day.

Start free

Learn

  • Start here
  • Free trading guides
  • Blog
  • Tools and resources

Programs

  • Trading Mastery Program
  • Daily trading signals
  • Student results
  • Public trade log

Company

  • About
  • Contact me
  • Partnerships
  • Disclaimer
  • Privacy policy
  • Terms & Conditions

Synapse Trading Pte Ltd
Registration No. 201316168H
WhatsApp +65-8897-1204
info@synapsetrading.com

Contact Us

Synapse Trading Pte Ltd
Registration No. 201316168H

Whatsapp: +65-8897-1204
Telegram: @iamrecneps
Email: info@synapsetrading.com

Links

Disclaimer
Privacy policy
Terms & Conditions
Contact us
Partnerships

© 2012-2026 Synapse Trading | All rights reserved. Educational content only, not personalised financial advice. Trading carries risk, including loss of capital. Past performance is not indicative of future results. Synapse Trading is not licensed or regulated by MAS.
  • Link to Facebook
  • Link to X
  • Link to Instagram
  • Link to Youtube
  • Link to LinkedIn
  • Link to Mail
Link to: What are Market Breadth Indicators & How do They Work? Link to: What are Market Breadth Indicators & How do They Work? What are Market Breadth Indicators & How do They Work?
How market breadth indicators work - indicators
Link to: Arms Index (TRIN) Indicator Link to: Arms Index (TRIN) Indicator
The Arms Index (TRIN) - indicators
Arms Index (TRIN) Indicator
Scroll to top Scroll to top Scroll to top