

What are Volume Indicators for Trading?
Want the daily routine? Get the free 15-Minute Swing Trader’s Checklist. Get it free →
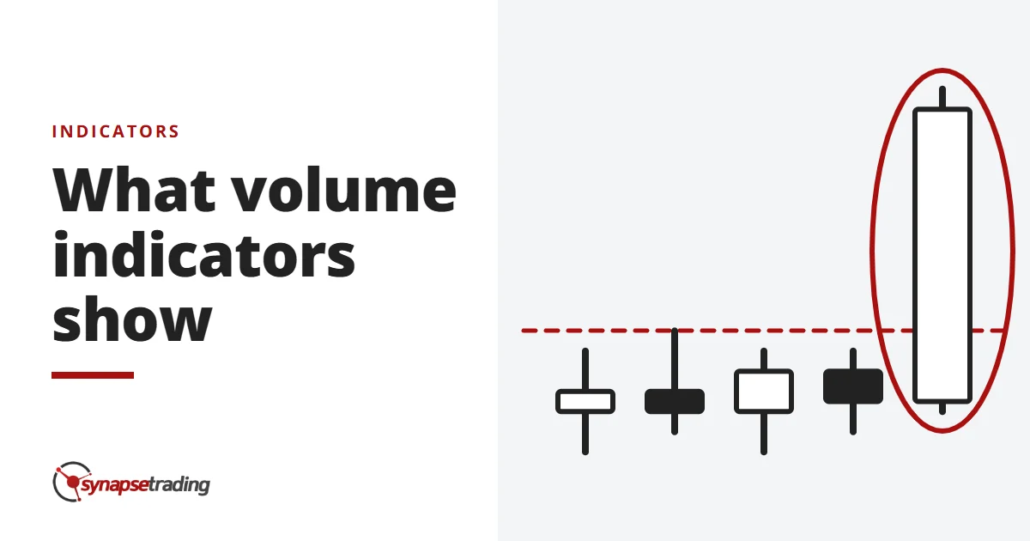
Volume refers to the total amount of a security or item that is traded over time, typically within a trading day.
For instance, the number of shares exchanged between a stock’s daily open and close is known as its trading volume.
Technical traders rely heavily on key information like trading volume and changes in volume over time to make informed decisions.
Importance of High Volume
High volume signals increased interest in the stock, indicating the active presence of buyers and sellers.
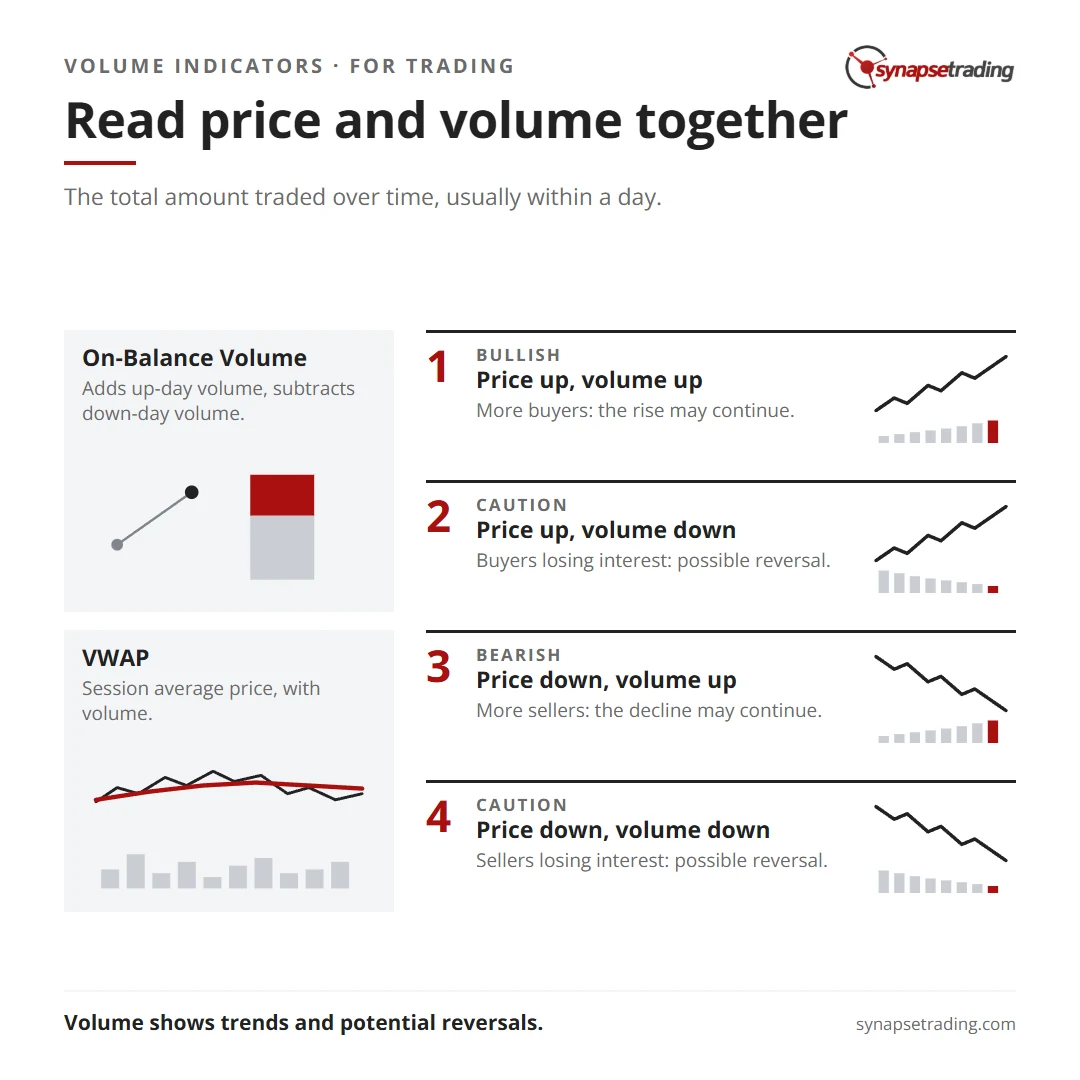
When a stock is in an uptrend and volume increases, this suggests that the stock will continue rising, as more buyers are interested in acquiring it.
Similarly, when a stock is in a downtrend and volume increases, it signals that the stock will continue declining, as more sellers are looking to offload it.
This behavior can be clearly seen in the daily chart of Reliance Ltd., where rising volumes lead to increasing stock prices.
Importance of Low Volume
Low volume indicates a lack of interest in the stock.
When a stock is moving up but volume decreases, it suggests that buyers are losing interest, potentially signaling a reversal of the uptrend.
Similarly, when a stock is declining and volume drops, it implies that sellers are losing interest, possibly indicating a reversal of the downtrend.
| Price | Volume | What is Expected |
|---|---|---|
| Up | Up | Bullish |
| Up | Down | Caution – weak hands buying |
| Down | Up | Bearish |
| Down | Down | Caution – weak hands selling |
Types of Volume Indicators
- On-Balance Volume (OBV): OBV is a cumulative indicator that sums up volume on up days and subtracts volume on down days. It helps gauge buying and selling pressure.
- Volume RSI: Similar to the Relative Strength Index (RSI), Volume RSI uses up-volume and down-volume to provide trading signals based on crossovers around the 50% center line.
- Volume Price Trend (VPT) Indicator: VPT assesses both price direction and the strength of price changes, helping traders confirm trends or detect divergences between price and volume.
- Money Flow Index (MFI): This indicator measures trading pressure using both price and volume, and is similar to RSI but volume-weighted.
- Chaikin Money Flow (CMF) Indicator: CMF evaluates market strength by measuring money flow volume over a period, typically 20 to 21 days, and can help confirm breakout directions.
- Accumulation/Distribution Line: This indicator tracks the cumulative flow of money into or out of a stock, helping identify divergences that signal future price movements.
- Ease of Movement (EMV): EMV measures how easily a stock price moves between levels based on volume trends, often used in volatile markets.
- Negative Volume Index (NVI): NVI focuses on days with declining volume, assuming that smart money is active on those days, and can indicate bull or bear markets.
- Volume-Weighted Average Price (VWAP): VWAP shows the average price of a security throughout a session, incorporating both price and volume, helping traders assess whether a security was bought or sold at a fair price.
Concluding Thoughts
Volume analysis is a critical aspect of technical trading, providing insight into market trends and potential reversals.
By using volume indicators like OBV, VWAP, and MFI, traders can enhance their ability to interpret price movements and refine their trading strategies.
Understanding the relationship between price and volume is essential for making informed decisions in the stock market.
Want the daily routine? Enter your email for the free 15-Minute Swing Trader's Checklist.
Free 5-page PDF, then occasional trading emails. Education only, not financial advice. Unsubscribe anytime. Kit stores your email in the US: see our privacy policy.
Want to learn the full method? The Trading Mastery Program teaches the 4 strategies I have traded since 2011. It suits beginners and experienced traders.
Rather follow the trades as they happen? Daily Trading Signals is our Telegram channel: my trade ideas with entry, stop and exit, and every trade is public.
Questions about this post? Ask in the free Telegram channel →
Educational content only, not personalised financial advice. Trading carries risk, including loss of capital. Past performance is not indicative of future results. Synapse Trading is not licensed or regulated by MAS.

