

Volume-Weighted Average Price (VWAP)
Want the daily routine? Get the free 15-Minute Swing Trader’s Checklist. Get it free →
The volume-weighted average price (VWAP) is a technical analysis indicator used on intraday charts that resets at the start of each new trading session.
It represents the average price at which a security has traded throughout the day, taking into account both price and volume.
VWAP is important because it provides traders with insight into both the price trend and the value of a security.
Understanding the Volume-Weighted Average Price (VWAP)
VWAP is calculated by summing the dollars traded for each transaction (price multiplied by volume) and then dividing that by the total shares traded.
Formula
The formula for VWAP is:
VWAP = (Cumulative Typical Price × Volume) / Cumulative Volume
Where:
- Typical Price = (High Price + Low Price + Closing Price) / 3
- Cumulative = Total trades since the trading session opened
How to Calculate VWAP
Although adding the VWAP indicator to a streaming chart automates the calculation, here’s how to calculate it manually.
- Determine the average price the stock traded at during the first five-minute period of the day. Add the high, low, and close, then divide by three. Multiply this by the volume for that period, and record the result in a spreadsheet under “PV” (price and volume).
- Divide PV by the volume for that period to get VWAP.
- Continue adding the PV value from each period to the prior values and divide the total by the total volume up to that point to maintain the VWAP throughout the day.
How Is VWAP Used?
Traders use VWAP in various ways.
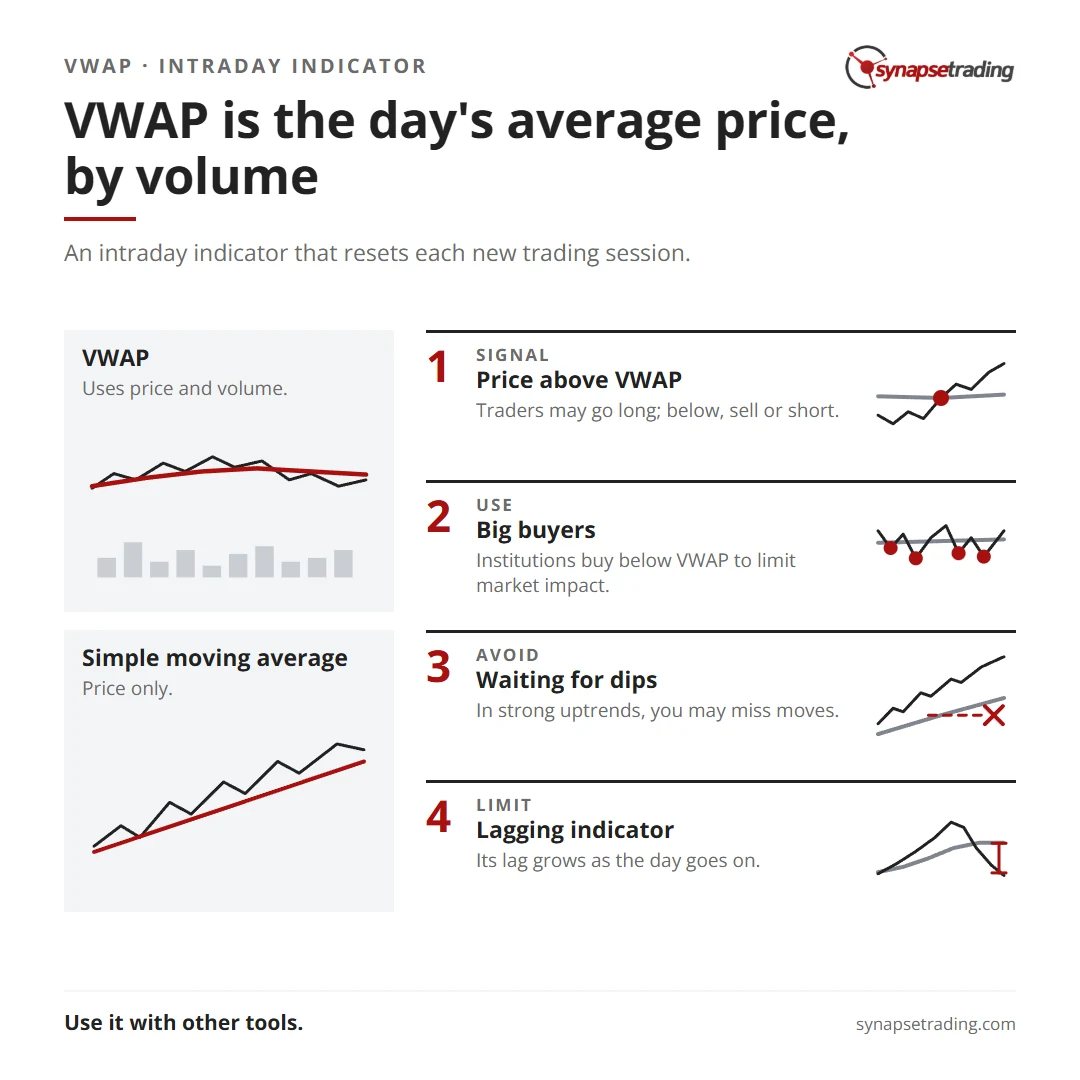
They may treat it as a trend confirmation tool, considering prices below VWAP as undervalued and prices above it as overvalued.
For instance, if a stock price moves above VWAP, traders may go long on the stock, and if it moves below, they may sell or go short.
Institutional buyers also use VWAP to minimize market impact by trying to buy below VWAP or sell above it, ensuring their actions don’t artificially move the stock price.
VWAP vs. Simple Moving Average
VWAP and simple moving average (SMA) may look alike on a chart, but they differ in calculation.
VWAP incorporates both price and volume, while SMA only incorporates price.
The SMA is calculated by averaging the closing prices over a specific period, while VWAP accounts for volume-weighted prices.
Limitations of VWAP
- VWAP is a single-day indicator that resets each day, making it difficult to use over extended periods.
- While useful, VWAP should not be the only factor considered, as in strong uptrends, waiting for prices to fall below VWAP could result in missed opportunities.
- VWAP is based on historical values, making it a lagging indicator with increasing lag as the day progresses.
What Does VWAP Tell You?
VWAP helps traders gauge liquidity and the price at which buyers and sellers agree.
It offers insight into price movement throughout the day and can guide trading decisions.
Why Is the Volume-Weighted Average Price Important?
VWAP provides a smoothed view of a security’s price, adjusted for volume, helping institutional traders execute orders without significantly affecting the stock’s price.
For example, a hedge fund may avoid buying above VWAP to prevent inflating the price or selling below VWAP to avoid dragging down the price.
Is VWAP a Leading Indicator?
No, VWAP is a lagging indicator since it uses historical data.
It is valuable for specific uses, but it does not offer real-time insights for traders seeking up-to-the-minute data.
Concluding Thoughts
VWAP is a valuable tool in technical analysis for determining the average price of a security during a single trading session.
While useful for tracking intraday price trends and liquidity, it is a lagging indicator best utilized in conjunction with other tools for more comprehensive market analysis.
Want the daily routine? Enter your email for the free 15-Minute Swing Trader's Checklist.
Free 5-page PDF, then occasional trading emails. Education only, not financial advice. Unsubscribe anytime. Kit stores your email in the US: see our privacy policy.
Want to learn the full method? The Trading Mastery Program teaches the 4 strategies I have traded since 2011. It suits beginners and experienced traders.
Rather follow the trades as they happen? Daily Trading Signals is our Telegram channel: my trade ideas with entry, stop and exit, and every trade is public.
Questions about this post? Ask in the free Telegram channel →
Educational content only, not personalised financial advice. Trading carries risk, including loss of capital. Past performance is not indicative of future results. Synapse Trading is not licensed or regulated by MAS.

