

Chaikin Oscillator vs Chaikin Money Flow (CMF): How to Read Buying Pressure From Volume
Want the daily routine? Get the free 15-Minute Swing Trader’s Checklist. Get it free →
By Spencer Li, CFTe · Last updated: 26 October 2026
The Chaikin Oscillator and Chaikin Money Flow (CMF) are two volume indicators that Marc Chaikin built from the same raw ingredient, a daily score of where the price closed inside its high-low range, multiplied by that day’s volume. Chaikin Money Flow adds that score up over a window of usually 20 or 21 days and divides it by the volume traded, so it tells you whether buyers or sellers have had the upper hand lately. The Chaikin Oscillator takes the running total of the same scores and subtracts its 10-day exponential moving average from its 3-day one, so it tells you whether that pressure is speeding up or slowing down.
So CMF reads the level of buying pressure, and the oscillator reads its momentum. Both come from one set of numbers, which is why plotting the pair together is less useful than it looks.
Where do both indicators come from?
Marc Chaikin’s best-known volume line started life under another name. According to StockCharts’ ChartSchool, he first called it the Cumulative Money Flow Line, and today it goes by the Accumulation/Distribution Line, or ADL. He sits in Bollinger Bands’ family tree too. John Bollinger credits the Bomar Bands, built by Chaikin and Bob Brogan, as the first fully adaptive trading bands.
The ADL begins with one question asked of every bar. Where did the price close, compared with the bar’s high and low? The answer is called the Money Flow Multiplier.
Money Flow Multiplier = [(Close − Low) − (High − Close)] ÷ (High − Low)
Say a stock trades between 100 and 110 today and closes at 108. That gives (8 − 2) ÷ 10, which is +0.6. Now say it closes at 102 instead. That gives (2 − 8) ÷ 10, which is −0.6.
Same range, same volume, and the score flips sign only because of who held the price at the bell.
The multiplier then gets multiplied by volume. With 1 million shares traded, the close at 108 adds 600,000 shares of “money flow volume” to the running total, and the close at 102 takes 600,000 away. A close right on the high counts all of the day’s volume as buying, a close on the low counts all of it as selling, and a close near the middle counts almost none of it. Keep adding those daily numbers and you get the ADL, and both Chaikin indicators are two different ways of reading that one line.
Why can the ADL rise on a day the stock fell?
On 9 June 2023, a trader on Reddit’s r/technicalanalysis described a stock that had been falling for 2 years while “the Accumulation/Distribution indicator is on a steady rise”, and asked whether that was a bullish divergence. It might be. It might also be the oddest quirk in Chaikin’s formula.
Imagine a stock that gaps down 5% at the open on bad news, then spends the day clawing back, and closes near the top of the day’s range but still well below yesterday’s close. Anyone who held it overnight lost money. The ADL goes up anyway.
That sounds like a bug, and it is really a design choice. Chaikin’s formula ignores the change from one day to the next and looks only at where the close sits inside today’s range. StockCharts shows it on a Clorox chart, with a big gap down, a close near the day’s high, and the ADL rising.
Joe Granville’s older On Balance Volume works the other way round. It adds the whole day’s volume when the close is up on the day and subtracts it when the close is down, so it sees the gap and ignores the fight inside the day.
Neither one is wrong, since they measure different things. The risk is reading a rising ADL as “buyers are in control” on a stock that keeps gapping lower, which is how a 2-year downtrend can carry a steadily rising A/D line. The opposite trap exists too, where a stock gaps up, closes near its low, and almost all of the day’s volume counts as selling. So before calling a divergence real, it is worth scrolling back to check whether the gaps are doing the work.
What does Chaikin Money Flow tell you?
Chaikin Money Flow asks a smaller question than the ADL. It forgets the running total since the chart began and looks only at the recent window, usually the last 20 days.
CMF = 20 days of money flow volume, added up ÷ 20 days of volume, added up
The result moves between −1 and +1. To reach +1, a stock would need to close on its high 20 days in a row, so in practice it almost never does, and StockCharts notes it usually sits between −0.5 and +0.5. Above zero means buying pressure has had the edge over the window. Below zero means selling pressure has.
There is a quiet bit of algebra in that formula. The top half, 20 days of money flow volume added together, is exactly how far the ADL has moved over those 20 days. So CMF is really the ADL’s 20-day change, scaled by how much volume traded, which makes it the same line seen through a fixed window.
CMF’s weakness is chop. Because it hovers around zero, it crosses zero often in a trendless market. On one Freeport-McMoRan chart, StockCharts counted at least 10 zero-line crosses between February and December 2010, and a small buffer either side of zero cut that to 3 signals, each arriving later. It also inherits the ADL’s gap problem, since it is built from the same multiplier.
If you want a daily routine that keeps indicator watching to a few minutes, my free 15-minute swing trader checklist is the one I use myself.
How does the Chaikin Oscillator work?
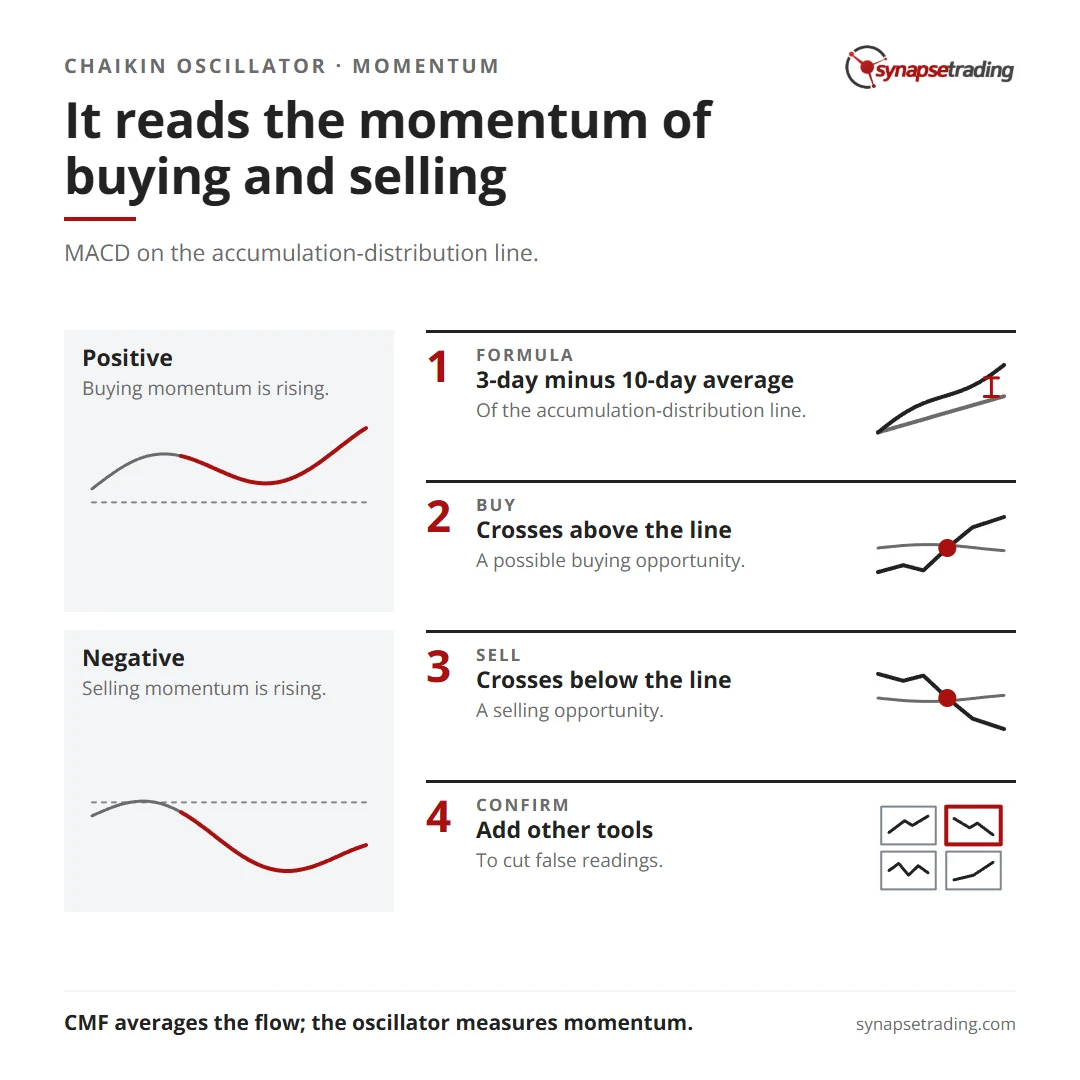
The Chaikin Oscillator is what you get when you take the MACD formula, which normally runs on closing prices, and run it on the ADL instead.
Chaikin Oscillator = 3-day EMA of the ADL − 10-day EMA of the ADL
An EMA, or exponential moving average, is an average that gives more weight to recent days. When the fast 3-day average of the ADL climbs above the slow 10-day average, the oscillator turns positive, which says buying pressure is picking up. When it drops below, the oscillator turns negative.
There are two readings worth knowing.
- The zero line. Above zero, the ADL has upward momentum. Below zero, it has downward momentum.
- Divergence. A bullish divergence forms when price makes a lower low and the oscillator makes a higher low, which shows less selling pressure behind the new low. A bearish divergence is the mirror image, a new high in price that the oscillator fails to confirm.
That second definition gets garbled a lot, and an older version of this page had it wrong too. A divergence always compares the indicator with price. It has nothing to do with the oscillator crossing the ADL.
Do note that StockCharts calls the oscillator “an indicator of an indicator”. Price and volume become the ADL, the ADL gets two moving averages, and the gap between them becomes the oscillator, three steps away from the price you actually trade. The further an indicator sits from price, the more often the two disagree.
Why does the oscillator turn before CMF does?
Think about the dashboard of a car. The odometer shows the total distance the car has ever driven, and the speedometer shows how fast that total is changing right now. In physics, speed is the rate of change of distance, and that same relationship ties the three Chaikin lines together.
The ADL is the odometer, a running total that only means something by how it changes. CMF is the average speed over the last 20 days, adjusted for how much volume traded. The Chaikin Oscillator behaves like a speedometer with a much shorter memory.
You can see why with a little arithmetic. If the ADL climbs at a steady pace, a 3-day EMA trails it by about 1 day and a 10-day EMA by about 4.5 days. So the gap between them settles at roughly 3.5 days’ worth of that pace. Change the pace and the gap changes within days, well before a 20-day window has caught up.
Engineers who build sensors live with the same trade-off. Smooth a reading heavily and it turns late. Smooth it lightly and it twitches at every bump in the road. The oscillator is the twitchy gauge and CMF is the slow one, and no setting gets you out of that trade.
Should you use the Chaikin Oscillator and CMF together?
John Bollinger has a rule for this in Bollinger on Bollinger Bands. He warns against using two indicators from the same category, because they “sing the same song”, and he picks one indicator for each job instead, such as one for momentum, one for trend and one for volume.
By that rule, the Chaikin Oscillator and CMF are one vote counted twice. Both come from the same multiplier, on the same volume, with the same blind spot for gaps. When they agree, it feels like confirmation, and it is really one witness telling the same story twice. StockCharts reaches a similar place from another angle and suggests pairing a money flow tool with a pure price oscillator such as MACD or RSI.
So the practical choice is one or the other. CMF suits a trader who wants the state of the pressure over the past month, and the oscillator suits one who wants an early hint that the pressure is changing and can live with more false starts.
Do note that neither is accurate on its own, and the people who teach them say so. On an Alcoa chart from 2010, the oscillator crossed zero 6 times, and StockCharts wrote that the first five “did not generate good signals, but the sixth was a dandy”. One good signal out of 6 is a fair picture of a single indicator in a choppy year.
How do I read volume on my own charts?
In my weekly outlook on 7 May 2026, I talked through a position in IGV, the US software ETF, a rebound play rather than my usual buy near the highs. I pointed at a burst of heavy volume that “kind of suggests there might be some accumulation”, and at an RSI divergence for the viewers who like indicators. Then I said that the price action told the same story on its own, a false break to the downside that quickly recovered.
A week later I came back to it. What I always teach in the course, I said, is that “when we see a huge volume … it kind of signals a potential turning point”, and I added that only time would tell whether it would break up.
That read uses the same raw material as both Chaikin indicators, heavy volume and where the price closed after a false break, read straight off the bars instead of through layers of averages. The broader rule in my playbook works the same way. In a healthy trend, volume tends to dry up as the price pulls back and pick up again as the trend resumes, and a breakout on thin volume is the classic fakeout. My post on the best indicators for swing trading gives each tool a single job.
Reading volume is a habit, and habits are easier to keep with a routine. The free 15-minute swing trader checklist is the one I run every day.
FAQ
What is the difference between the Chaikin Oscillator and Chaikin Money Flow?
Chaikin Money Flow adds up money flow volume over a set window, usually 20 days, and divides it by total volume, so it reads the level of buying or selling pressure. The Chaikin Oscillator applies the MACD formula to the Accumulation/Distribution Line, so it reads whether that pressure is speeding up or slowing down.
What are the default settings?
The Chaikin Oscillator is the 3-day EMA of the Accumulation/Distribution Line minus its 10-day EMA. Chaikin Money Flow uses 20 or 21 days. Longer settings make both smoother and slower.
What does a negative Chaikin Money Flow mean?
Over the window, more volume traded on closes in the lower half of the day’s range than in the upper half, so selling pressure has had the edge. It reads the close inside the day’s range, so a stock can gap up and still post negative money flow.
Is the Chaikin Oscillator the same as MACD?
It uses the same method, the gap between a fast and a slow moving average. MACD runs it on closing prices, and the Chaikin Oscillator runs it on the volume-based Accumulation/Distribution Line.
What is a Chaikin Oscillator divergence?
A bullish divergence is a lower low in price with a higher low in the oscillator. A bearish divergence is a higher high in price that the oscillator fails to match. Both compare the indicator with price.
Have you ever had a volume indicator flash “accumulation” on a stock that kept falling, and did a gap turn out to be the reason? Let me know in the comments.
For the whole family of tools these two belong to, read my Definitive Guide to Technical Indicators. Bollinger’s thinking on bands and volume is in my summary of Bollinger on Bollinger Bands, and the rest sits in my free trading guides.
And if you want a routine that reads the market in 15 minutes a day without a stack of indicators, grab the free 15-minute swing trader checklist.
About the author. Spencer Li is The 15-Minute Trader and the founder of Synapse Trading. He is a Certified Financial Technician (CFTe) with 15+ years of trading, run from 70+ countries. He holds a B.Acc and B.BM from SMU. Every trade he takes is public, dated, losses left in. He teaches rules-based swing trading in 15 minutes a day, one system for any market.
Education, not financial advice. Synapse Trading is not licensed by MAS to advise on investment products. Trading carries risk of loss, and past performance is not indicative of future results.
Want the daily routine? Enter your email for the free 15-Minute Swing Trader's Checklist.
Free 5-page PDF, then occasional trading emails. Education only, not financial advice. Unsubscribe anytime. Kit stores your email in the US: see our privacy policy.
Want to learn the full method? The Trading Mastery Program teaches the 4 strategies I have traded since 2011. It suits beginners and experienced traders.
Rather follow the trades as they happen? Daily Trading Signals is our Telegram channel: my trade ideas with entry, stop and exit, and every trade is public.
Questions about this post? Ask in the free Telegram channel →
Educational content only, not personalised financial advice. Trading carries risk, including loss of capital. Past performance is not indicative of future results. Synapse Trading is not licensed or regulated by MAS.

