

On-Balance Volume (OBV) Indicator
Join our Telegram channel for more market analysis & trading tips: t.me/synapsetrading
On-balance volume (OBV) is a technical trading momentum indicator that uses volume flow to predict changes in stock price.
It was developed by Joseph Granville and introduced in his 1963 book Granville’s New Key to Stock Market Profits.
Granville believed that volume was the key force behind markets and designed OBV to predict major moves based on volume changes.
He described OBV as akin to “a spring being wound tightly,” where a sharp increase in volume without a significant price change would eventually lead to a price jump upward or downward.
Formula for On-Balance Volume (OBV)
The formula for OBV is:
OBV = Previous OBV + {volume, if the close is higher than the previous close, if the close is the same as the previous close −volume, if the close is lower than the previous close}
Where:
- OBV is the current on-balance volume level.
- Previous OBV is the OBV from the prior day.
- Volume is the latest trading volume amount.
Calculating On-Balance Volume
OBV provides a running total of an asset’s trading volume, indicating whether the volume is flowing in or out of the security.
There are three rules for calculating OBV:
- If today’s closing price is higher than yesterday’s, the current OBV = Previous OBV + today’s volume.
- If today’s closing price is lower than yesterday’s, the current OBV = Previous OBV – today’s volume.
- If today’s closing price is equal to yesterday’s, the current OBV = Previous OBV.
What Does OBV Tell You?
OBV is based on the distinction between institutional investors (“smart money”) and less sophisticated retail investors.
When institutions start buying an asset, volume may increase even if the price remains stable.
Eventually, volume pushes the price upward as larger investors sell and smaller investors buy.
The OBV indicator itself is cumulative, and traders focus on its movement over time rather than its numerical value.
The slope of the OBV line is key for analysis, tracking volume numbers to signal potential opportunities for buying or selling.
Example of How to Use OBV
Consider a stock with 10 days of closing prices and volumes:
- Day 1: Price = $10, Volume = 25,200 shares
- Day 2: Price = $10.15, Volume = 30,000 shares
- Day 3: Price = $10.17, Volume = 25,600 shares
On days where prices rise, volumes are added to the OBV, and on down days, volumes are subtracted.
The OBV values over the 10 days would be as follows:
- Day 1 OBV = 0
- Day 2 OBV = 30,000
- Day 3 OBV = 55,600
OBV vs. Accumulation/Distribution
While OBV and the accumulation/distribution (Acc/Dist) line are both volume-based indicators, they differ in their calculation.
OBV adds or subtracts volume based on whether the price closed higher or lower.
Acc/Dist uses the position of the current price relative to its recent trading range, multiplied by the volume.
Limitations of OBV
- OBV is a leading indicator and can produce false signals due to its predictive nature.
- A large spike in volume on a single day (e.g., due to a surprise earnings announcement) can throw off the OBV for a long period.
- To reduce the likelihood of false signals, OBV is often used with lagging indicators such as moving averages.
Concluding Thoughts
On-balance volume (OBV) is a valuable technical indicator that measures volume flow to predict price direction.
While it offers insights into market sentiment and potential price movements, OBV should be used in conjunction with other indicators to confirm its signals and avoid false interpretations.
Balancing OBV with lagging indicators can provide a more comprehensive view for making informed trading decisions.
Want the daily routine? Enter your email for the free 15-Minute Swing Trader's Checklist.
Free, 5 pages, PDF. You get the checklist, then my occasional trading emails. Education only, not financial advice. Unsubscribe anytime.
Where your details go: Kit, our email provider, stores your email address in the United States. Our contract with Kit lets it use your address only to send our emails, and requires Kit to keep it secure. The United States has no national privacy law like Singapore's, so that contract is the main protection. More in our privacy policy.
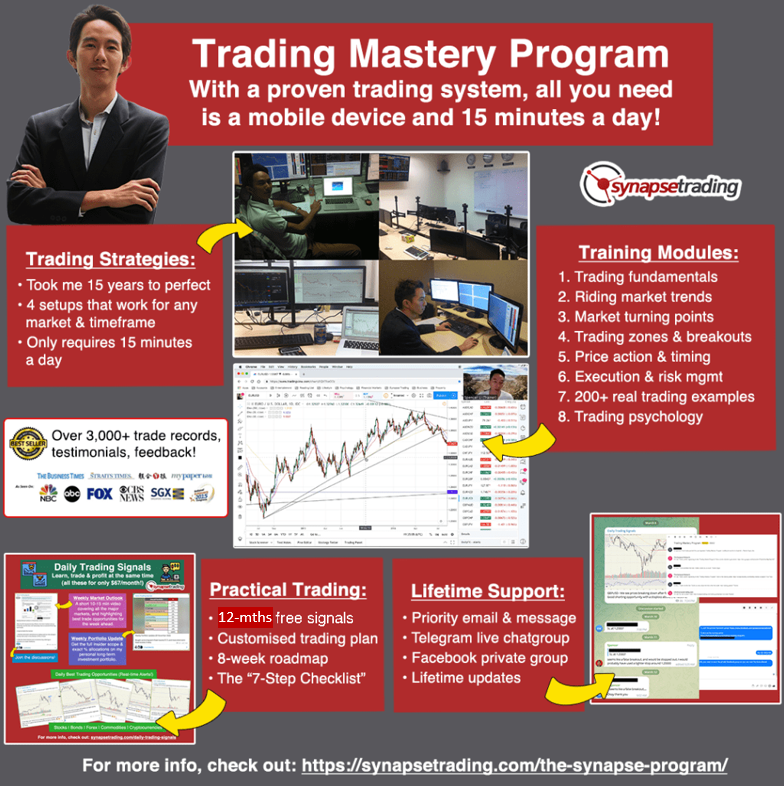 Our flagship mentoring program is suitable for both beginners and advanced traders, covering the 4 strategies which I used over the past 15 years to build up my 7-figure personal trading portfolio.
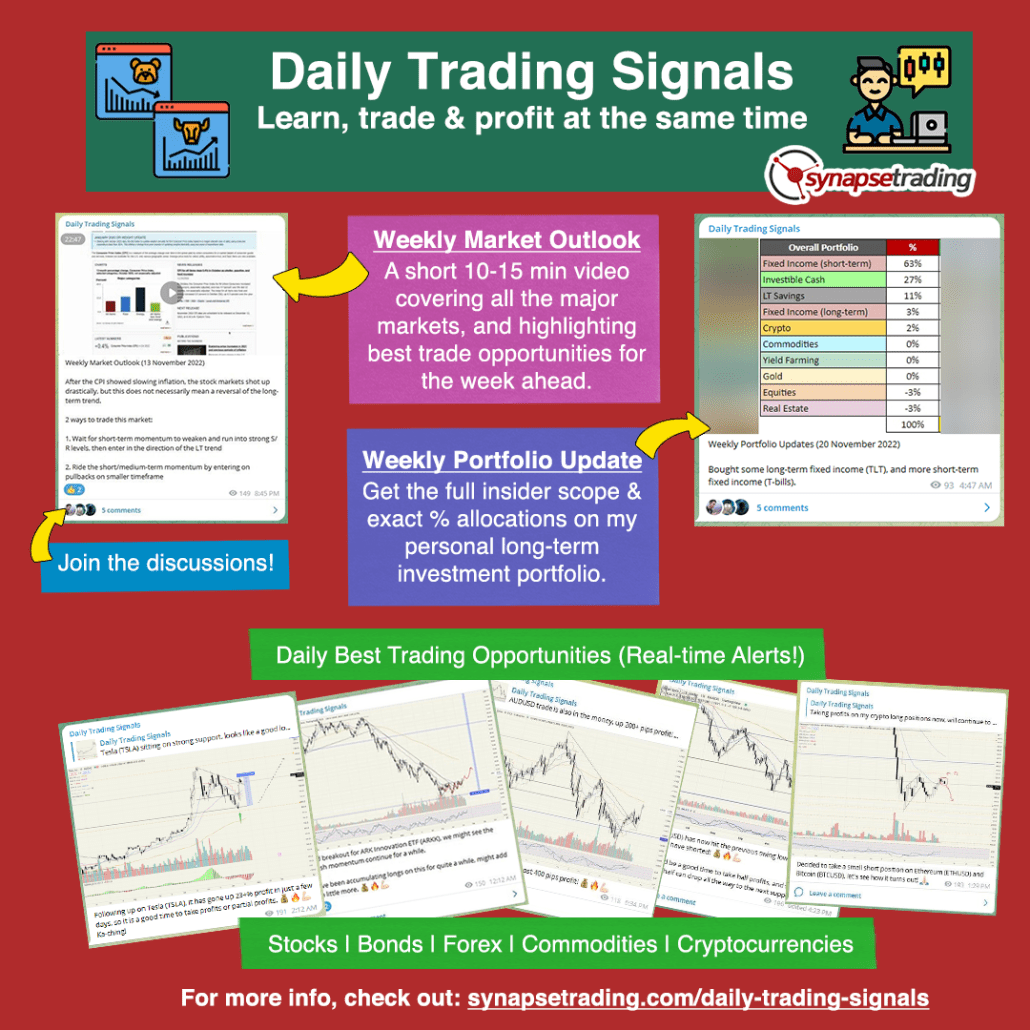 If you're looking for the best trading opportunities every day across various markets, and don't want to spend hours doing the research yourself, check out our private Telegram channel!

Leave a Reply
Want to join the discussion?Feel free to contribute!