

The 3 Types of Technical Analysis, and How to Combine Them on One Clean Chart
Want the daily routine? Get the free 15-Minute Swing Trader’s Checklist. Get it free →
By Spencer Li, CFTe · Last updated: 26 October 2026
There are three main types of technical analysis, and almost every trader uses some mix of all three: classical charting, technical indicators and price action. Classical charting reads the chart by eye, with support and resistance, trendlines, channels and price patterns. Technical indicators run formulas on the open, high, low, close and volume to show what the eye can miss, such as moving averages, the MACD and the RSI. Price action studies the movement of price itself, bar by bar, along with the reasons behind each move. They are not rivals, so the useful question is which small combination of them finds good trades with the least effort.
I first wrote about these three on this blog in 2021, as a short note before a series of longer guides. This is the longer version, with the history, the honest limits, and how I put the three together on my own charts.
What are the three types of technical analysis?
Every tool a trader puts on a chart falls into one of three buckets, and they arrived in roughly this order, each one layered on top of the one before.
| Type | What it is | Common tools | What it answers |
|---|---|---|---|
| Classical charting | Reading the chart by eye | Swing counts, support and resistance, trendlines, channels, price patterns | Where is the structure? |
| Technical indicators | Formulas run on price and volume | Moving averages, MACD, RSI, Stochastics, Bollinger Bands | Is the move backed up? |
| Price action | Reading the bars and the reasons behind them | Candlestick patterns, single-bar reading, order flow | Is now the time to act? |
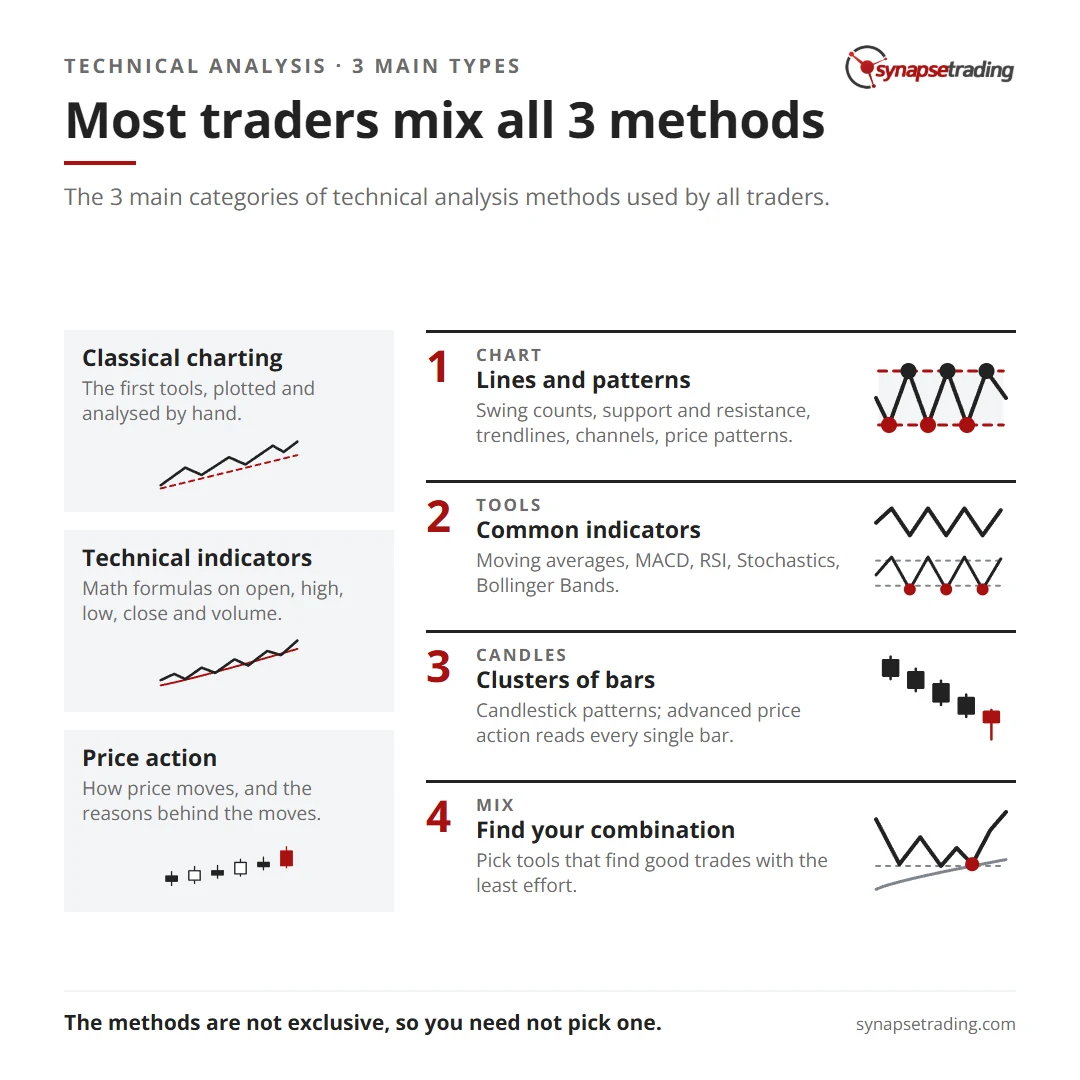
Most traders blend all three without thinking about it. You might use charting to find a level, an indicator to check the trend, and the bars at that level to decide whether anything is happening yet. That is normal. The trouble starts with the opposite habit, which is stacking ten indicators that all measure the same thing and calling the result confirmation.
Why did classical charting come first?
Charles Dow, who gave his name to the Dow Jones index, never wrote his famous theory down, and he never named it either. Someone else named it “Dow’s theory” in 1902, the year Dow died, and it took another 30 years and a bedridden writer called Robert Rhea, sitting with 35 years of data, to set it out properly in 1932.
That tells you how charting started. There were no computers, so every chart was plotted by hand and read by eye, and the rules were passed around as observations long before anyone tested them. In 1948, Robert Edwards and John Magee published Technical Analysis of Stock Trends, which named and defined most of the chart formations traders still draw today, such as the head and shoulders, the triangle, the rectangle and the flag.
So classical charting covers swing counts, support and resistance, trendlines, channels and price patterns. It is the structure you can see on a bare chart, with nothing added.
Do note that old does not mean outdated. Most traders still lean on these methods today, usually alongside the other two, because a clean level or a well-drawn trendline often tells you more than any formula. If you only ever learned one of the three, I would start you here, because it teaches you to see structure, and the other two make much more sense once you can. The patterns themselves are in my guide to trading price chart patterns.
What does a technical indicator actually add?
Here is an odd fact about indicators. None of them knows anything the price chart does not already know.
When computers arrived, traders started running formulas on the open, high, low, close and volume, and that added a layer of analysis that is not always obvious by eye. J. Welles Wilder published the Relative Strength Index, the RSI, in his 1978 book New Concepts in Technical Trading Systems and recommended a 14-day setting. Today there are thousands of indicators, and the common ones are moving averages, the MACD, the RSI, Stochastics and Bollinger Bands.
But every one of them is cooked from the same few ingredients. Information theory has a name for this, the data processing inequality, which says that no amount of processing can add information that the raw data did not already carry. An indicator can only rearrange what the price bars already contain.
So why use them at all? Think of the “feels like” temperature on your weather app. It is worked out from the same temperature, humidity and wind the app already shows you, so it adds no new facts, and yet it is the number you actually decide on when you pick what to wear. An indicator does the same job for a chart. It turns raw bars into a number you can read in a second.
The price of that convenience is lag. John Murphy, in his textbook on technical analysis, describes the moving average as a smoothing device with a time lag, and that applies to most of the family. Because indicators are built from past prices, they tend to confirm a move after it has started, which makes them better at telling you a trend exists than at telling you where it begins. Hence, two or three indicators that measure different things, say one for trend and one for momentum, will serve you better than a screen full of them that all repeat the same reading. A swing trader needs far fewer than the full menu, and the short list is in the best indicators for swing trading.
If you would rather run a short routine than read every indicator on every chart, my free 15-minute swing trader checklist is the daily routine I use myself.
What is price action trading?
Price action is a broad category, but the idea underneath is simple. You study the movement of price while trying to understand the reasons behind each move, which mostly comes down to watching fear and greed fight it out one bar at a time.
In the past, one such method was tape-reading, which has since evolved into reading the price ladder and order flow. These are mostly for intraday traders on very short timeframes. I used to do that when I was trading for funds, and it is intense work, staring at every order as it arrives, which is overkill for most people who trade around a day job.
For retail traders, the more common approach is to study candlestick patterns, which means spotting unique clusters of bars. Steve Nison brought Japanese candlestick charting to Western traders with his 1991 book, and he traces at least one of them, the rising three methods, back to the 1700s. One of his warnings has stayed with me. He says a “reversal pattern” is a misleading name, because it only tells you the trend is likely to change. He compares it to the brake lights coming on in the car ahead, which may stop, or may carry on.
More advanced price action goes further and reads every single bar. A long lower wick, for example, tells you sellers pushed the price down during the session and buyers pushed it back up before the close, which hints at who is in control now. If you want the patterns themselves, my guide to candlestick patterns covers them.
How do the three types fit together on one chart?
In my weekly outlook on 8 November 2025, I went through gold, and the read used all three types in the space of a few sentences.
I said I had first thought gold might form a small double bottom and break out, which is classical charting. Then I pointed out that “it’s struggling to cross above” the 10 and 20 moving averages and staying below them, which is the indicator layer. And then I added a price action point that holds for almost any market. After one very large move, “it is quite likely that you might get another leg” of that move, because a market rarely makes one strong move and then a second strong move straight back the other way.
Each layer answered a different question. The pattern said where a turn could come from, the moving averages said the turn had not been confirmed, and the price action said the large move down might not be finished. None of the three would have been enough alone, and all three together took less time to say than this paragraph takes to read.
That is roughly how my own charts look every day. I use three moving averages, a volume pane, and an RSI that serves as a caution flag rather than a trigger. I leave out the MACD, the Bollinger Bands and the Stochastics, and when I teach a structure I often say I have “tidied up my chart” and strip it back to price and one pattern. A strong trend can keep the RSI overbought for a long time, so I treat it as a warning light and let the chart make the decision. The four setups I tag my own trades with are in the 4 types of trading strategies.
Personally, I think the goal is the smallest set of tools that finds good opportunities with the least effort. If a tool is not earning its place on your chart, take it off. A cleaner chart is easier to read, and an easier chart is easier to trade.
Keeping a chart clean is a habit, and habits are easier to keep with a routine. The free 15-minute swing trader checklist is the one I run.
Are indicators just lagging, and does any of this work?
In July 2025, a beginner on Reddit’s r/technicalanalysis asked whether technical analysis really works. They added, about indicators, “i think most of them are lagging”.
They are right about the lag, and I would not argue with it. Every indicator is built from past prices, so it lags the price by design, and that is exactly why I use them to confirm a read rather than to start one. The price itself has no lag, which is why classical charting and price action do most of the work on my charts.
The bigger question deserves an honest answer too. In 2007, David Aronson published Evidence-Based Technical Analysis, in which he tested 6,402 mechanical technical rules on the S&P 500 from 1980 to 2005, and once he corrected for the number of rules searched, not one of them survived. He also argued that most hand-drawn charting cannot be tested at all, because it cannot be turned into a rule a computer could follow. In his words, “the majority of objective TA methods” will fail when tested properly.
So I will concede the point, as at 2007. A single indicator rule, used alone and taken on faith, is a fragile thing to build a trading plan on, and a trader who ignores that can blow up an account believing a backtest. What I take from Aronson is to treat any tool as a hypothesis to test with small size, and to judge a method across 100 to 200 trades, never on a handful of wins.
FAQ
What are the 3 types of technical analysis?
Classical charting, which reads support and resistance, trendlines and patterns by eye, technical indicators, which run formulas on price and volume, and price action, which reads the bars themselves. Most traders use a mix of all three.
Which type of technical analysis is best?
No single type is best, because each answers a different question. Charting shows the structure, indicators confirm the trend or momentum, and price action helps with timing. The best mix is the smallest one that finds good trades with the least effort.
Is price action better than indicators?
Neither is strictly better. Indicators are built from past prices, so they lag and work best as confirmation. Price action reads price directly, so it is better for timing. Many traders use price action for entries and one or two indicators to confirm.
How many indicators should I use?
As few as possible. Two or three that measure different things, such as one for trend and one for momentum, will do more than a screen full of indicators that repeat the same reading.
Who invented technical analysis?
No single person. Charles Dow’s ideas from around 1900 are usually treated as the start of Western charting, Edwards and Magee catalogued the chart patterns in 1948, and Japanese candlestick methods are older still.
Which of the three do you lean on most, and how many indicators are on your chart right now? Let me know in the comments.
If you are just starting out, the pieces in my free trading guides put these tools in order.

If you would like to learn how to get started in trading, also check out: “The Beginner’s Guide to Trading & Technical Analysis”
And if you want a routine that uses all three types without hours at the screen, grab the free 15-minute swing trader checklist.
About the author. Spencer Li is The 15-Minute Trader and the founder of Synapse Trading. He is a Certified Financial Technician (CFTe) with 15+ years of trading, run from 70+ countries. He holds a B.Acc and B.BM from SMU. Every trade he takes is public, dated, losses left in. He teaches rules-based swing trading in 15 minutes a day, one system for any market.
Education, not financial advice. Synapse Trading is not licensed by MAS to advise on investment products. Trading carries risk of loss, and past performance is not indicative of future results.
Want the daily routine? Enter your email for the free 15-Minute Swing Trader's Checklist.
Free 5-page PDF, then occasional trading emails. Education only, not financial advice. Unsubscribe anytime. Kit stores your email in the US: see our privacy policy.
Want to learn the full method? The Trading Mastery Program teaches the 4 strategies I have traded since 2011. It suits beginners and experienced traders.
Rather follow the trades as they happen? Daily Trading Signals is our Telegram channel: my trade ideas with entry, stop and exit, and every trade is public.
Questions about this post? Ask in the free Telegram channel →
Educational content only, not personalised financial advice. Trading carries risk, including loss of capital. Past performance is not indicative of future results. Synapse Trading is not licensed or regulated by MAS.

