
• Link to Facebook
  • Link to X
  • Link to Instagram
  • Link to Youtube
  • Link to LinkedIn
  • Link to Mail
Synapse Trading
  • Home
  • About
    • My Background
    • My Trading Journey
    • My Travel Log
    • Media & Interviews
  • Mentoring
    • Trading Mastery Program
    • Results & Testimonials
  • Signals
    • Telegram (Free to join!)
    • Daily Trading Signals
    • Daily Trading Signals (Results)
  • Resources
    • Free Trading Guides
    • Tools & Resources
    • Blog & Infographics
  • Contact
    • Contact Us
    • Partnership Opportunities
  • Click to open the search input field Click to open the search input field Search
  • Menu Menu

Tag Archive for: candlestick patterns

Spencer Li

Hanging Man Candlestick Pattern Trading Strategy Guide

Technical Analysis & Price Action
Thumbnail Hanging Man Candlestick Pattern Trading Strategy Guide

Thumbnail Hanging Man Candlestick Pattern Trading Strategy Guide


The Hanging Man Candlestick Pattern is a technical analysis tool used in trading to identify potential reversals in the market.

This pattern is formed when the price of an asset opens at a high and then closes lower, creating a candle with a long downward wick and a small body.

The pattern gets its name from the shape of the candle, which looks like a person hanging by their feet.

While it is not as well-known as other candlestick patterns, such as the Bullish Engulfing Pattern or the Bearish Engulfing Pattern, the Hanging Man Pattern can be a valuable tool for traders looking to enter or exit a position.

In this blog post, I’m going to teach you all about this candlestick pattern, how to identify it, the strategies to trade it, and some practical applications of this pattern.


How to Identify the Hanging Man

  • The Hanging Man Pattern is characterized by a small body and a long downward wick.
  • The small body can be either bullish or bearish, but the long downward wick is always bearish.
  • The body of the candle is typically located at the top of the candle, near the open price, and the downward wick extends below the body.

Psychology of the Pattern

  • The Hanging Man Pattern is often seen as a bearish reversal pattern, indicating that the price may be about to fall after a uptrend.
  • This pattern suggests that the bears are starting to gain control of the market, as they push the price down from the high open.
  • However, it is important to note that the Hanging Man Pattern is not always a strong reversal signal and should be used in conjunction with other technical analysis tools.

How to Use it to Trade

  • One way to use the Hanging Man Pattern is to trade the reversal by selling a long position or buying a short position.
  • Another way to trade the pattern is to wait for confirmation of the reversal, such as with a bearish candle following the Hanging Man Pattern.
  • It is also important to consider the overall trend and the strength of the pattern when making a trade decision.

Trading Strategies for the Hanging Man Pattern

  • One strategy for trading the Hanging Man Pattern is to enter a short position after the pattern has formed and wait for the price to fall.
  • Another strategy is to enter a long position on a breakout above the high of the Hanging Man Pattern, as this may indicate a continuation of the uptrend.
  • It is also possible to use the Hanging Man Pattern as a stop loss strategy, by placing a stop loss order below the low of the pattern.

Where to Enter a Trade

  • One option for entering a trade based on the Hanging Man Pattern is to place a market order at the open of the next candle following the pattern.
  • Another option is to use a limit order, setting the entry price at a level above or below the pattern, depending on the direction of the trade.

Where to Place the Stoploss

  • One option for placing a stop loss when trading the Hanging Man Pattern is to use a percentage of the asset’s trading range, such as 2-3%.
  • Another option is to place the stop loss at a level below the low of the Hanging Man Pattern, as this may provide a clear level for the stop loss to be triggered if the price moves against the trade.

Where to Take Profit on the Trade

  • One way to take profit when trading the Hanging Man Pattern is to use a target price based on the size of the pattern and the expected move.
  • Another option is to use a trailing stop loss, which allows the trade to remain open as long as the price continues to move in the desired direction.

How to Combine with Trendlines

  • Trendlines can be a useful tool for identifying the trend  and potential reversal points in the market. When combined with the Hanging Man Pattern, trendlines can help traders confirm the reversal signal and make more informed trade decisions.
  • For example, if the Hanging Man Pattern forms after an uptrend and is accompanied by a trendline break, this may provide further confirmation of a potential trend reversal.
  • Similarly, if the Hanging Man Pattern forms after a downtrend and is accompanied by a trendline bounce, this may indicate a potential trend continuation.

How to Combine with Support and Resistance Levels

  • Support and resistance levels can also be useful for identifying potential reversal points in the market. When combined with the Hanging Man Pattern, these levels can help traders confirm the reversal signal and make more informed trade decisions.
  • For example, if the Hanging Man Pattern forms near a strong support level, this may indicate that the price is likely to bounce off the support and continue the uptrend.
  • On the other hand, if the Hanging Man Pattern forms near a strong resistance level, this may indicate that the price is likely to break through the resistance and continue the downtrend.

How to Combine with Price Patterns

  • Combining the Hanging Man Pattern with other price patterns, such as head and shoulders or double tops, can also provide further confirmation of a potential trend reversal.
  • For example, if the Hanging Man Pattern forms at the top of a head and shoulders pattern, this may indicate that the price is about to reverse and move lower.
  • Similarly, if the Hanging Man Pattern forms at the top of a double top pattern, this may also indicate a potential trend reversal to the downside.

How to Combine it with Price Action

  • Price action trading involves analyzing the movement of the price itself, rather than relying on indicators or other technical analysis tools. Combining the Hanging Man Pattern with price action analysis can provide a more complete picture of the market and help traders make more informed trade decisions.
  • For example, traders can look for other price action signals, such as bearish engulfing patterns or bearish harami patterns, to confirm the reversal signal provided by the Hanging Man Pattern.

How to Combine it with Trend-following Indicators

  • Trend-following technical indicators, such as moving averages and MACD, can be useful for identifying the overall trend and potential reversal points in the market. When combined with the Hanging Man Pattern, these indicators can help traders confirm the reversal signal and make more informed trade decisions.
  • For example, if the Hanging Man Pattern forms after an uptrend and is accompanied by a bearish crossover in the moving averages or a bearish divergence in the MACD, this may provide further confirmation of a potential trend reversal.

How to Combine with Oscillators

  • Oscillator indicators, such as RSI and Stochastics, can be useful for identifying overbought and oversold conditions in the market. When combined with the Hanging Man Pattern, these indicators can help traders confirm the reversal signal and make more informed trade decisions.
  • For example, if the Hanging Man Pattern forms after an uptrend and is accompanied by an overbought reading in the RSI or a bearish crossover in the Stochastics, this may provide further confirmation of a potential trend reversal.

Limitations of Hanging Man Pattern

  • It is important to note that the Hanging Man Pattern is not a reliable reversal signal on its own and should be used in conjunction with other technical analysis tools.
  • The pattern may also be less reliable in volatile or low volume markets, as these conditions may create false signals.
  • Additionally, the Hanging Man Pattern may not always indicate a trend reversal, as it can also occur during a consolidation or sideways movement in the market.

Practical Applications

The Hanging Man Pattern has helped me in my personal trading by providing potential reversal signals that I can use to enter or exit positions.

For example, when trading for a living as a full-time trader, it is important to be able to identify potential reversals in order to maximize profits and minimize losses.

By using the Hanging Man Pattern as one of my technical analysis tools, I have been able to improve my trade timing and make more informed decisions about when to enter or exit a position.

As a professional trader, I have found that the Hanging Man Pattern can be a valuable tool for identifying potential reversals in the market.

By using this pattern in combination with other technical analysis tools, such as trendlines and oscillator indicators, I have been able to improve my trade accuracy and increase my profits.

For example, when the Hanging Man Pattern forms at a key resistance level and is accompanied by a bearish divergence in the RSI, I have often found this to be a strong signal to sell.

Concluding Thoughts

In conclusion, the Hanging Man Candlestick Pattern is a technical analysis tool that can be used to identify potential reversals in the market.

While it is not a reliable signal on its own, it can be a useful tool when combined with other technical analysis techniques, such as trendlines, support and resistance levels, and oscillator indicators.

By using the Hanging Man Pattern in my personal trading, I have been able to improve my trade timing and make more informed decisions about when to enter or exit a position.

However, it is important to remember that no single technical analysis tool is foolproof and that it is always important to consider the overall market conditions when making trade decisions.

Now that I have covered all about this candlestick pattern, is it something that you will add to your trading toolbox?

Let me know in the comments below.


ed seykota

If you would like to learn more about all the different candlestick patterns, also check out: “The Definitive Guide to Candlestick Patterns”

0 Comments/by Spencer Li
https://synapsetrading.com/wp-content/uploads/2022/12/Thumbnail-Hanging-Man-Candlestick-Pattern-Trading-Strategy-Guide.png 720 1280 Spencer Li https://synapsetrading.com/wp-content/uploads/2019/10/logo.jpg Spencer Li2022-12-27 01:40:032023-01-10 01:43:12Hanging Man Candlestick Pattern Trading Strategy Guide
Spencer Li

Hammer Candlestick Pattern Trading Strategy Guide

Technical Analysis & Price Action
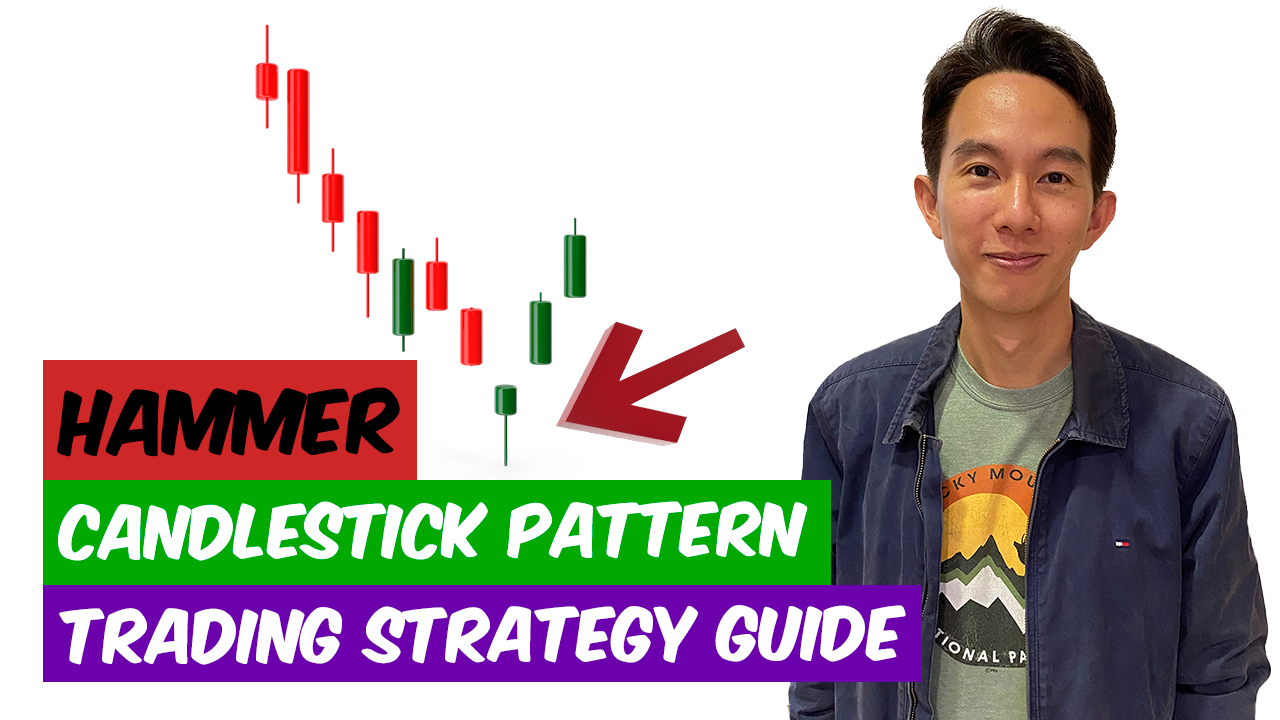
Thumbnail Hammer Candlestick Pattern Trading Strategy Guide

Thumbnail Hammer Candlestick Pattern Trading Strategy Guide


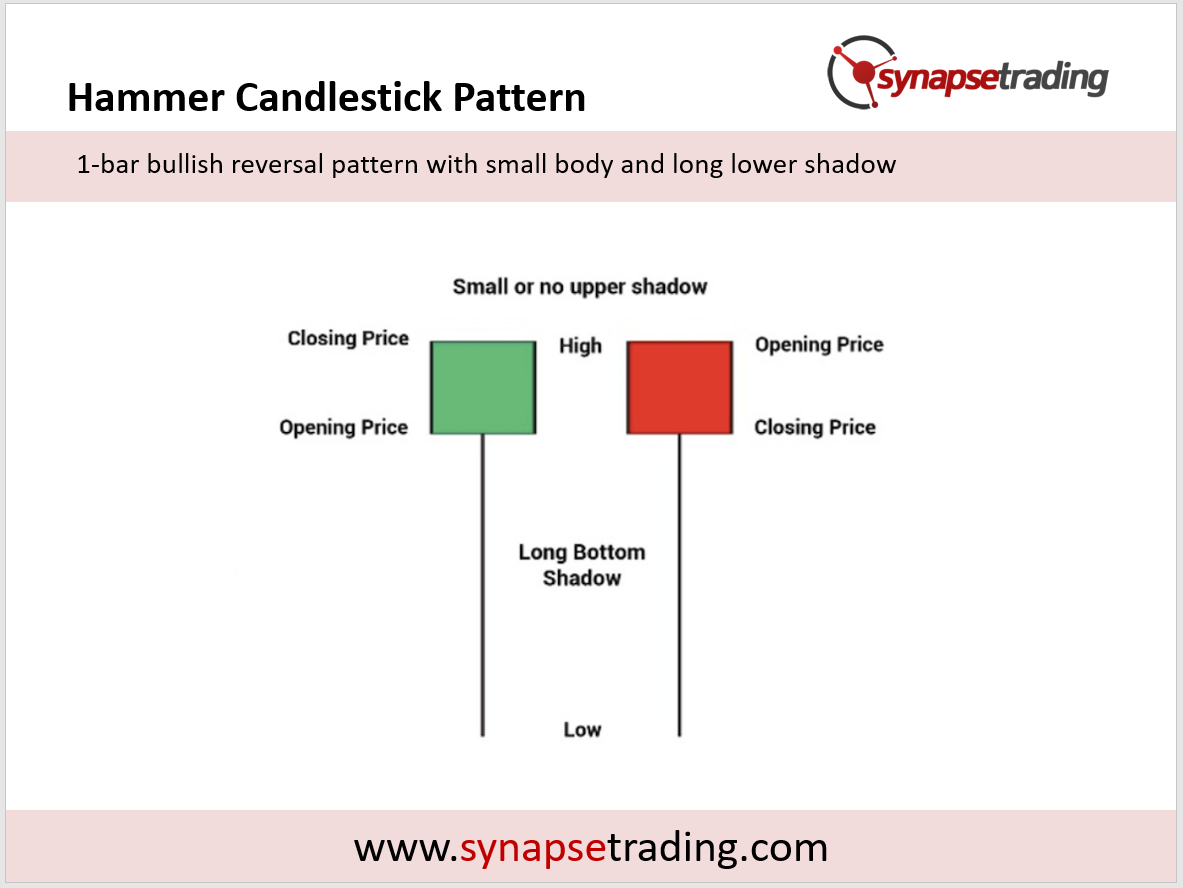
The hammer candlestick pattern is a bullish reversal pattern that consists of a single candlestick with a small body and a long lower shadow.

It is called a “hammer” because it looks like a hammer with the handle being the small body and the head being the long lower shadow.

The pattern is typically seen as a sign of bullish sentiment and indicates that the trend may be about to reverse from a downtrend to an uptrend.


hammer candlestick pattern summary


In order to understand the psychology behind the hammer pattern, it’s important to understand the context in which it typically occurs.

The pattern usually forms after a significant price decline and indicates that the bulls (buyers) are starting to regain control of the market.

As the price falls, the bears (sellers) become more and more confident that the downtrend will continue. However, at some point, the bulls start to step in and start buying, pushing the price back up towards the opening price.

This causes the long lower shadow to form, as the price is pushed back up towards the opening price but ultimately closes lower than where it opened.

The long lower shadow of the hammer pattern indicates that the bulls were able to push the price back up towards the opening price, and this can be seen as a sign of strength.

It suggests that the bears may be losing control and that the trend may be about to reverse.

The most common way to use the hammer pattern in trading is to wait for the pattern to form and then enter a long position (buy) when the price breaks above the high of the hammer candlestick.

This is known as a “breakout” strategy and involves placing a stop loss order just below the low of the hammer candlestick.

The idea is to let the trade run until the price reaches a level where it is no longer considered favorable, at which point the stop loss order will be triggered and the trade will be closed.

In terms of where to place the stop loss and take profit orders, it’s important to consider the overall trend and the specific market conditions.

In a strong uptrend, it may be appropriate to place the stop loss order closer to the entry point, as the likelihood of a trend reversal is relatively low.

On the other hand, in a weaker or more uncertain market, it may be appropriate to place the stop loss order farther away from the entry point to allow for more room for the trade to develop.

As for the take profit order, it’s important to consider the potential reward relative to the risk.

In general, it’s a good idea to aim for a reward that is at least twice the size of the risk, as this allows for a higher probability of success.

It’s important to note that the hammer candlestick pattern is just one of many tools that traders can use to make informed decisions about the market.

While it can be a useful indicator of potential trend reversals, it should not be used in isolation and should be considered in conjunction with other technical and fundamental analysis tools.

One way to combine the hammer pattern with other technical analysis techniques is to use it in conjunction with trendline analysis.

For example, if the hammer pattern forms after a significant price decline and the price subsequently breaks above a downward-sloping trendline, it may be a strong indication of a trend reversal.

Similarly, if the hammer pattern forms after a significant price decline and the price subsequently breaks above a key resistance level, it may also be a strong indication of a trend reversal.

Another way to combine the hammer pattern with other technical analysis techniques is to use it in conjunction with oscillators such as the relative strength index (RSI) or the moving average convergence divergence (MACD).

For example, if the hammer pattern forms after a significant price decline and the RSI or MACD is showing an oversold condition, it may be a strong indication of a trend reversal.

It’s also important to consider the overall market environment when using the hammer pattern.

For example, if the pattern forms during a period of high volatility, it may be a less reliable indicator of a trend reversal compared to if it forms during a period of low volatility.

One of the limitations of the hammer pattern is that it can be prone to false signals.

For example, if the pattern forms after a relatively small price decline, it may not be a strong enough indication of bullish sentiment to warrant a trade.

In addition, if the pattern forms in the midst of a strong downtrend, it may not be a reliable indicator of a trend reversal.

Another limitation of the hammer pattern is that it does not provide any information about the duration or strength of the potential trend reversal.

While it may indicate that the trend is about to reverse, it does not provide any insight into how long the reversal may last or how strong it may be.

In summary, the hammer candlestick pattern is a useful tool for traders looking to identify potential trend reversals.

It should be used in conjunction with other technical and fundamental analysis tools and with a clear understanding of the limitations of the pattern.

By carefully considering the overall trend, market conditions, and the potential reward relative to the risk, traders can use the hammer pattern to make informed decisions about their trades.


ed seykota

If you would like to learn more about all the different candlestick patterns, also check out: “The Definitive Guide to Candlestick Patterns”
 

0 Comments/by Spencer Li
https://synapsetrading.com/wp-content/uploads/2022/12/Thumbnail-Hammer-Candlestick-Pattern-Trading-Strategy-Guide.png 720 1280 Spencer Li https://synapsetrading.com/wp-content/uploads/2019/10/logo.jpg Spencer Li2022-12-21 03:21:572023-01-10 01:47:59Hammer Candlestick Pattern Trading Strategy Guide
Spencer Li

Full-House Event @SPH – Practical Use of Candlestick Patterns

News & Events

Last week, I was invited by ShareInvestor Academy to conduct a half-day skills training workshop at SPH to share how professional traders use candlestick patterns differently.
https://synapsetrading.com/shareinvestor-academy-training-practical-use-candlestick-patterns/
https://synapsetrading.com/featured-straits-times-paper-business-times/

It was an awesome FULL HOUSE event, with participants from all walks of life, and they got 3 hours of intensive skills training, followed by some hands-on market case studies and market outlook.

Based on the heart-warming feedback we have received so far, we look forward to conducting another session in the future. If you know any friends or family who want to want to create a second source of income, do ask them to sign up for our mailing list so that they can receive priority updates for the next session!

A big thanks to ShareInvestor, SPH, Lim & Tan, our wonderful Synapse Network Team, and everyone who helped make this event a success! 🙂

P.S.  For those who were asking whether we had a full training program, you can check out more details here: https://synapsetrading.com/events/the-synapse-program/

SPH Event Oct 2014 (1)

SPH Event Oct 2014 (3)

SPH Event Oct 2014 (29)

SPH Event Oct 2014 (31)

SPH Event Oct 2014 (33)


0 Comments/by Spencer Li
https://synapsetrading.com/wp-content/uploads/2019/10/logo.jpg 0 0 Spencer Li https://synapsetrading.com/wp-content/uploads/2019/10/logo.jpg Spencer Li2014-10-12 18:27:332026-09-01 23:18:03Full-House Event @SPH – Practical Use of Candlestick Patterns
Spencer Li

ShareInvestor Academy Training | Practical Use of Candlestick Patterns

News & Events
practical use of candlestick patterns 1

Due to overwhelming support from the last session, I have once again been invited by ShareInvestor to share some of my trading skills that are used by real professional traders.
https://synapsetrading.com/half-day-intensive-skills-training-workshop-at-sph-full-house/
https://synapsetrading.com/full-house-event-sph-portfolio-strategies-of-professional-traders/

We capped it as 60 pax for the last session, and it was full house. Those who are keen can sign up via this link:
http://www.shareinvestor.com/sg/events/signup?id=192#sic_signUp

See you there! 😀

practical use of candlestick patterns 1 practical use of candlestick patterns 2


0 Comments/by Spencer Li
https://synapsetrading.com/wp-content/uploads/2014/10/practical-use-of-candlestick-patterns-1.png 852 673 Spencer Li https://synapsetrading.com/wp-content/uploads/2019/10/logo.jpg Spencer Li2014-10-03 03:47:282021-10-01 16:21:19ShareInvestor Academy Training | Practical Use of Candlestick Patterns

Free Trading Guides

Free Trading Guides

Blog Categories

  • Beginner's Guide
  • Blockchain & Crypto
  • Book Summaries
  • Economics & News Trading
  • Investing & Portfolio Management
  • Living Your Best Life
  • Market Analysis
  • Markets & Products
  • News & Events
  • Promotions
  • Risk & Money Management
  • Stock Trading
  • Technical Analysis & Price Action
  • Testimonials
  • Tools & Resources
  • Trading Psychology
  • Trading Strategies
  • Trading Tips
  • Travel & Lifestyle

Free Trading Guides

Free Trading Guides

Contact Us

Synapse Trading Pte Ltd
Registration No. 201316168H

Whatsapp: +65-8897-1204
Telegram: @iamrecneps
Email: info@synapsetrading.com

Links

Disclaimer
Privacy policy
Terms & Conditions
Contact us
Partnerships

© 2012-2024 Synapse Trading | All rights reserved | - powered by Enfold WordPress Theme
  • Link to Facebook
  • Link to X
  • Link to Instagram
  • Link to Youtube
  • Link to LinkedIn
  • Link to Mail
Scroll to top Scroll to top Scroll to top