Is the Stock Market Heading for a Correction? (While Bitcoin Surges…)
Join our Telegram channel for more market analysis & trading tips: t.me/synapsetrading
After the sharp run-up in stocks from last year’s March lows, some people are starting to wonder if the market has got a bit too bubbly.
In this post, we will compare the different stock indices, as well as some other products, to see if there are any good opportunities.
Table of Contents
The Meteoric Rise of Bitcoin
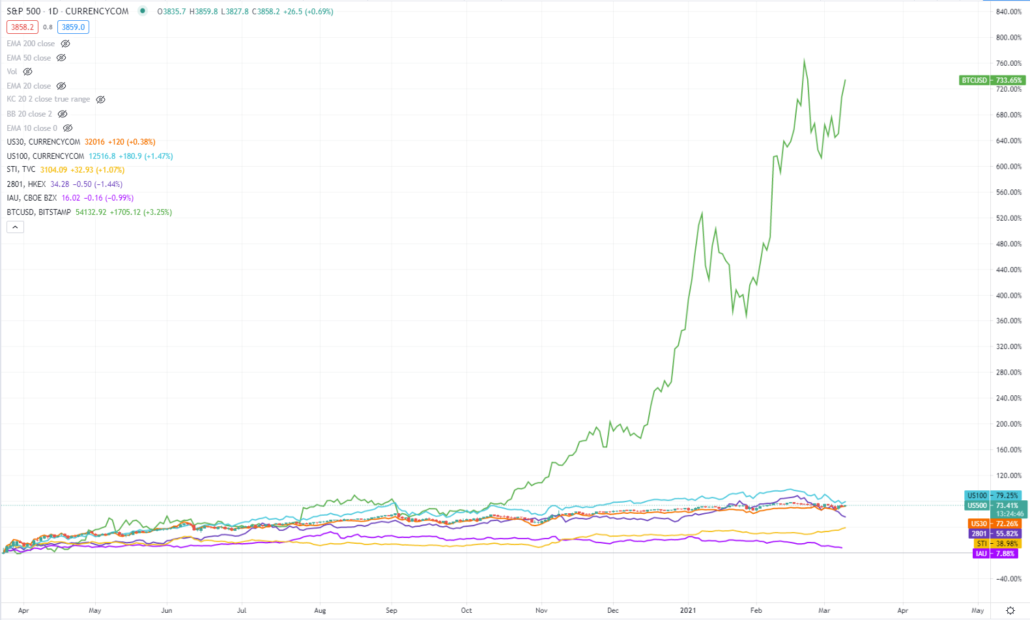
When placed on the same scale, the epic 700+% returns on Bitcoin (BTC/USD) dwarfs everything else, and has also provided some of the best returns for my portfolio last year.
Looking at its strong trend, it does look like there are a few more legs for it to go, so I will hold onto it for now.
To see the rest of the products, I will now remove Bitcoin from this comparison.
Overview of Various Markets
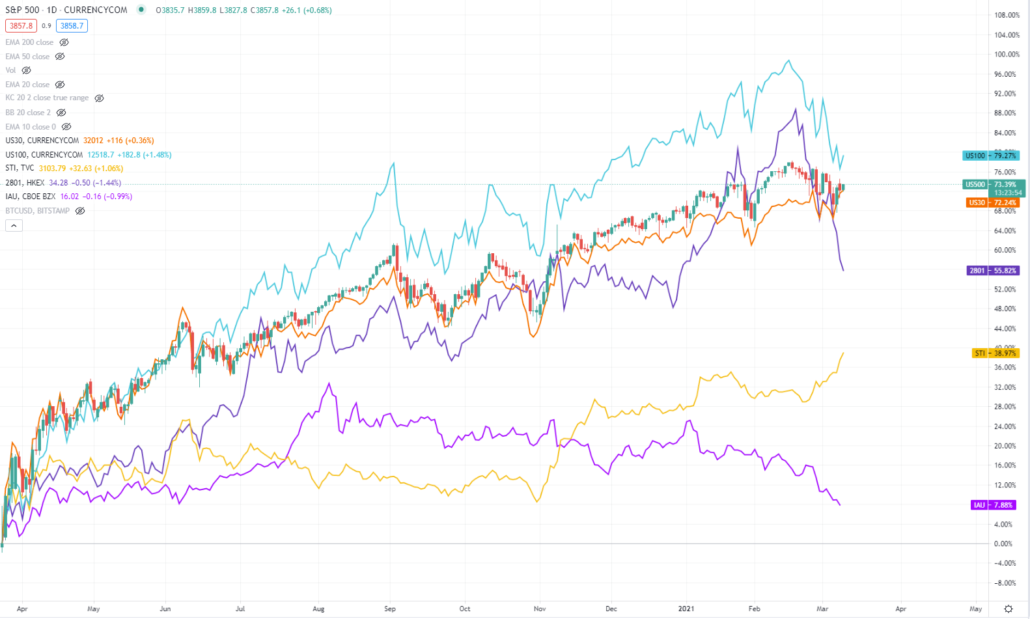
The top 3 you see are the 3 indices of the US stock market, and the one in candles is the S&P 500. The other 2 are the Dow Jones Index and the NASDAQ.
The Nasdaq had the sharpest recovery at the start, but the other 2 recently caught up, especially in the last few weeks where the NASDAQ corrected sharply.
So in terms of percentage recovery, all 3 indices are roughly at the same level.
Next if we look at the line in dark purple (2801), which is one of the China Stock ETFs which I invest in, it had a good run, and just earlier this year it was on par with the NASDAQ.
However, in recent weeks, it has corrected sharply and is now below the 3 US stock indices.
The STI Index (Singapore market) was pretty much lackluster last year, but has picked up in recent months, making it one of the top performing stock markets this year.
The last line on the chart is Gold (one of the Gold ETFs to be specific), and it seemed to have hit its recent peak in August last year.
Will Rising Rates Kill the Stock Market?
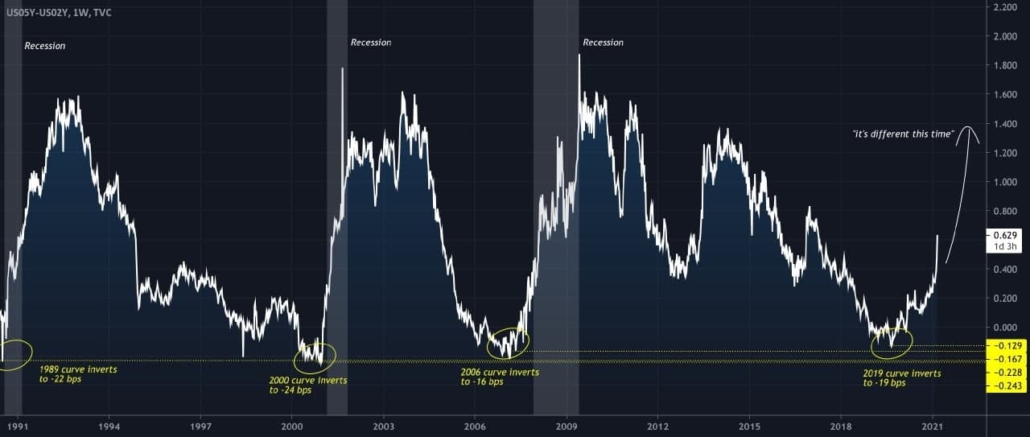
Historically, rising yields have led to recessions, but the lag time could be years, so it’s not like we won’t be able to see it coming as it happens.
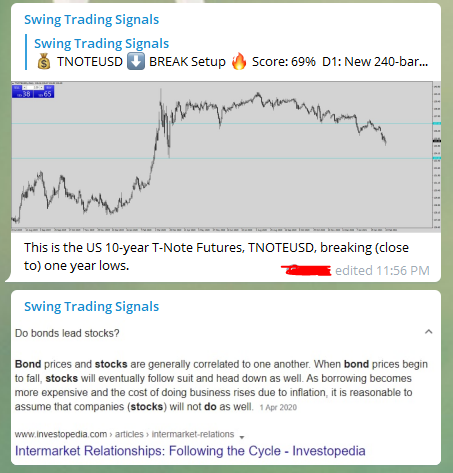
Looking at the charts of bond prices (which are an inverse of interest rates), we can see that it peaked around the same time the stock market bottomed (March 2020), and in recent weeks has been dropping faster.
This in itself it not necessarily a bearish indication for stocks, because it is more of a sign of potential rising inflation, but as long as inflation remains low, then it may not necessarily be bad for stock prices.
Which means the best way is still to check out the charts of the stock indices.
Chart Analysis of S&P 500
In summary, the stock indices are currently trading within a sideways range after a long run-up, so it won’t be surprising if there is some medium-term correction before the trend continues.
Stay tuned for more real-time market updates in our Telegram channel:
?? https://t.me/synapsetrading
 Our flagship mentoring program is suitable for both beginners and advanced traders, covering the 4 strategies which I used over the past 15 years to build up my 7-figure personal trading portfolio.
 If you're looking for a reputable brokerage that covers all products (SG stocks, US stocks, global stocks, bonds, ETFs, REITs, forex, futures, crypto) and has one of the lowest commissions, this is what I currently use.
After trading for 18 years, reading 1500+ books, and mentoring 1000+ traders, I specialise in helping people improve their trading results, by using tested trading strategies, and making better decisions via decision science.




Leave a Reply
Want to join the discussion?Feel free to contribute!