Learn more about trading strategies, products, analysis, tools to help you supercharge your trading results!

reading financial statements

If you really want to know how a company is doing, you need to read their financial statements. It’s the fastest and most reliable way to know if a company is doing well or struggling to survive.

There are three different kinds of financial statements: the balance sheet, the income statement and the cash flow statement. First, let’s start with the balance sheet. This summarizes a company’s assets, liabilities and equity at a specific time.

Assets are broken down into two categories: current assets which include cash and highly liquid investment securities, and non-current assets which include any property buildings plants equipment & company software. Next, are the company’s liabilities which are also broken down into two categories: current liabilities which include bank loans accounts payable and other payables like payroll and accrued expenses and non-current liabilities which include any long-term loans or financial obligations. If you subtract the total liabilities from the total assets, you get the total shareholders equity.

Now, let’s move to the company’s income statement. This measures how much profit or loss the company has made over a specific period of time, which is why it’s also referred to as a P&L statement. First, you have revenue which is the amount of money the company makes by selling products or providing services.

Next, come cogs or cost of goods sold which is the amount spent producing or acquiring the products or services, including material and labor costs, subtract cogs from revenue and you’ve got gross profit. Then, come the operating expenses which include day-to-day things like marketing costs, indirect labor costs and so on, subtract that from gross profit and you’ve got operating income. Next, take that number and subtract all other miscellaneous expenses and you’ve got the company’s profit before taxes, subtract the taxes and you’ve got the net profit.

And that leads us to the third financial statement, the cash flow statement. This measures how much cash flows in and out of a company over a specific period because a company’s revenue and expenses can be delayed or deferred. This shows the actual cash flowing in and out of the company. First, you add together the cash flows from all operating activities including profit before taxes, trade and other receivables, and trade and other payables then you add the cash flows from investment activities along with the cash from financing activities. You then, compare the cash at the beginning of the financial year to the cash at the end, to determine if the company had a positive or negative cash flow and that’s how you read a company’s financial statements.

In our next video we’ll go even further and learn what these numbers actually mean.

finding value in stocks

To be a successful value investor in the stock market, you need to know how to identify which stocks are the most valuable. But the most valuable stocks aren’t necessarily the ones that are performing the best. In fact, the real goal is to find stocks with strong intrinsic value that are currently under valued by the market. So how do you identify these gems?

First, find the right type of business.

In general, you should always start with what you know. For instance, if you’re familiar with the technology sector, you may want to look there. Just make sure that the industry isn’t experiencing long term challenges. This will help you avoid eroding profits in the future.

Next, look for a company with a strong and sustainable competitive advantage. For instance, if a company has a patent on an emerging technology, this could help them for years to come. Finally, make sure the company has strong growth potential and a clear strategy for the future. Is there a growing demand for their product? Do they have the infrastructure necessary to expand?

Questions like these can help gauge their future success.

The second way to identify intrinsic value is to study a company’s management team.

Do some research.

See if they have the proper credentials and make sure that their skill sets are well suited for the current business climate and of course, look at their track records. Were they successful in their recent positions or did they leave those companies weaker than before? And, are they transparent with their shareholders? Executives who are open to new ideas and willing to adapt are generally more capable of overcoming future challenges.

Next, have they laid out a clear plan for future growth if not you should be concerned and how are they paid? Do they receive a flat salary or is it performance-based? And do they own a significant stake in the company? Executives who are themselves invested in their company’s success are more likely to put their shareholders first.

The third and final way to identify intrinsic value, is to analyze the company’s financial numbers.

But this topic requires a lot of attention, which is why we’ll cover it in our next video reading financial statements.

Riding the Big Market Cycles – 2b What Moves the Markets

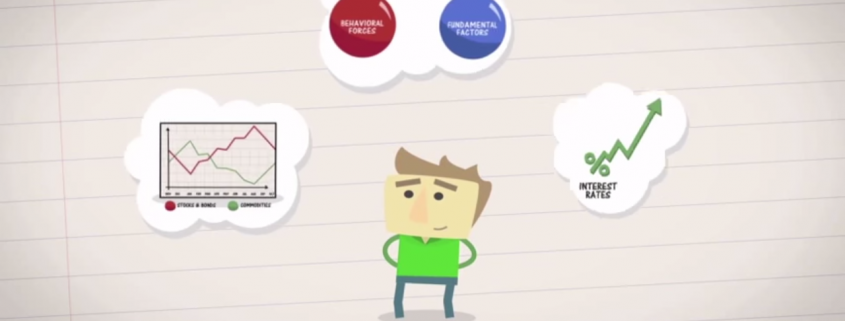
We’ve seen how the markets move in cycles but what are the factors that govern those movements? It’s many things but they can be grouped into two main categories: fundamental factors like monetary, policy, balance of trade and unemployment, and behavioral forces like how people respond to these policies. These two factors are always playing off each other in a series of actions and reactions like a cause and effect loop.

Now, as an investor, the key is to focus on the sequence of events in the business cycle and identify clues to determine what’s coming next. In general, the market goes through two phases: expansion which is generally good and contraction which is generally bad.

During the early stages of expansion, the recovery is driven primarily by fundamental factors as economies expand, and trade and employment picks up. Central banks usually tighten their policies to keep inflation down which is good for stocks and bonds, but not so good for commodities. These fundamentals lead to a rise in stock prices which only encourage more people to jump into the market. It’s good at first but as this greed and exuberance spreads, stock prices eventually outpace their actual value.

This leads to inflation, which is marked by an increase in commodity prices to counteract these behavioral forces. Central banks usually step in and increase interest rates, which help curb the money supply and decrease inflation. This action signals that the expansion is ending and stocks will soon be on the decline, but it also means that commodity related products will be going up. If you’re aware of these signals, you’ll know that this is a good time to switch from stocks to commodities.

Then during the recession that follows, behavioral forces will become stronger than ever, as more people realize that the stock market is declining. Fear and panic will spread, forcing even more to sell off their shares during these periods savvy investors will reduce their stock portfolios and wait for the market to turn around which they will because eventually central banks will step in and cut interest rates to increase the money supply. These fundamental drivers will lead to a rise in stock prices making it the perfect time to jump back in the market and that starts the cycle all over again.

Now as an investor, it’s important to recognize these signals and never lose sight of the bigger picture. It’s like Warren Buffett once said, be fearful when others are greedy and greedy when others are fearful. So, keep an eye on the fundamental and behavioral factors that move the market and always stay one step ahead of the game.

Riding the Big Market Cycles – 1a Business Market cycles

Just like the seasons, financial markets go through cycles and by applying basic economic principles and portfolio strategies, you can capitalize on these big market movements to either ride the wave or weather the storm. In general, each market cycle lasts about four to five years, and within each cycle are usually six stages.

During each stage, certain asset classes outperform others. That’s why it’s important to buy the right asset class at the right time and to always hold a good mix which diversifies your risk. So what are the six stages of the market cycle and what should you do in each?

Let’s start with stage one which begins with the market contracting. This is a good time to buy bonds as central banks will lower interest rates and expand the money supply to improve the economy, thus boosting bond prices.

During the second stage as the market hits bottom, you’ll want to buy more stocks especially in financials. You can buy them cheap and hold on to them as the market turns around as it did from 2003 to 2007.

As the bull market progresses into stage three and the economy kicks into full gear, there will be an increased demand for raw materials, which will lead to inflation, making it a good time to buy inflation sensitive products such as commodity tracking ETFs.

Then, during the fourth stage as the bull market reaches the late stage you’ll want to reduce your bond holdings as they’ll be peaking.

In the fifth stage as the market hits its ceiling and stock prices are maxing out. You should look to reduce your stock holdings in favor of more commodity ETFs. For example, when the stock market declined in late 2007, stocks dropped significantly but commodities continued to climb meaning if you had swapped stocks for commodities when the market was peaking, you would have avoided losses and made a profit even as the stock market weakened.

And finally, there’s the sixth stage of the cycle when the economy contracts and all asset classes begin to decline. This is a good time to acquire defensive stocks like public transportation and healthcare companies which are less affected during downturns.

Of course, if you’re a long-term stock investor, you may not need to switch around asset classes as long as you’re able to stomach the big market corrections. You can take the buy and hold approach instead and accumulate fundamentally strong stocks and profit during stages three and four as the market expands.

So those are the basic principles of market cycles. Next, we’ll dig deeper and figure out what causes the market to move in the first place.

1b Stock Market Basics

The stock market is a great place to generate wealth but before getting started, you have to understand a few basic terms. For instance, stock share and equity.

They’re all synonymous, all representing a partial ownership of a company. So, if you buy stock in Apple or SingTel, you officially own a share of the company. Buy 1000 shares and a company that offers 100,000 shares and you own 1%. Owning shares allows you to benefit from a company’s growth and profits in the form of capital gains and dividend payouts.

Capital gains represent the difference between the purchase price of an investment and the eventual selling price, so if you buy one share of a company for $1 and eventually sell that share for 5 dollars, you receive $4 in capital gains per share.

A dividend payout is the percentage of a company’s earnings that get paid to shareholders who have stock in the company, usually on an annual basis.

Those are the basic terms.

Now, let’s look at basic market function. It all starts when a company decides to sell its shares in an initial public offering or IPO. This is when a company goes from being totally private to one that is owned and traded by the public once on the stock market or exchange.

You can purchase stock in that company through a stock broker along with other companies also listed on a stock exchange, which leads us to our next topic how to choose which types of stocks to buy and trade.

One way is to separate them by sectors like financials, real estate, health care, technology and so on. Another approach is to divide them based on the size of the companies, also known as market capitalization.

On the low end are penny stocks which are cheap, volatile but offer high growth potential.

Then, there’s mid-caps which provides solid growth potential with less risk and on the high end, blue chips which are usually larger with strong track records, more stable companies with higher stock prices.

Finally, you could check out stock indices or indexes. These are used to measure the value of a particular section of the stock market.

For example, the S&P 500 index tracks the performance of 500 companies in the US markets giving us a good overview of the health of the overall US markets and in Singapore, there’s the Straits Times Index which tracks the performance of the top 30 companies listed on the Singapore exchange.

Every market has its own benchmark and tracking the indexes is a good way to determine the direction of the market overall, so those are the stock market basics.

Next up, let’s explore some of the other products that can be found in the financial markets.